
At its November 2023 meeting, Council passed a motion proposed by Councillor Chris Moise whose ward covers the east side of downtown, and who also sits on the TTC Board:
1. City Council direct the General Manager, Transportation Services, in consultation with the Toronto Transit Commission, the Toronto Police Service, and the City Solicitor to review and report back to the Executive Committee in the second quarter of 2024, including:
a. an update on streetcar performance over the last five years;
b. suggested improvements to the public realm along King Street until the permanent capital project can be delivered; and
c. the feasibility of implementing automated traffic enforcement on the King Street Transit Priority Corridor, including details on what legislative amendments would be required to provincial legislation including, but not limited to, the Ontario Highway Traffic Act.
This article addresses point “a” with a review of streetcar lines over the past five years. It is important to go back to 2019 before the pandemic fundamentally shifted traffic and transit patterns downtown as a point of reference.
From time to time, there are calls to expand a “King Street” redesign to other parts of the network, but there are two “cart before the horse” issues to address first:
- Figure out how to make King Street operate as it was intended and return at least to its pre-pandemic behaviour, if not better, as a model.
- Understand how other streets operate including where and when problems for transit performance exist.
An update on transit priority will come to Council in February 2024, although this will look more widely at the city, not just downtown. In previous articles I have reviewed the growing problem of transit travel times as traffic builds on the proposed RapidTO corridors, some of which exceeded pre-pandemic levels some time ago. In future articles I will refresh these analyses with data through to the end of 2023.
An important distinction between most RapidTO bus corridors and the downtown streetcar system is the design of suburban vs downtown streets. In the suburbs, the streets are mostly wide, have relatively few points of access (e.g. driveways) or pedestrian oriented uses (e.g. shops), and travel distances tend to be longer. In the core, streets are narrow, mostly four lanes with no possibility of widening, access points are more frequent, there is a strong pedestrian orientation, and trips tend to be short. Even if buses were running, express operations would be almost impossible and would save very little time on the downtown routes.
There are exceptions such as some older parts of the inner suburbs that bring physical challenges for transit priority, but also the political challenge that the transit share of road use is lower as one moves outward from the core. King Street is a very different place from Steeles, and Dufferin is somewhere in between depending on which section one considers.
An important message in all of this is that “congestion” (put in quotes because it is so often cited as a get-out-of-jail-free excuse for all transit woes) varies from place to place and time to time. Simply putting transit priority everywhere will not solve all problems and could even be overkill (even assuming that it is true “priority” and not a sham to keep transit vehicles out of motorists’ way). It is simple to colour a bunch of key routes end-to-end on a map, but much harder to identify changes that will actually make a difference. Meanwhile, a focus on “priority” could divert attention from badly-needed improvements in headway reliability and more reliable wait times.
This article begins with a comparison of scheduled travel speed on each route, and then turns to actual travel speeds by route segment. In the interest of length, I will leave a discussion of headway reliability to future articles. This is an important component of total travel time, especially for short trips or trip segments.
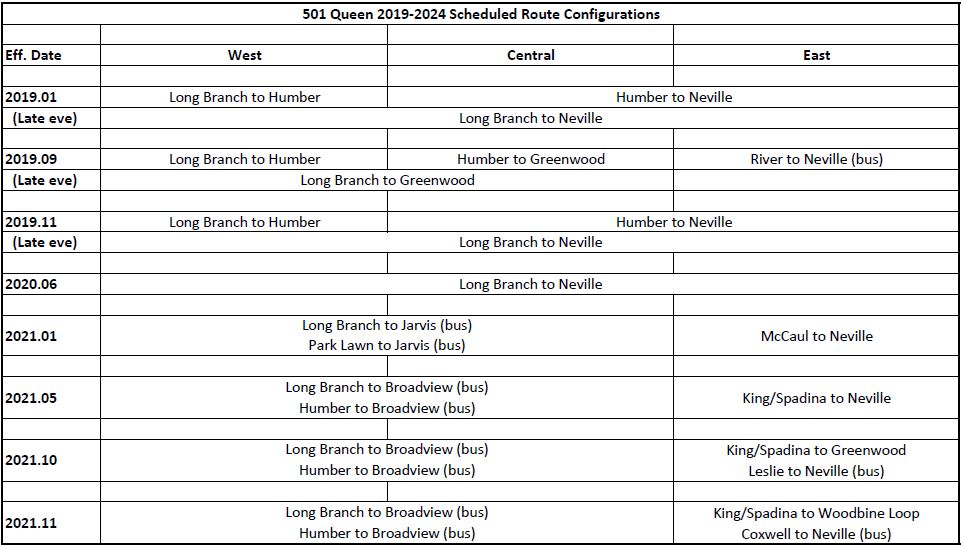
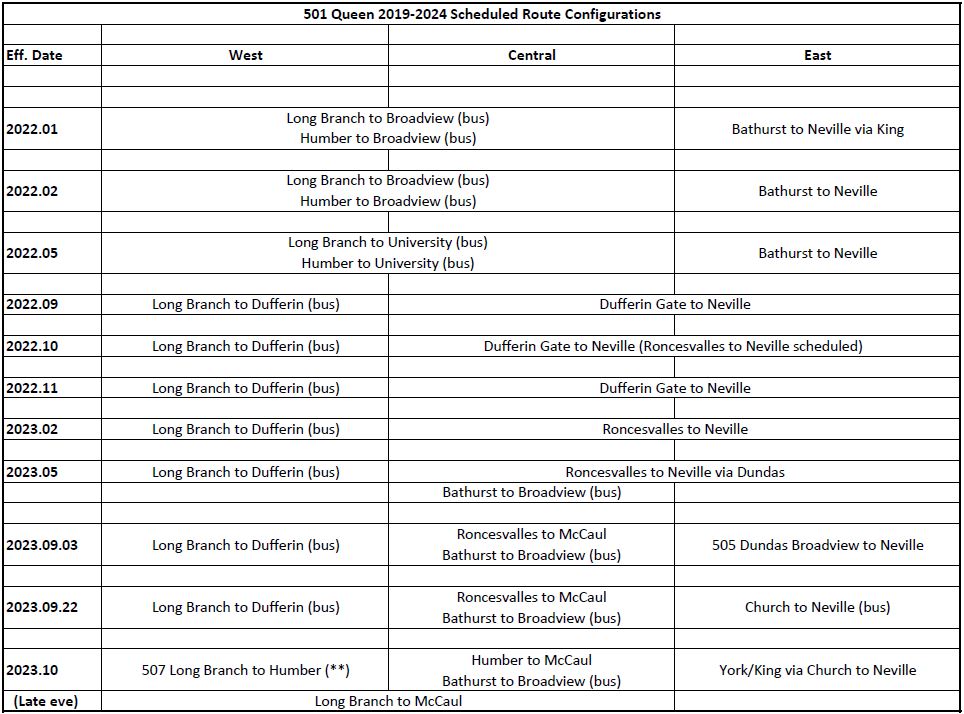
I have also included tables showing the constant change in route configurations on the four major east-west corridors thanks to a never-ending procession of track and water main work, rapid transit construction, and overhead changes for pantograph operation. Some of this work was accelerated to take advantage of lighter traffic conditions during the pandemic, and some to bring forward work to keep staff employed.
However, the rate of route changes persisted well beyond the heart of the pandemic and threatens the credibility of transit service on major corridors leaving riders constantly wondering where their streetcar or replacement bus might be. Some changes occurred without the planned work actually taking place, or work started and ended later than announced (sometimes much later as in the never-ending KQQR project).
An important change over recent years, separate from the pandemic, has been the move to larger streetcars on wider headways. What might have been a tolerable unevenness in service when streetcars arrived every 4 or 5 minutes simply does not work for scheduled headways of 10 minutes with much wider swings. Bunching when it occurs leaves much bigger gaps between vehicles. A laissez faire attitude to route management, and especially the assumption that routes under construction cannot be managed, has led both to unreliable service and basic questions of how or if the TTC can recover the quality riders expect.
For all the talk of project co-ordination, the last people who seem to count are the riders. Simply studying raw travel times be they scheduled or actual does not capture the frustration, delay and despair from the ever-changing and unreliable services, be they by streetcar or bus.
Scheduled Travel Speeds
As a starting point for my streetcar review, this section looks at scheduled travel speeds on each route. Some are unchanged from five years ago, while others are slower. Another vital factor is service reliability and the typical wait time riders face attempting to use the service. For shorter trips, wait time is at least as important as travel time, and yet the TTC does not even report on service reliability except at terminals with a dubious “on time” performance metric.
For most routes, the comparisons here are between January 2019 and January 2024 with data coming from the TTC’s Scheduled Service Summaries. Since 2019, some routes have changed their mode and/or their actual route due to construction diversions and bus replacements. In these cases, I have chosen comparisons between nearby dates where streetcars were operating on their normal routes as much as possible.
In some cases, the vehicles in the “before” data are Low Floor Streetcars, but some routes were still scheduled for the CLRVs which were sprightlier than the new cars. Another important change is that TTC operating practices now include more restrictions on streetcar operation at intersections in the name of safety, although this begs the question of track condition and maintainence.
All speeds are in kilometres per hour.
501 Queen
Service on Queen will be affected for several years by Ontario Line construction. The route currently operates in three overlapping segments:
- Humber to McCaul (streetcar)
- Bathurst to Broadview (bus)
- Neville to York & King via Church and Wellington (streetcar)
For the comparison here, I have used March 2023 just before the route was broken up for the Ontario Line construction at Yonge, but when the route only operated to Sunnyside Loop thanks to construction on The Queensway.
The 2023 scheduled speed is lower, notably on weekdays, than 2019.
| 501 Queen | AM Peak | M-F Midday | PM Peak | Sat PM | Sun PM |
|---|---|---|---|---|---|
| January 2019 Humber-Neville CLRV | 14.2 | 12.8 | 12.3 | 11.8 | 12.3 |
| March 2023 Sunnyside-Neville LFSC | 11.9 | 10.7 | 10.3 | 11.2 | 11.5 |
| Ratio | 84% | 84% | 84% | 95% | 93% |
Comparing actual travel times over the route is challenging because there were so many changes in route structure and mode from 2019 to 2024. This led to much confusion among riders, irregular service and extra transfers between vehicles all of which contribute to longer travel times. It is not just the in-vehicle time that passengers experience, and both waits and transfers are perceived as taking longer than in-vehicle time. Both the real and perceived travel times are worse through all of these changes.
I will explore comparative travel times later in this article.
503 Kingston Road
There is no direct comparison between the pre-2020 era and 2024 because in 2019 the 502 Downtowner and 503 Kingston Road were still separate routes operating with buses due to a streetcar shortage. The 502 has no current equivalent (Bingham to McCaul Loop via Queen), and the 503 only operated during peak periods in 2019.
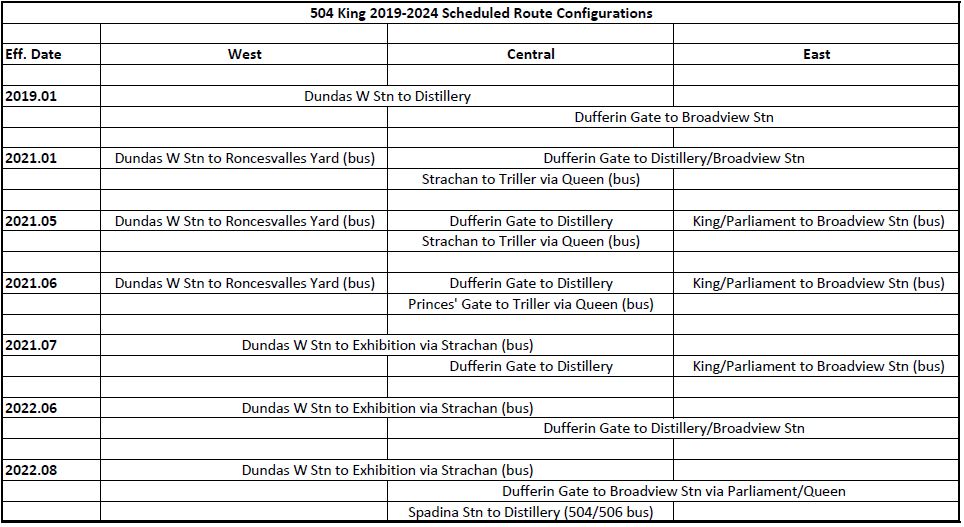
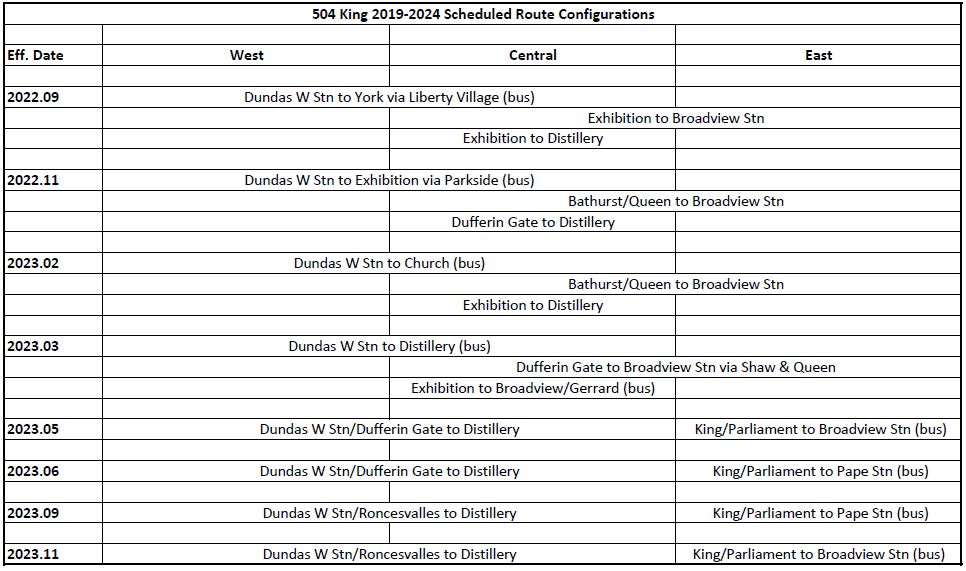
504 King
The 504 King car normally operates with two branches:
- 504A Dundas West Station to Distillery Loop
- 504B Dufferin Loop to Broadview Station
The 504B is current turning back at Distillery Loop due to construction on Broadview.
For comparison, I have used only the Dundas West to Distillery branch as that is common to 2019 and 2024.
| 504A King to Distillery | AM Peak | M-F Midday | PM Peak | Sat PM | Sun PM |
|---|---|---|---|---|---|
| January 2019 (LFSC) | 11.5 | 11.9 | 11.2 | 11.7 | 12.3 |
| January 2024 (LFSC) | 10.3 | 10.3 | 9.5 | 9.9 | 10.2 |
| Ratio | 90% | 87% | 85% | 85% | 83% |
Like 501 Queen, 504 King has been through many route changes thanks to the KQQR project, Broadview reconstruction (in two phases rather than one), and trackwork at King and Shaw, among other disruptions. Listed here are only the scheduled route changes, not the ad hoc diversions to deal with short-term issues.
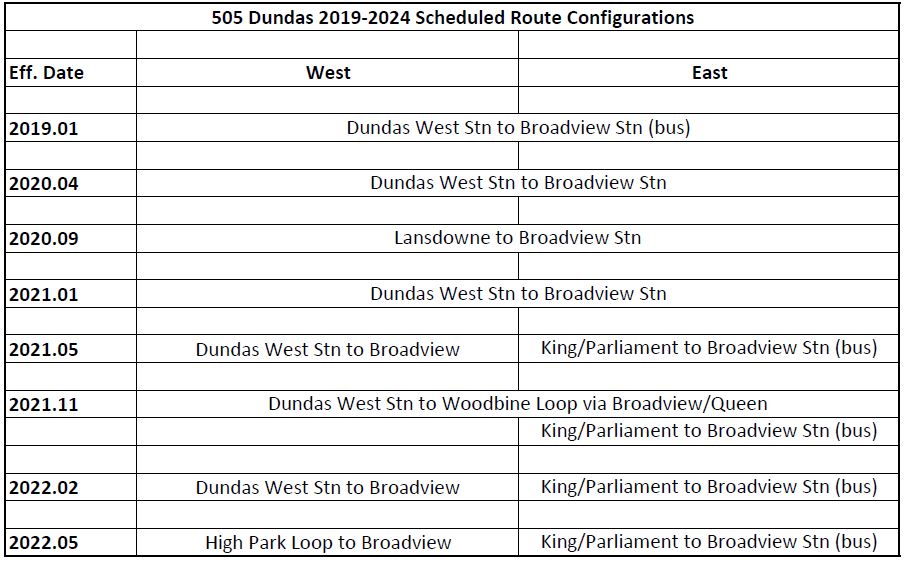
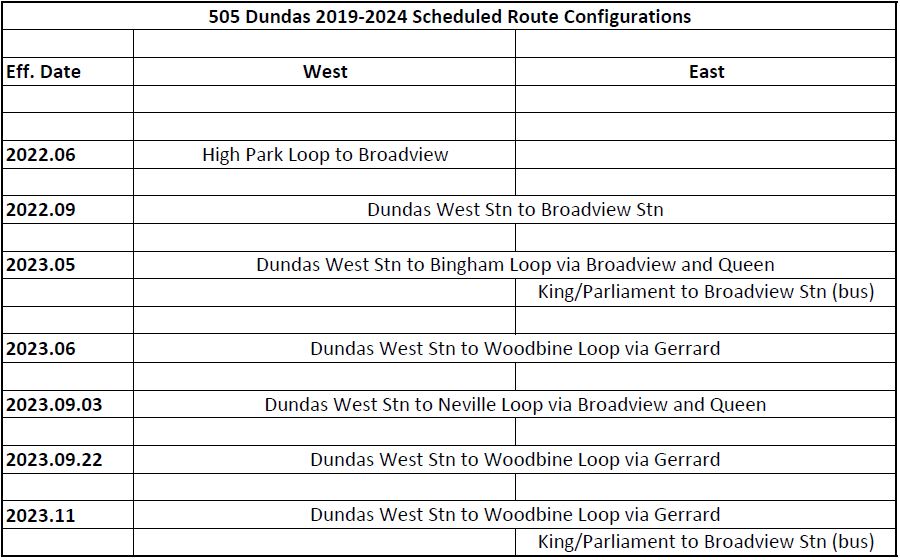
505 Dundas
The 505 Dundas car normally operates between Dundas West and Broadview Stations, although it currently extends east via Gerrard, Coxwell and Queen to Woodbine Loop during construction on Broadview.
Finding comparative configurations runs into problems that the route operated with buses due to a streetcar shortage, and I have used January 2018 for the “before” data. The Broadview construction began in May 2023, and so the “after” data shown here is from the March 2023 schedules.
| 505 Dundas | AM Peak | M-F Midday | PM Peak | Sat PM | Sun PM |
|---|---|---|---|---|---|
| January 2018 (CLRV) | 12.6 | 11.8 | 10.8 | 11.1 | 12.2 |
| March 2023 (LFSC) | 10.9 | 10.3 | 9.4 | 10.2 | 10.4 |
| Ratio | 87% | 87% | 87% | 92% | 85% |
505 Dundas was operated with buses until April 2020 due to a shortage of streetcars. The route has seen changes to its eastern and western termini especially from 2021 onward.
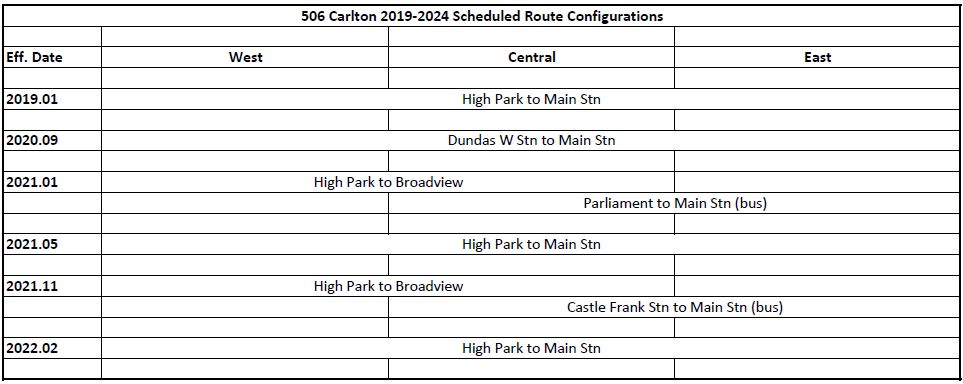
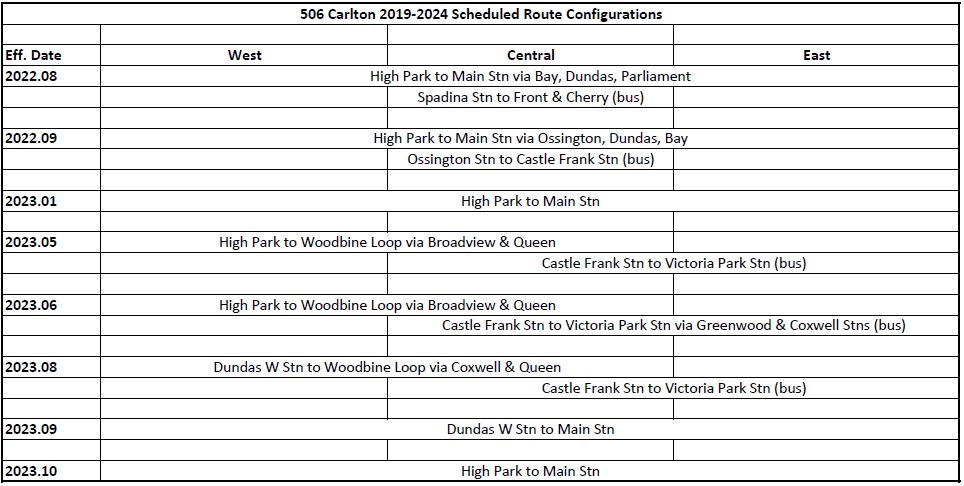
506 Carlton
| 506 Carlton | AM Peak | M-F Midday | PM Peak | Sat PM | Sun PM |
|---|---|---|---|---|---|
| January 2019 (CLRV) | 12.8 | 12.8 | 11.9 | 12.5 | 13.6 |
| January 2024 (LFSC) | 12.1 | 11.2 | 10.0 | 10.4 | 11.5 |
| Ratio | 95% | 88% | 84% | 83% | 85% |
The 506 Carlton car runs from High Park Loop to Main Street Station, and it operated on its normal route in January in both 2019 and 2024. Carlton saw various changes over the years, but not quite as many as the other routes above. Not shown in the chart below is a small number of trippers that operated in the AM peak with buses because of the streetcar shortage. These were discontinued in November 2021.
A few years back the peregrinations of the replacement bus service featured in a satiric service change notice with a route map like a plate of spaghetti. The satire was richly deserved, and showed a rider’s eye view of TTC operations and communications.
507 Long Branch
In 2019, the Long Branch service operated as 501L Queen which was equivalent to the current 507 route between Humber and Long Branch Loops. The scheduled speed is slower today with new streetcars than it was in 2019 with the CLRVs.
| 507 Long Branch | AM Peak | M-F Midday | PM Peak | Sat PM | Sun PM |
|---|---|---|---|---|---|
| January 2019 (CLRV) | 15.7 | 17.4 | 15.7 | 17.4 | 17.4 |
| January 2024 (LFSC) | 13.3 | 14.8 | 13.9 | 15.3 | 15.3 |
| Ratio | 85% | 85% | 89% | 88% | 88% |
509 Harbourfront
The 509 Harbourfront car runs between Union Station and Exhibition Loops and has reserved trackage over its entire length.
| 509 Harbourfront | AM Peak | M-F Midday | PM Peak | Sat PM | Sun PM |
|---|---|---|---|---|---|
| January 2019 (LFSC) | 12.5 | 13.2 | 11.9 | 13.2 | 12.9 |
| January 2024 (LFSC) | 13.2 | 13.2 | 12.6 | 13.2 | 13.2 |
| Ratio | 106% | 100% | 103% | 99% | 98% |
510 Spadina
The 510 Spadina car runs between Spadina Station and Union Station with a scheduled short turn service to Queens Quay Loop. For this comparison I have used only the 510A Union Station service.
When I first ran these numbers, I was surprised to see a drop in speed on this route which operates entirely on reserved track, and which in 2019 already had schedules based on LFSC operation.
| 510 Spadina | AM Peak | M-F Midday | PM Peak | Sat PM | Sun PM |
|---|---|---|---|---|---|
| January 2019 (LFSC) | 11.6 | 11.6 | 10.3 | 11.0 | 11.2 |
| January 2024 (LFSC) | 10.0 | 10.2 | 9.3 | 9.6 | 9.7 |
| Ratio | 86% | 88% | 90% | 87% | 87% |
It turns out that the 2019 Scheduled Service Summary shows the route as 12.33km round trip while the 2024 version shows it as 10.86km. This change occurred in the January 2020 Summary, and it alters the scheduled speed calculation in 2019 because the route was shown as longer than it really was.
With this correction, the scheduled speeds are essentially the same in 2019 and 2024.
| 510 Spadina (Corrected) | AM Peak | M-F Midday | PM Peak | Sat PM | Sun PM |
|---|---|---|---|---|---|
| January 2019 (LFSC) | 10.2 | 10.2 | 9.1 | 9.7 | 9.9 |
| January 2024 (LFSC) | 10.0 | 10.2 | 9.3 | 9.6 | 9.7 |
| Ratio | 98% | 100% | 103% | 99% | 98% |
511 Bathurst
The 511 Bathurst car operates between Bathurst Station and Exhibition Loop. For many years it suffered from a combination of construction projects and the streetcar shortages. The streetcars returned in mid-2019 and I have used this for comparison.
| 511 Bathurst | AM Peak | M-F Midday | PM Peak | Sat PM | Sun PM |
|---|---|---|---|---|---|
| July 2019 (CLRV) | 9.7 | 10.5 | 9.4 | 10.5 | 11.3 |
| January 2024 (LFSC) | 9.5 | 9.8 | 8.8 | 9.4 | 10.8 |
| Ratio | 98% | 93% | 94% | 90% | 96% |
512 St. Clair
The 512 St. Clair car normally operates between St. Clair Station and Gunn’s Loop west of Keele Street. It is currently operating with buses due to various construction projects, but normally has a reserved transit lane over almost the entire route.
The comparative schedule data here are from January 2023 when the line operated over its full length with streetcars.
| 512 St. Clair | AM Peak | M-F Midday | PM Peak | Sat PM | Sun PM |
|---|---|---|---|---|---|
| January 2019 (LFSC) | 12.9 | 12.7 | 12.3 | 12.9 | 12.7 |
| January 2023 (LFSC) | 12.4 | 12.6 | 12.4 | 12.2 | 12.6 |
| Ratio | 96% | 99% | 101% | 95% | 99% |
Comparative Travel Times 2019-2023
These charts show travel times for the eastern and western parts of 501 Queen, 505 Dundas and 506 Carlton. The division shows the different character of travel time patterns east and west of Yonge Street, and avoids having long periods when there are no end-to-end streetcar trips due to diversions and bus replacements.
Even these numbers do not get down into fine-grained analysis such as determining where travel times are longer (or not) over short sections of a route. In other words, the area that would benefit from priority could be only a key portion of a route where conditions are difficult. Unfortunately, these are also the locations where taking road space or signal green time for transit can be the most challenging.
The charts in this section are in formats familiar to regular readers, and I have preserved them for continuity.
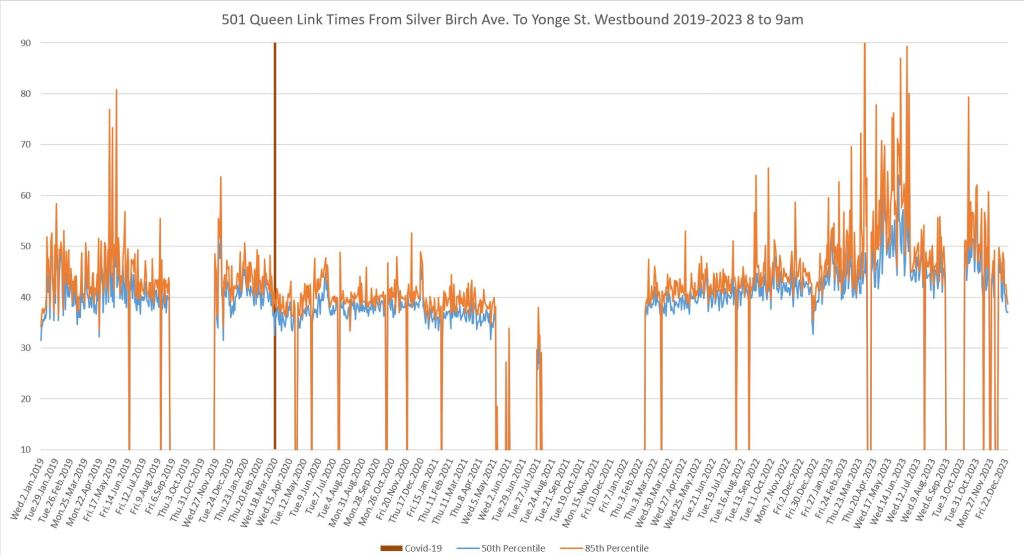
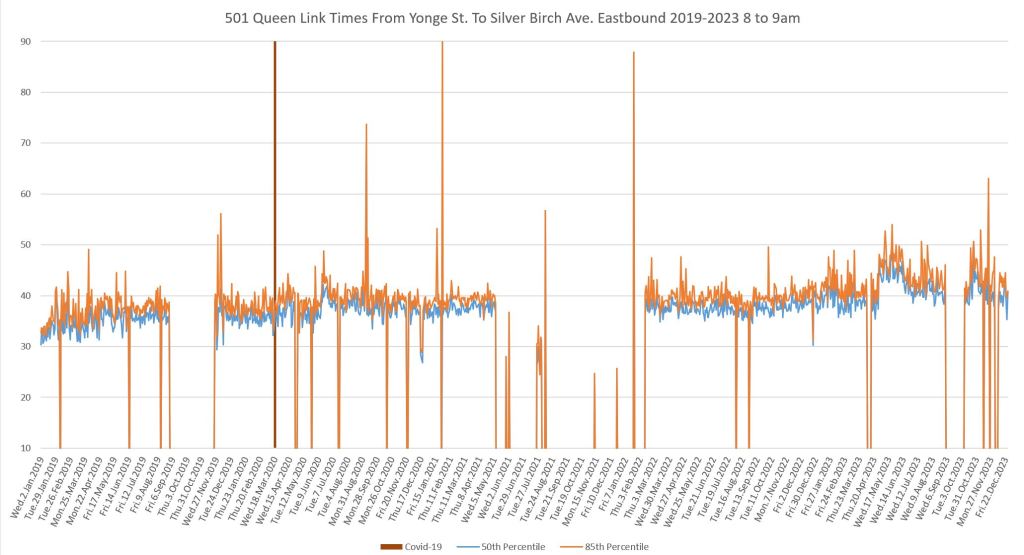
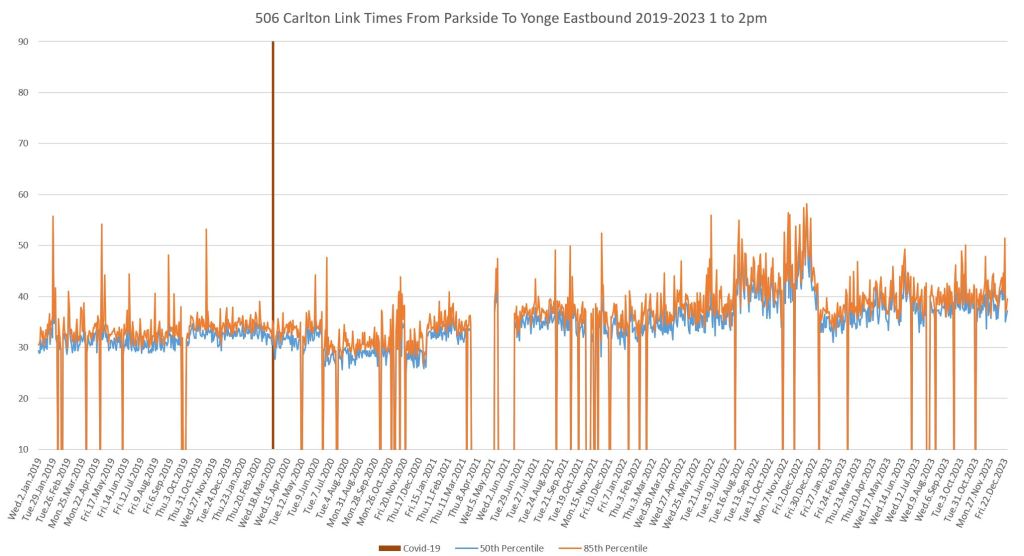
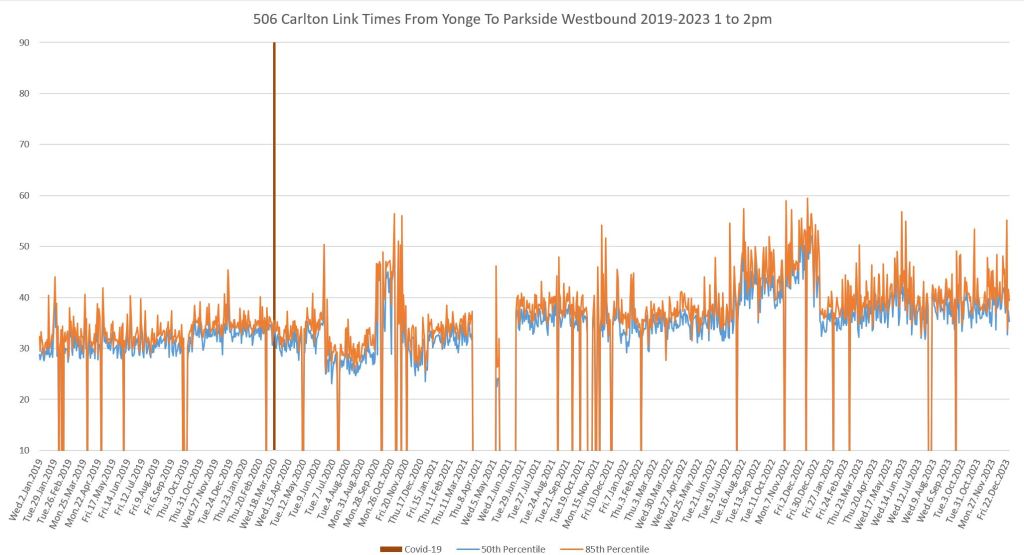
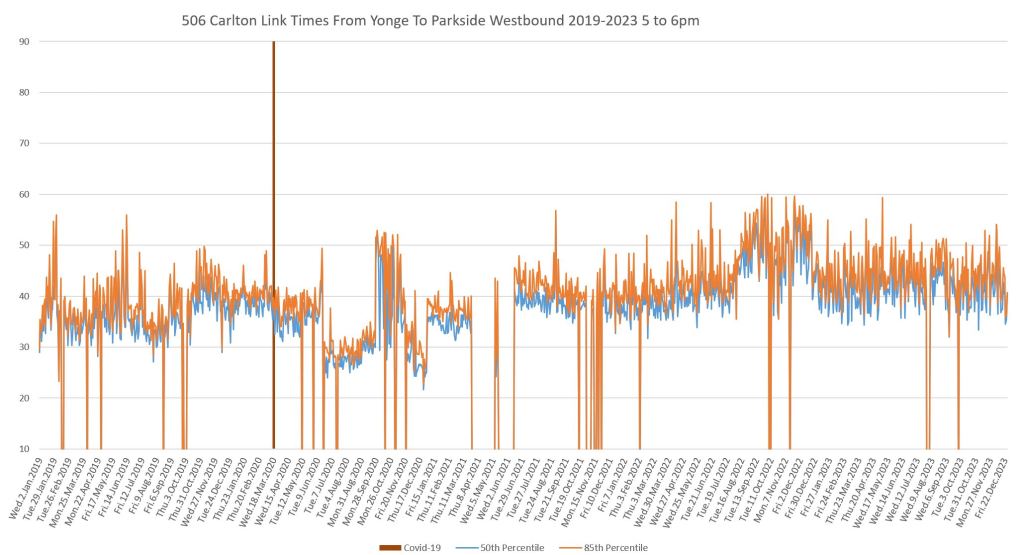
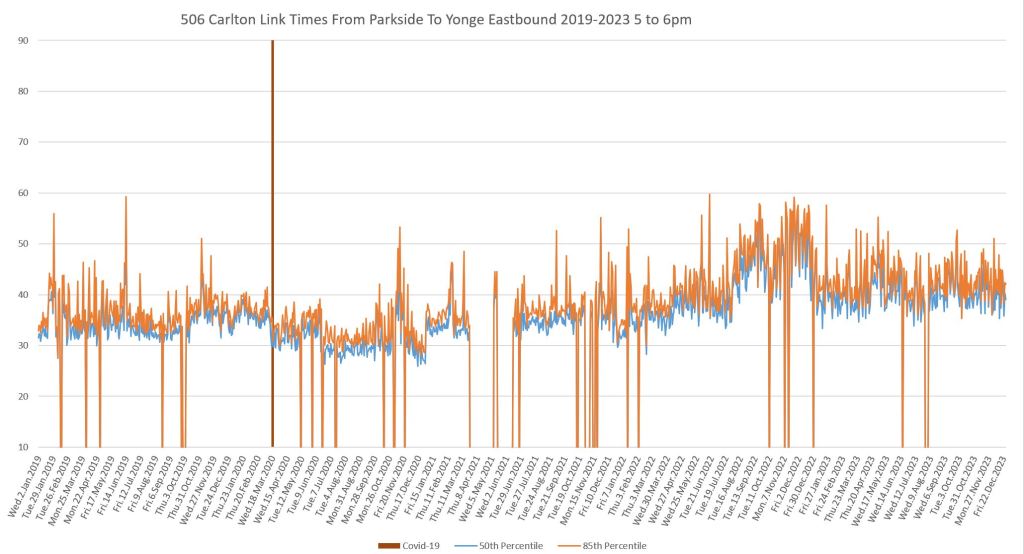
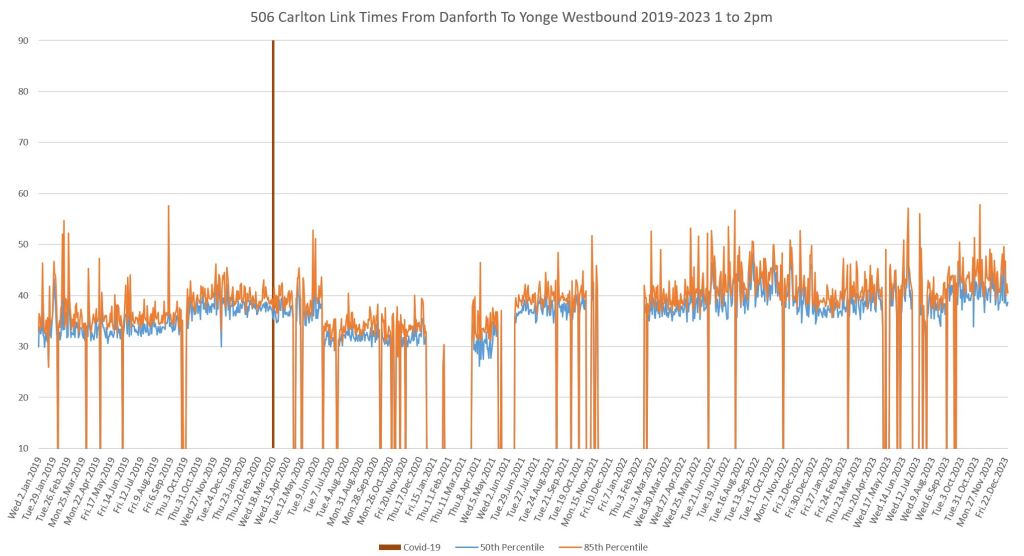
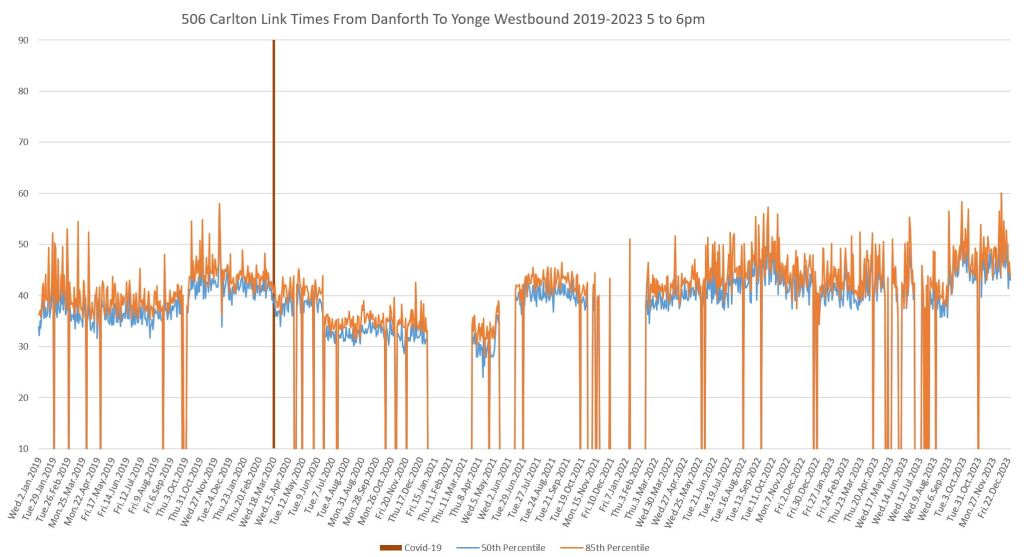
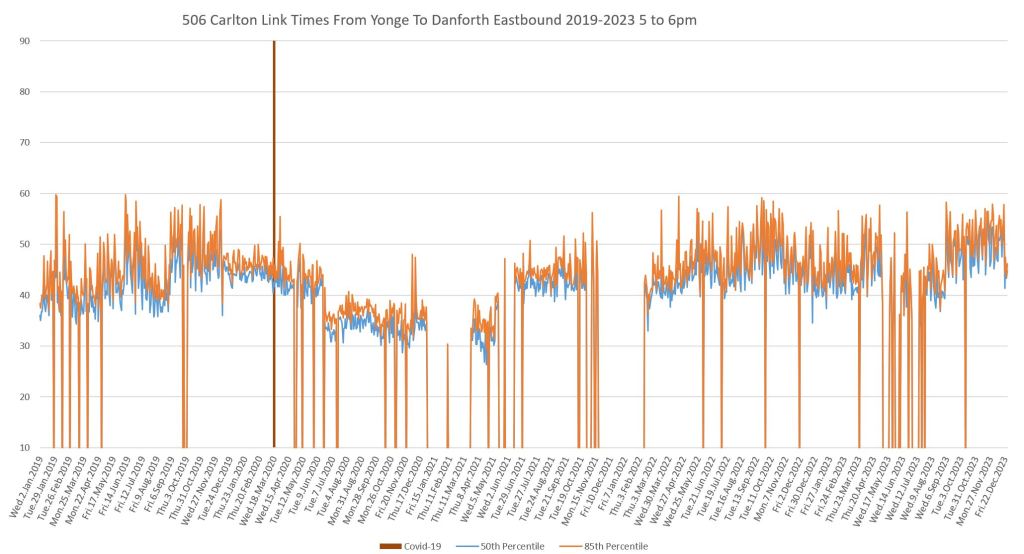
- Charts showing the data for 2019-2023 track the median and 85th percentile of travel times for weekdays. The distance between the two lines gives an indication of the spread in typical travel times. Depending on the route configuration in effect, as well as events such as major delays and diversions, some days have no data for the day and hour in question.
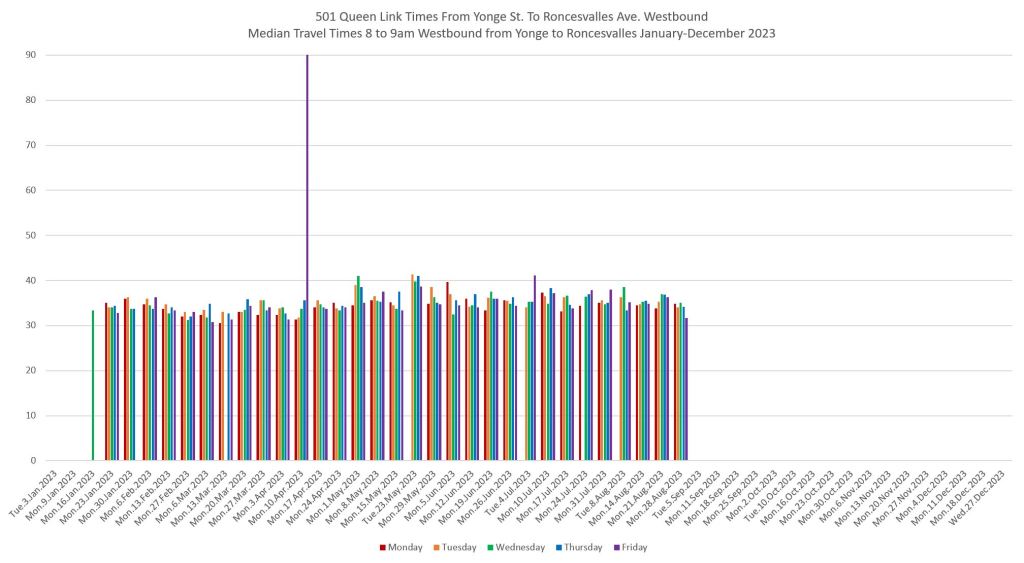
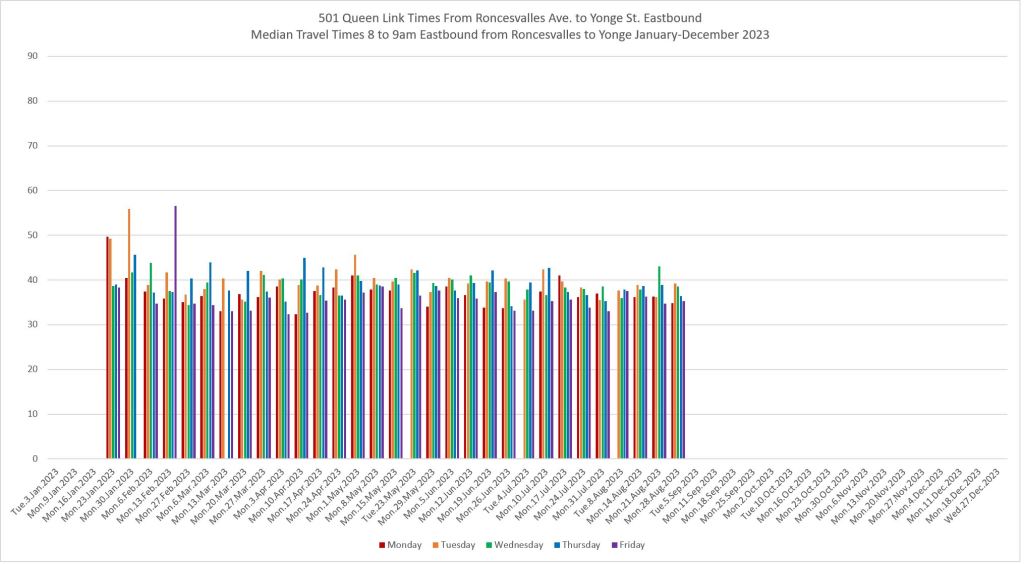
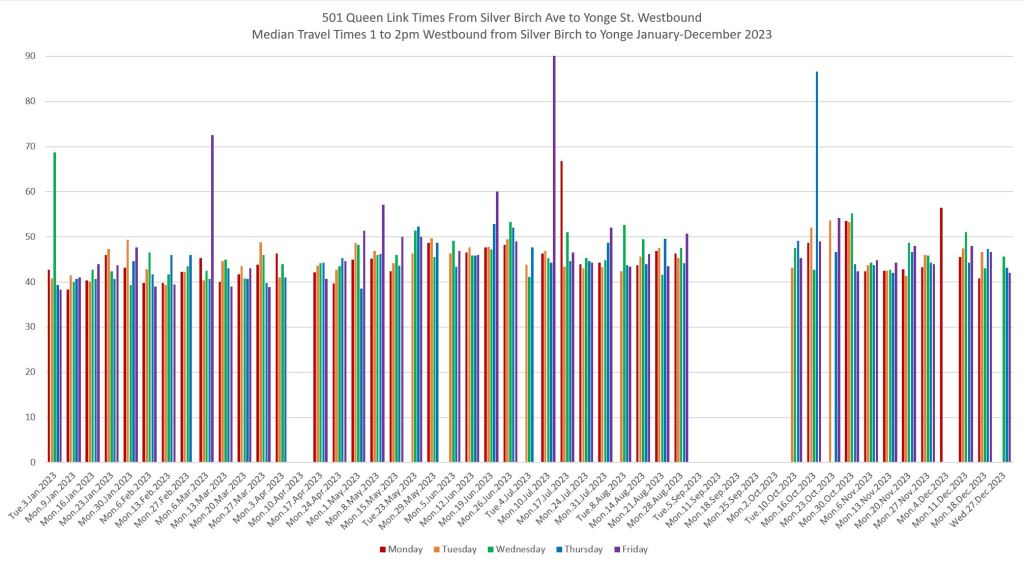
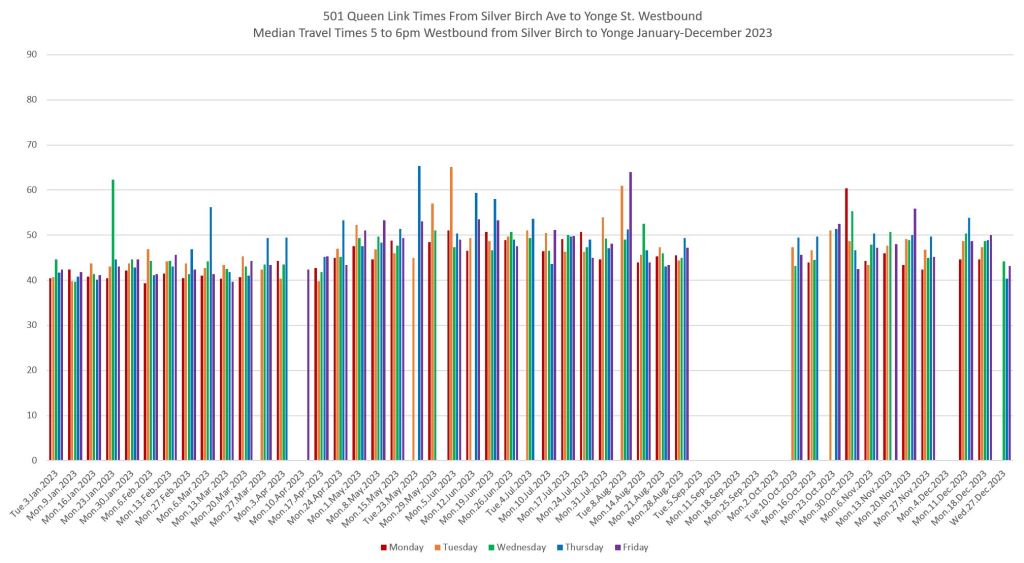
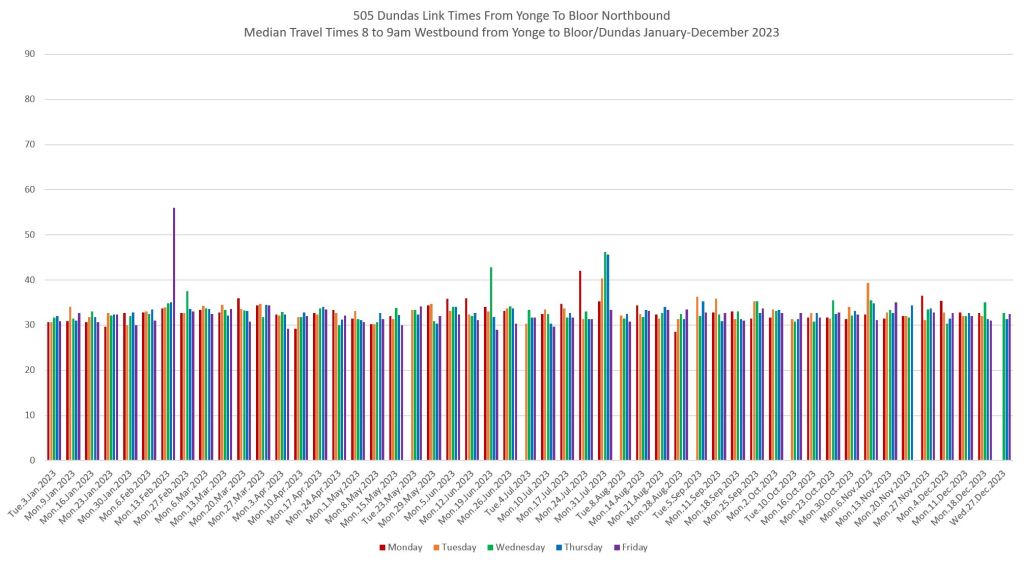
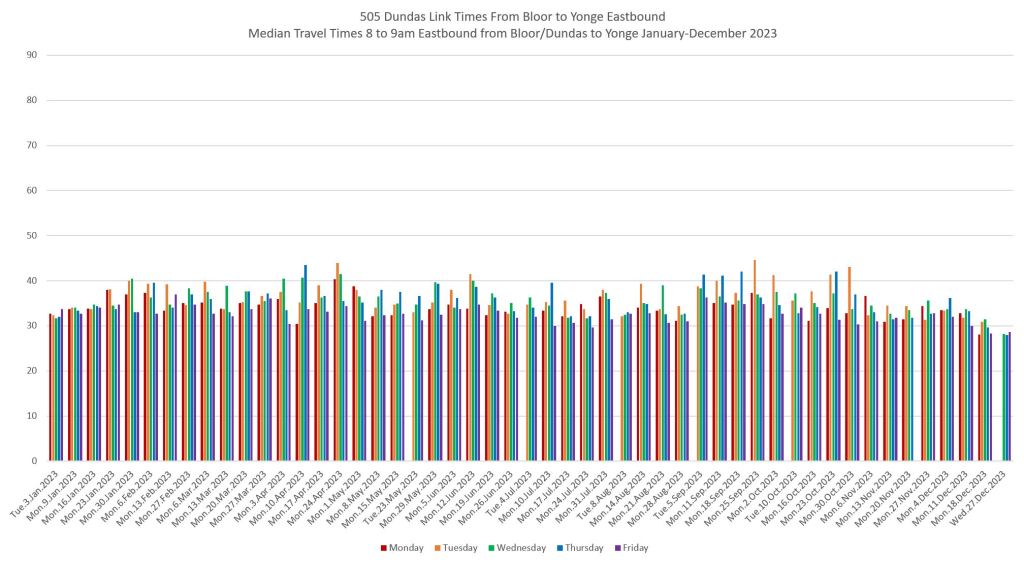
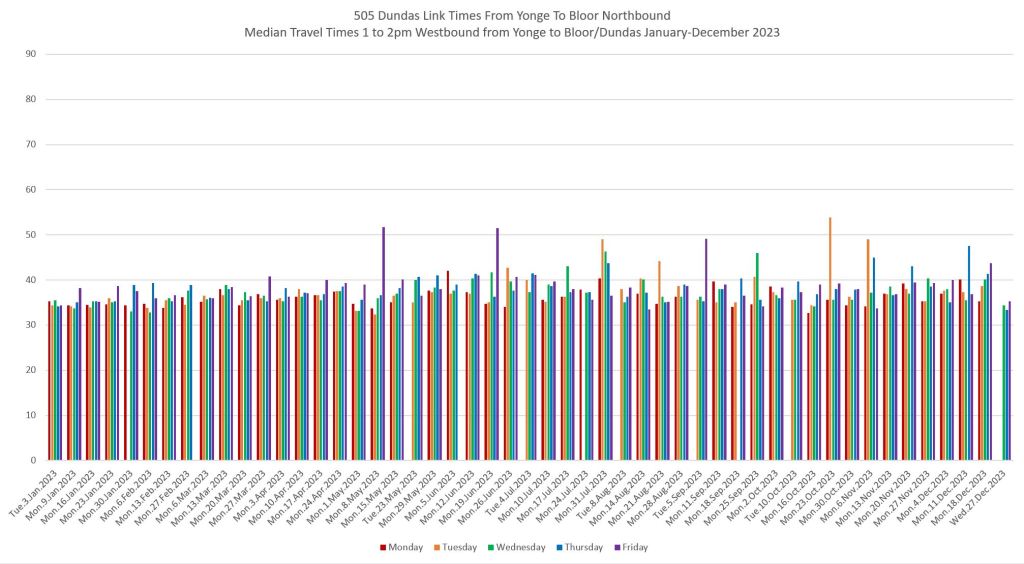
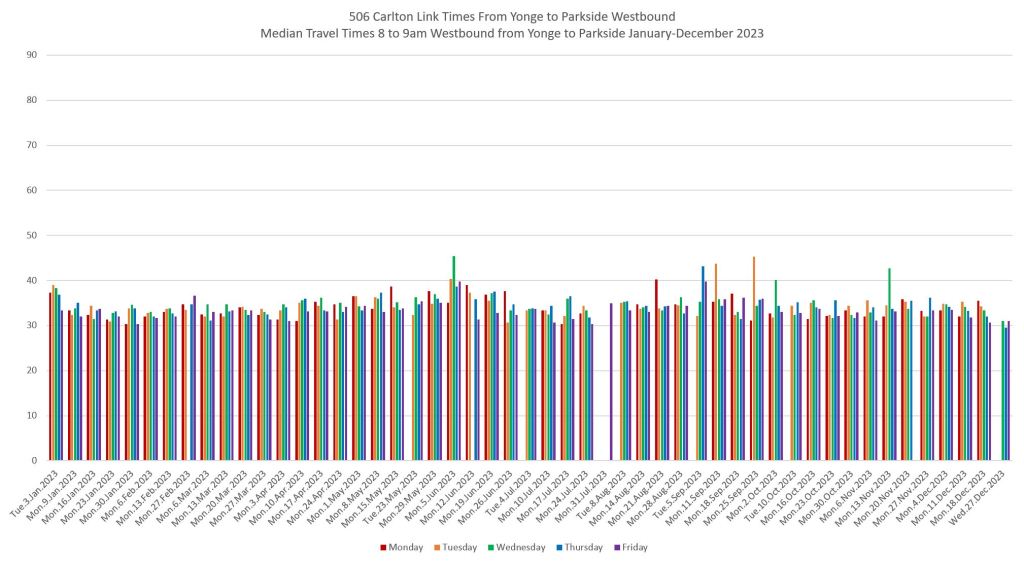
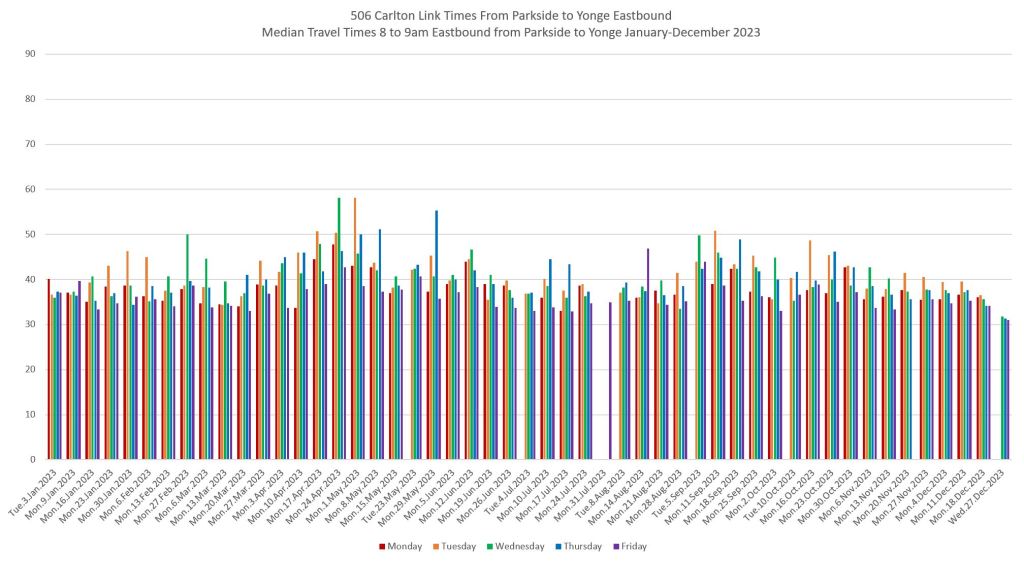
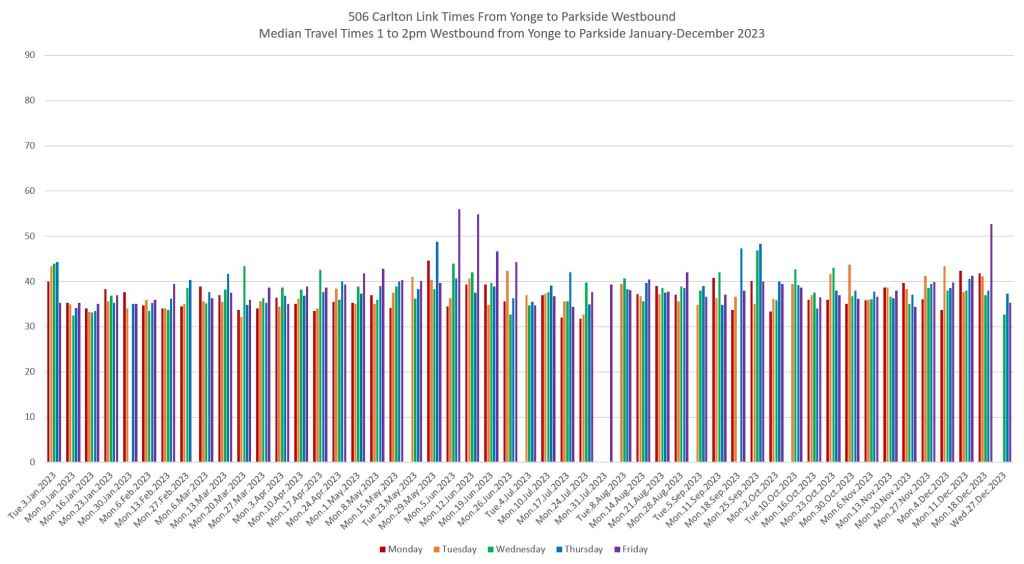
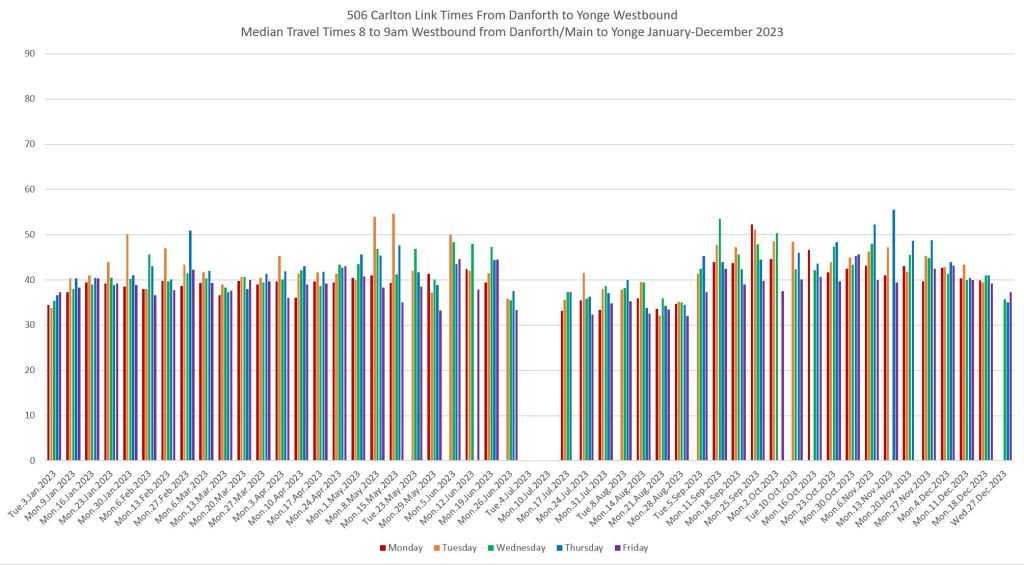
- Charts showing day-by-day detail for 2023 track the median values with colour coding by day of week to show regular cycles, if any, depending on traffic conditions, and more generally the degree of variability in the values which affects day-to-day service.
In each case, 2019-2023 data are shown for three one-hour periods beginning at 8am, 1pm and 5pm as samples of route behaviour through the day. The changes in travel times co-incident with the March 2020 pandemic lockdown are quite evident in many charts, and the event is marked by a vertical line.
Of particular note in these charts is the degree to which the values are change little, or bounce around from one day to the next reflecting different characters of day-to-day service.
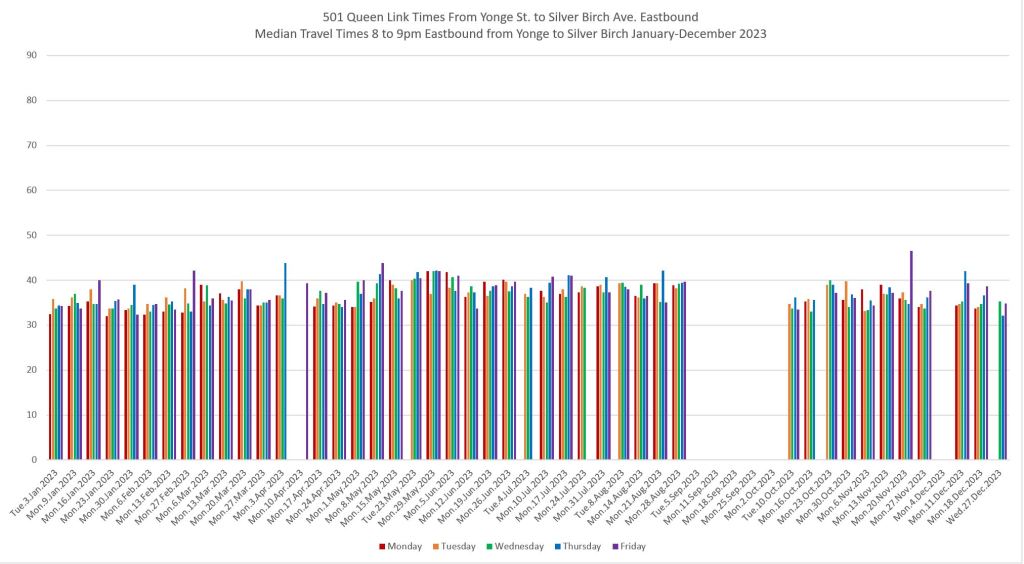
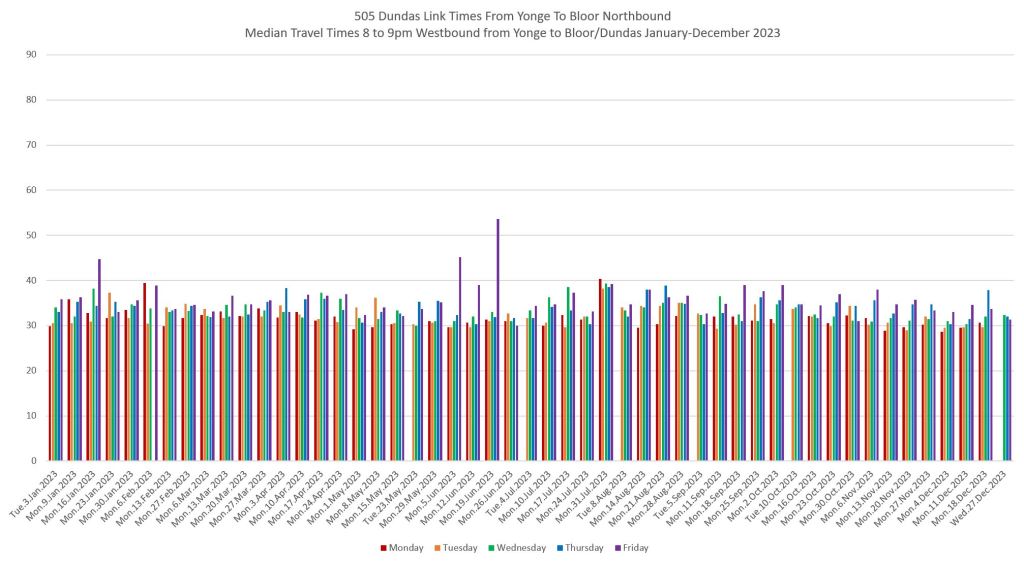
The daily breakdowns for 2023 also include data for mid-evening showing the effect of areas such as Dundas Square which are more congested late in the week as entertainment centres. This pattern was already shown for 504 King in the article King Street Travel Times: May-December 2023.
Note that the screenlines used are near but not at terminals because of problems with vehicle queuing and layovers approaching the ends of lines. If the screenline is too close to the loop, the “travel time” includes layovers waiting for other vehicles to move out of the way. Locations where this can occur include Neville Loop, Dundas West Station and Broadview Station.
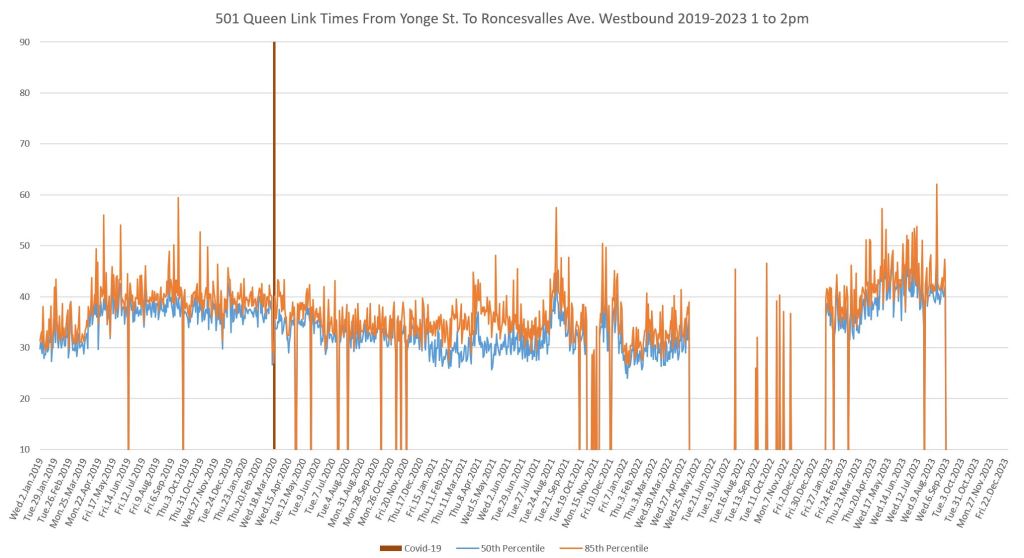
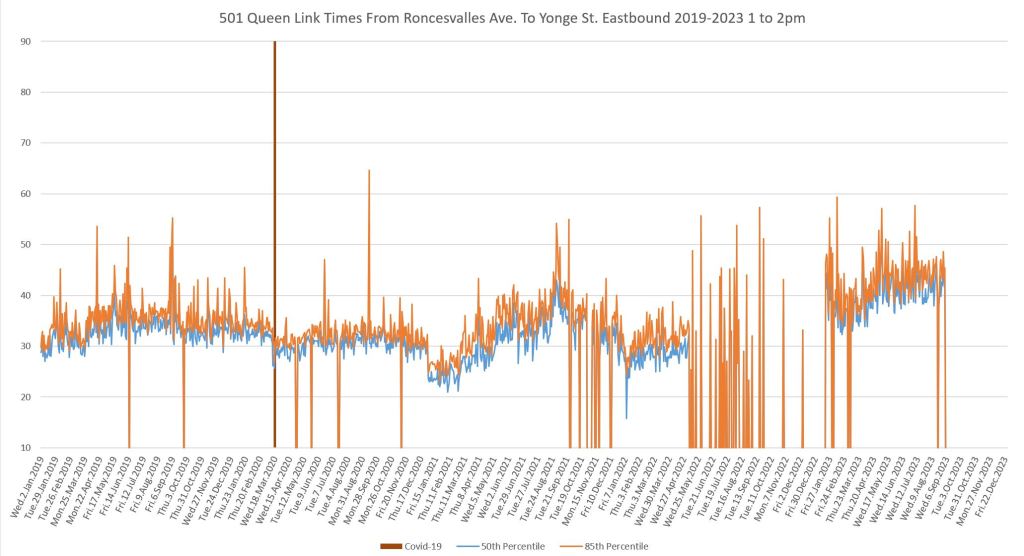
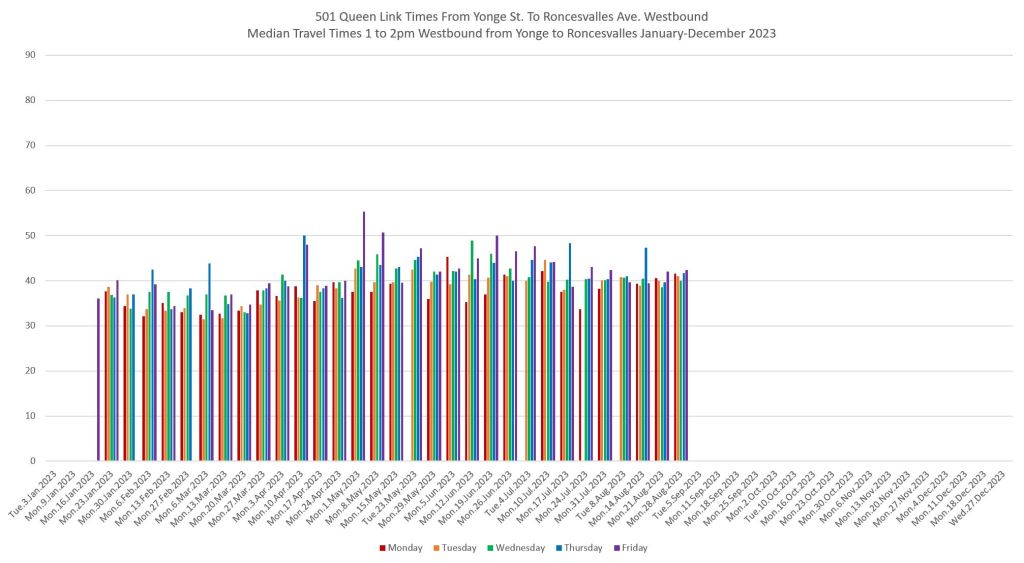
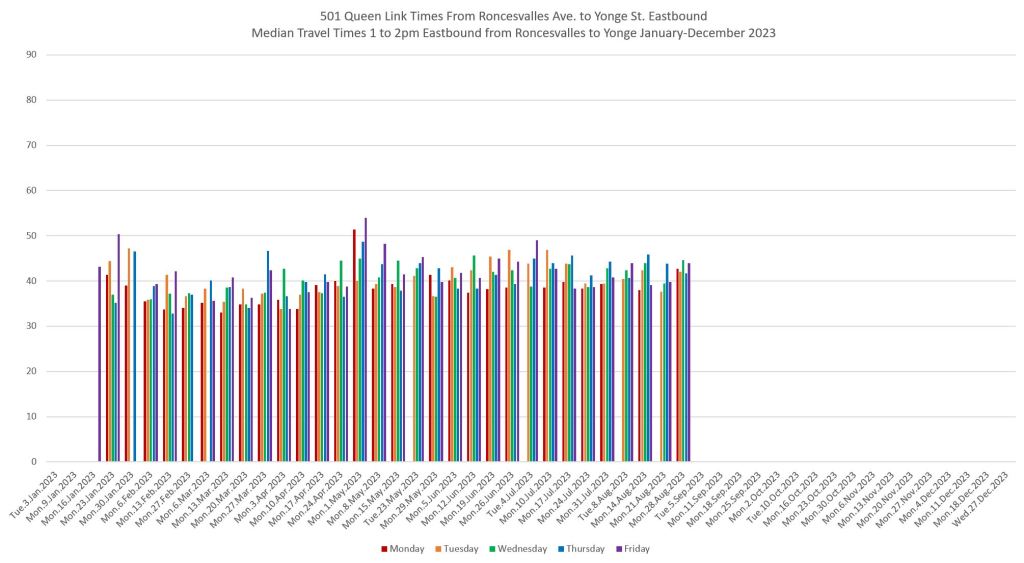
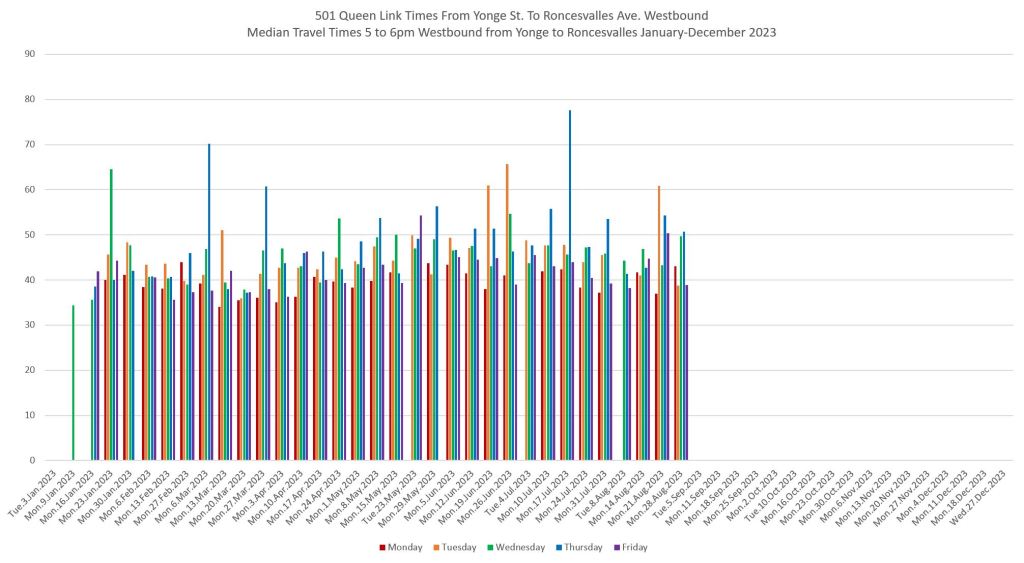
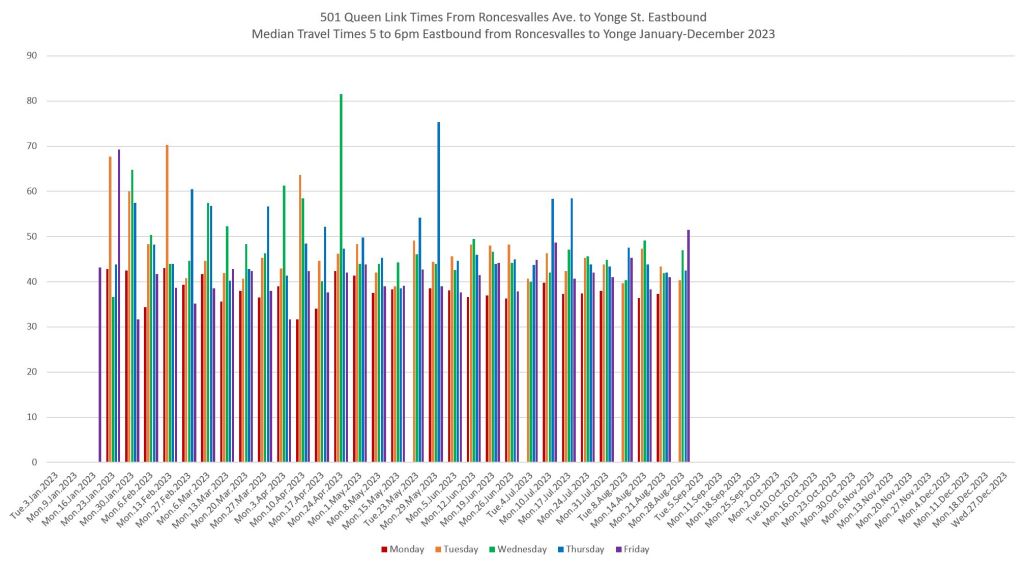
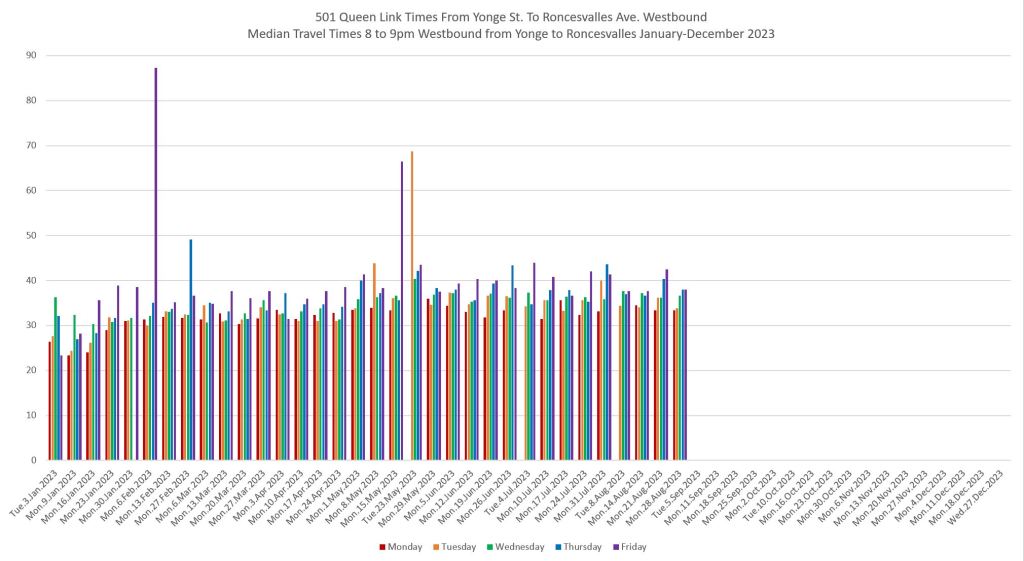
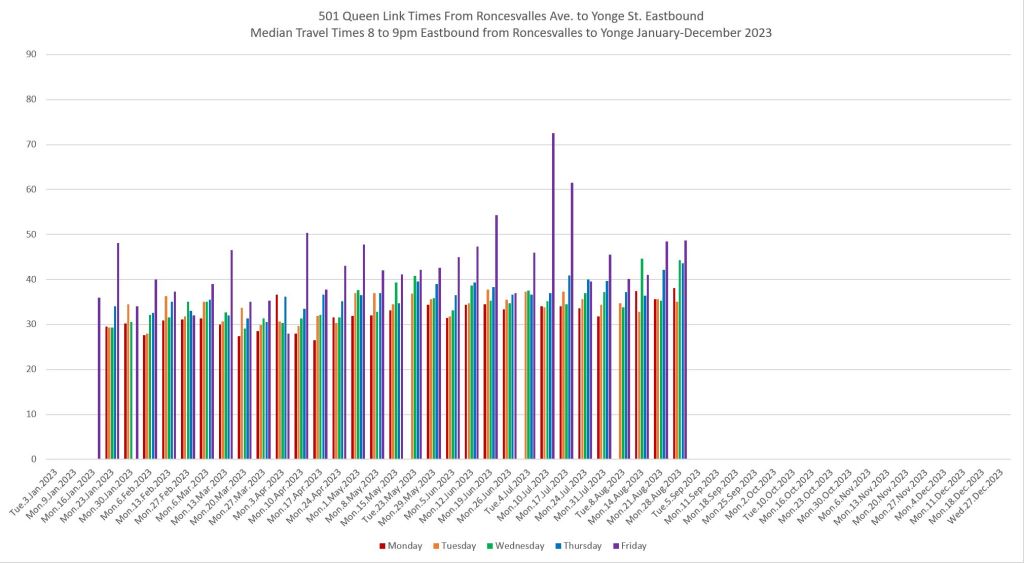
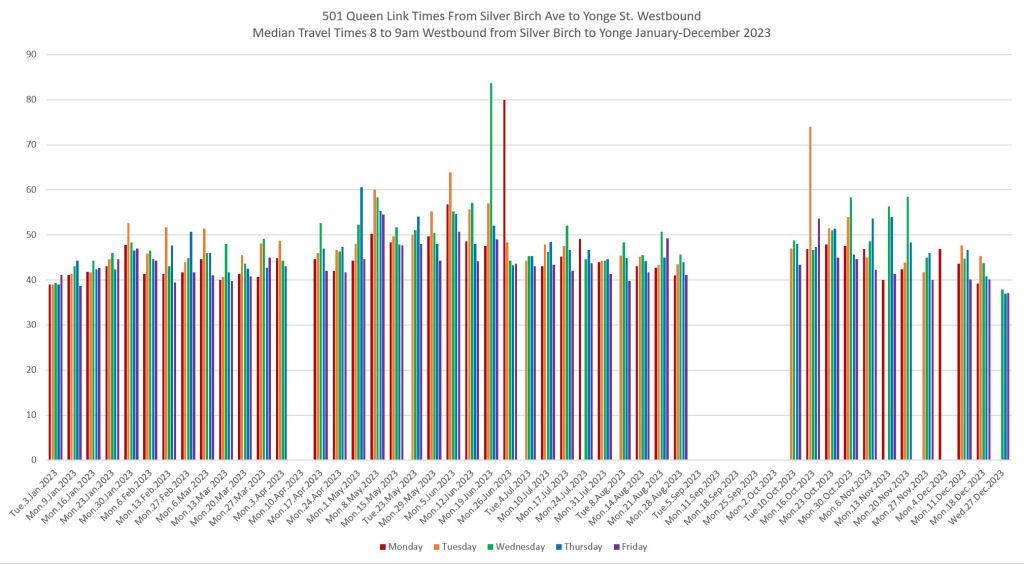
501 Queen Between Roncesvalles and Yonge
In January 2021, the west end of the route converted to bus operation and this continued until quite recently. After April 2022, the eastern terminus of the bus was cut back to University, and so there are no Roncesvalles-Yonge trips to plot until early 2023 when streetcar service resumed to Roncesvalles. In May, the route remained in one piece but was diverted via Dundas around the Ontario Line construction. Times shown from May to August reflect that diversion. Finally, in September 2023, the route was broken with the western segment ending at McCaul.
This shows the importance when looking for improvements of making sure of apples-to-apples comparisons. These will differ from route to route, and even on segments of the same route.
There were periods when, in theory, there was no through service between Roncesvalles and Yonge (May 2022 to January 2023), but data points show up from buses making unscheduled trips beyond their scheduled terminus at Dufferin or University.
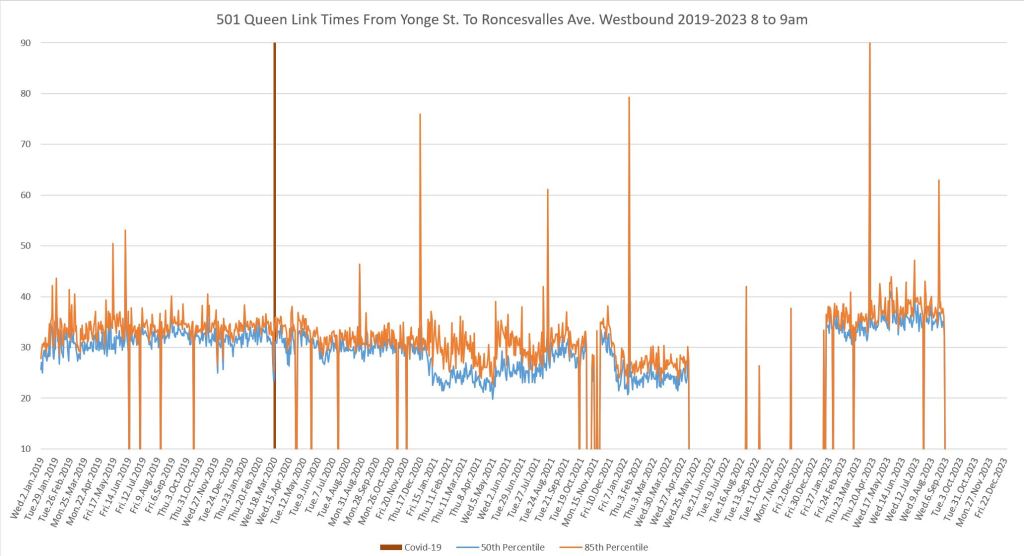
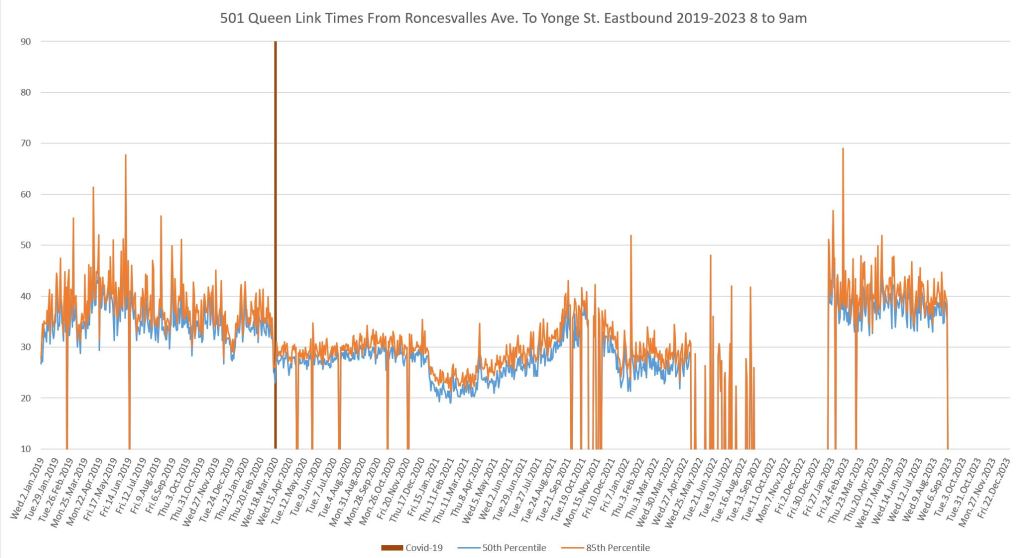
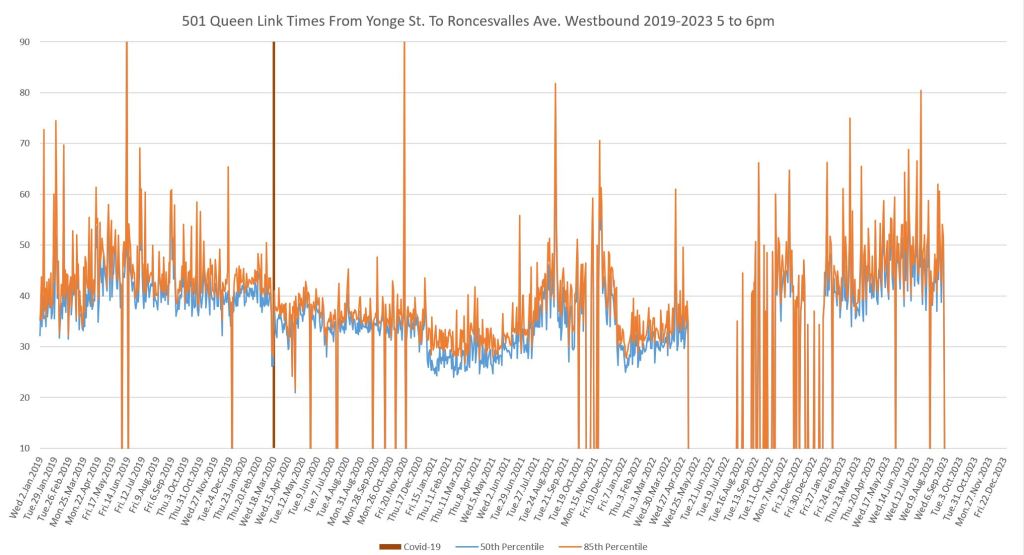
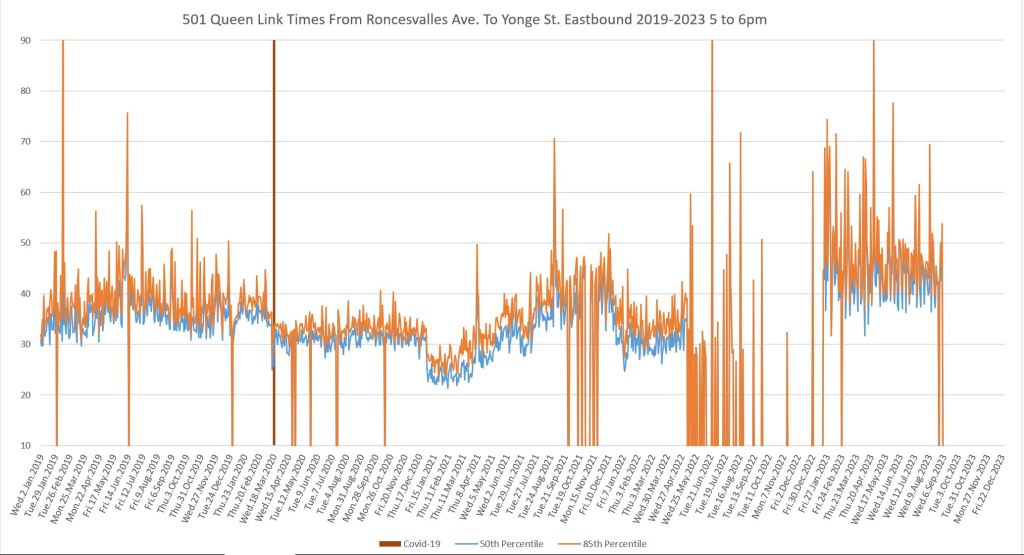
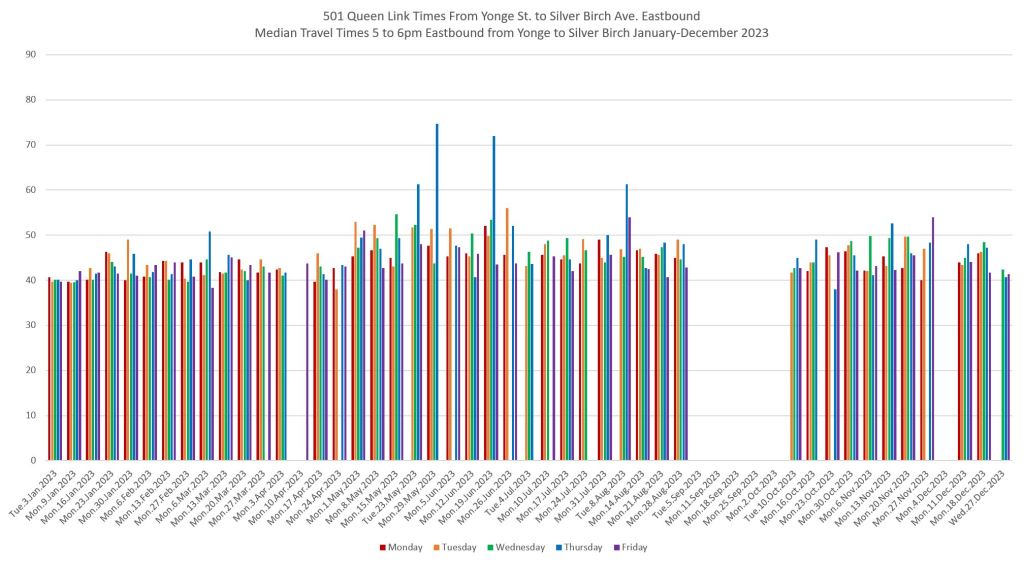
The day-by-day plots for 2023 end with the breaking of the route into three segments in September. During some periods, there are clear patterns of longer travel times on specific days of the week reflecting both the 3-day work week. Travel times eastbound are highest in the PM peak at midweek, but highest on Fridays in the evenings.
That variation is important for scheduling. A timetable that “works” on some days might not be appropriate for all. Statistics reported on a weekly or monthly average will bury problems on the busy days with longer trip times.
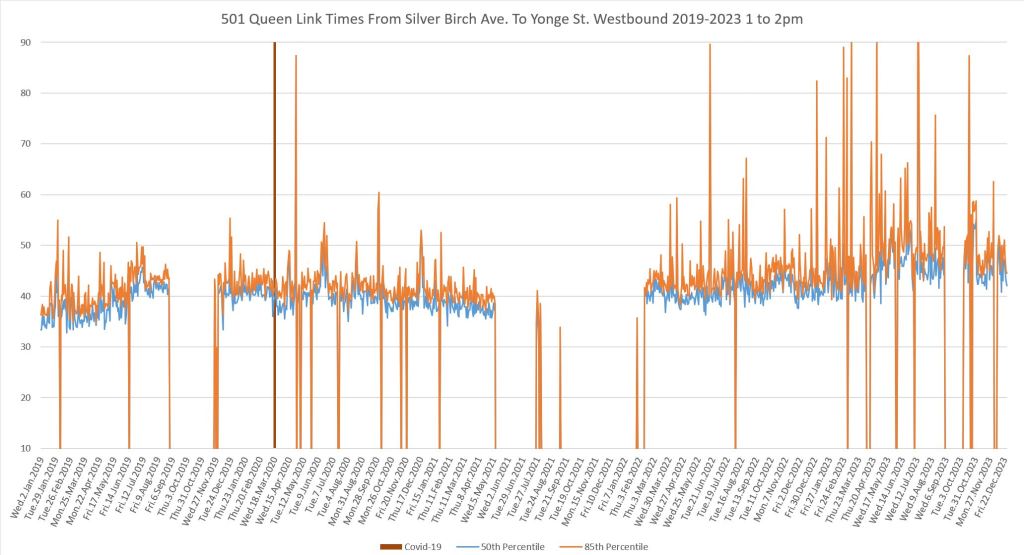
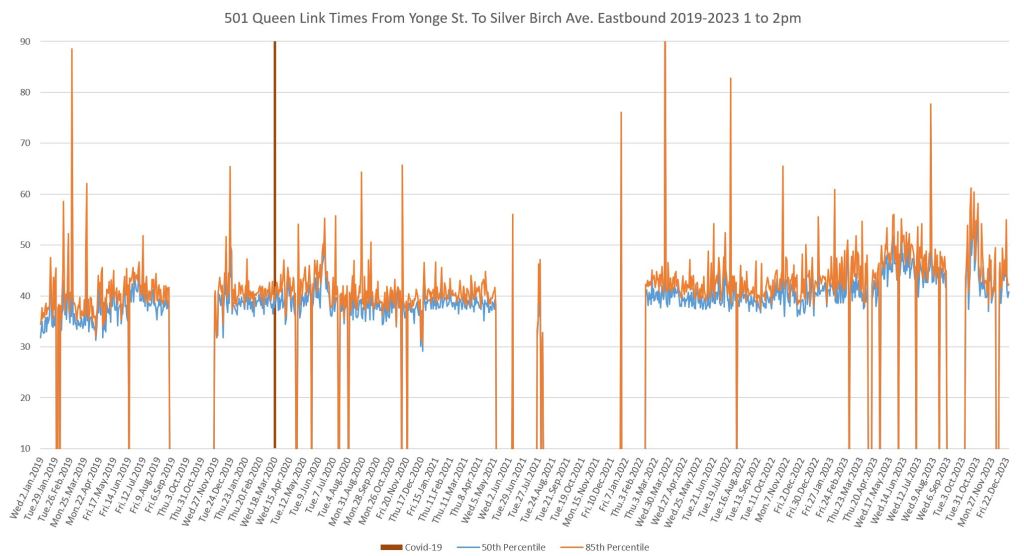
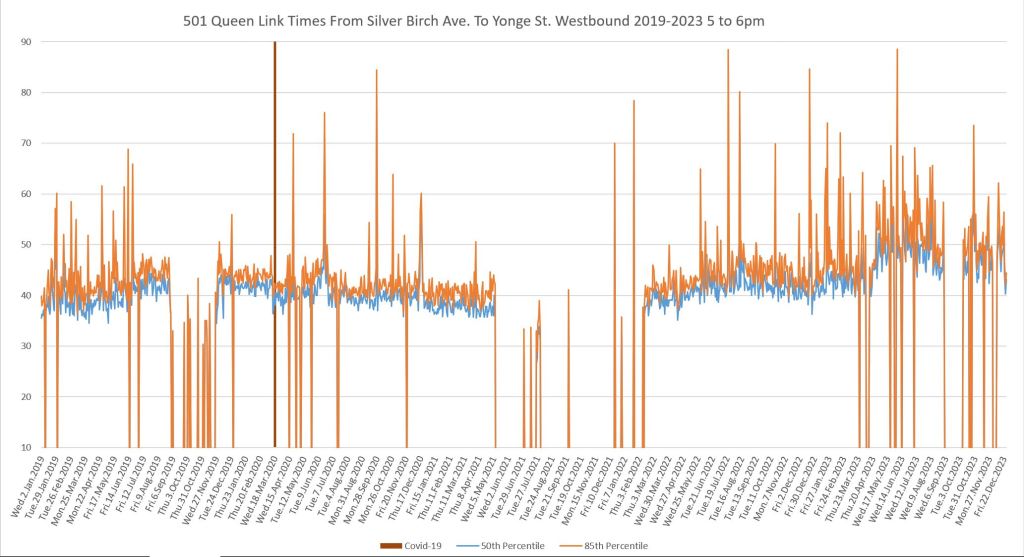
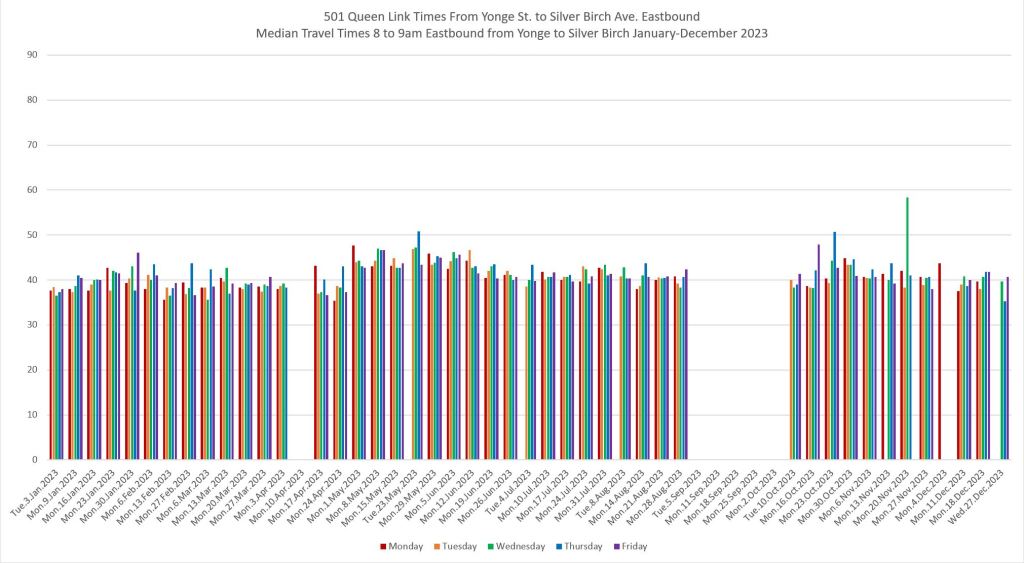
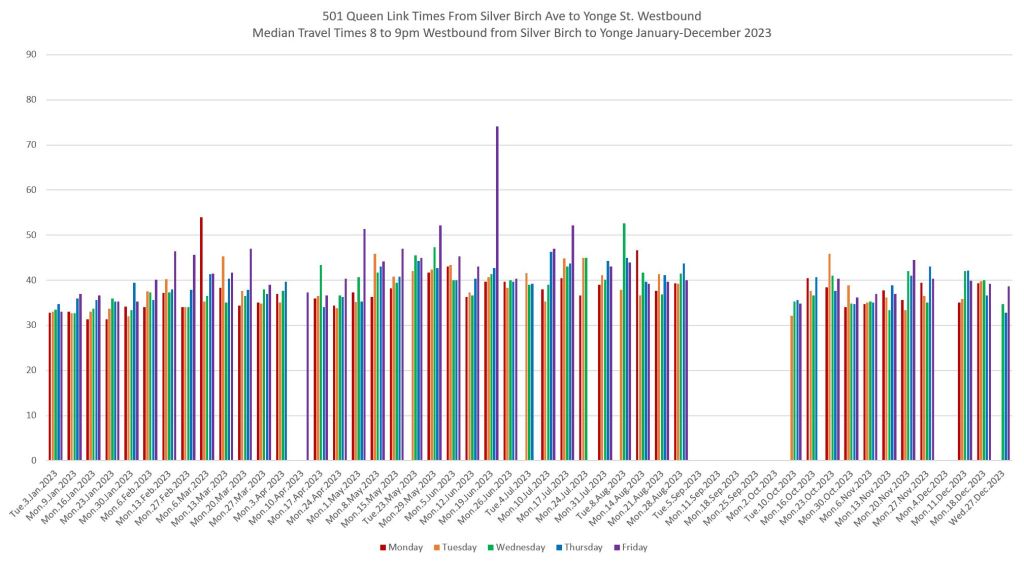
501 Queen Between Neville and Yonge
Note: The screenline at the eastern terminus is set at Silver Birch Avenue, west of Neville Park to avoid the effect of queues of vehicles laying over west of the loop.
Travel times on the east side of Queen are more consistent than to the west, although westbound times were particularly bad in early 2023. The eastern portion of 501 Queen is considerably less congested than the western half, although there are a few specific problem locations.
A major problem with streetcar queuing for left turns at Dundas and Broadview was not helped by the absence of transit priority signals or traffic wardens that were very much an afterthought. This turn was shared with other routes diverting around construction on Queen at the Don Bridge, and the intersection was unable to sustain the volume.
This is a distressingly common problem with TTC diversions where the need for special priority is recognized weeks or months after it was needed, as we saw on King Street in Fall 2023. Again, transit priority changes should have been in place before a known diversion, but only came into effect after problems triggered by its absence were obvious. More generally, transit priority provisions should be in place across the streetcar network so that diversions, when they occur, are not hampered by signals that work against non-standard routes.
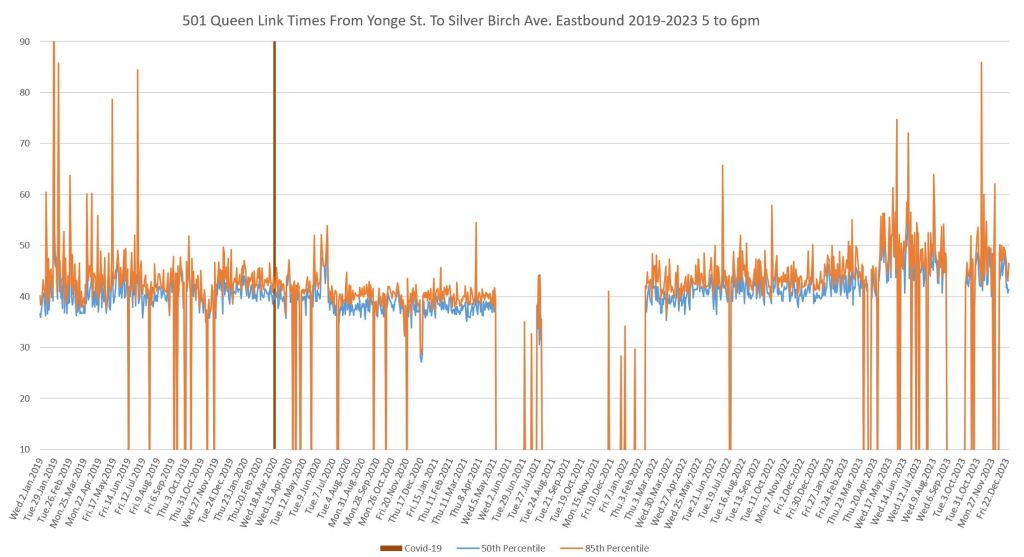
The day-by-day data for the eastern section show some variation, but not as strongly as for westbound trips.

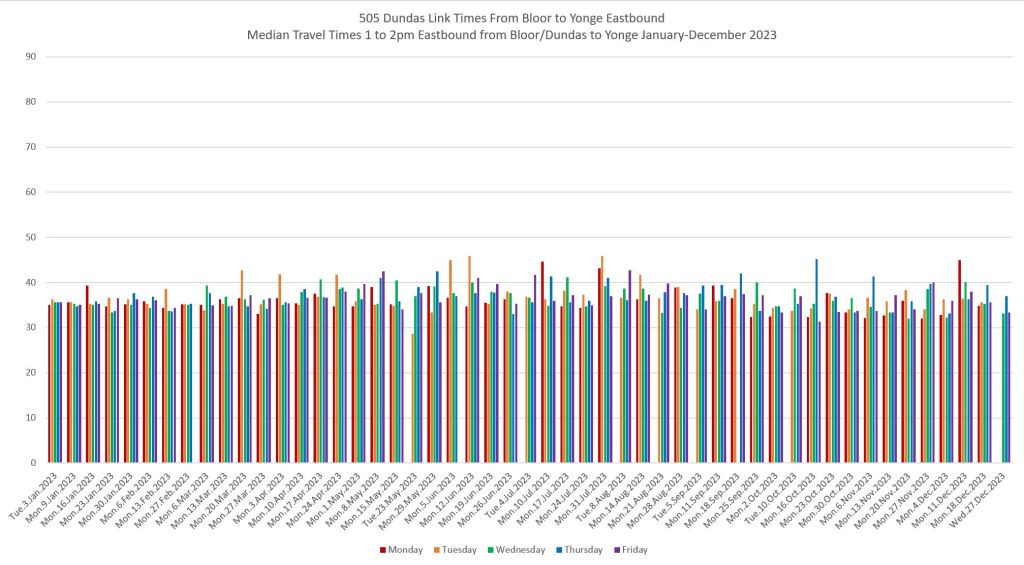
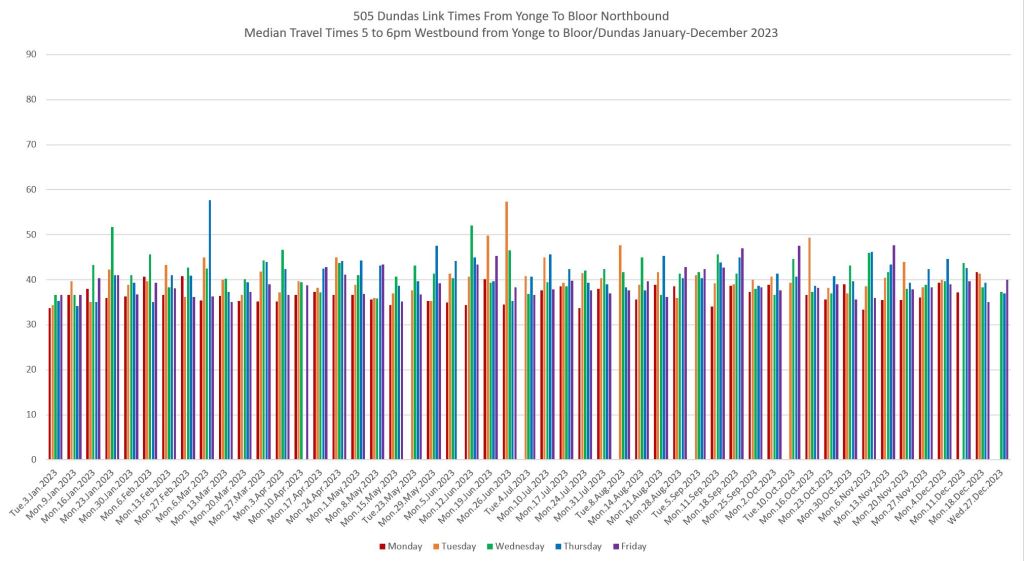
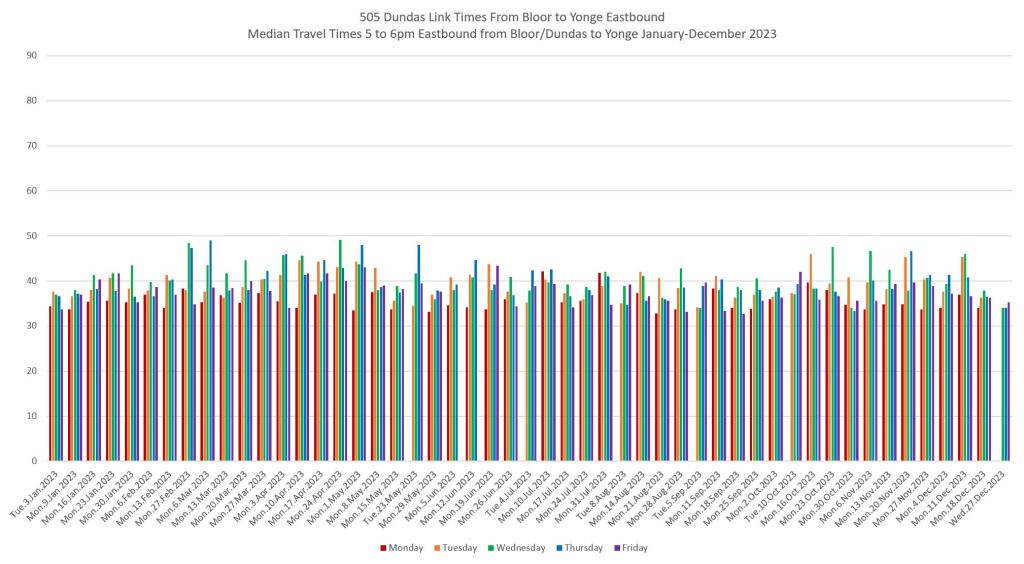
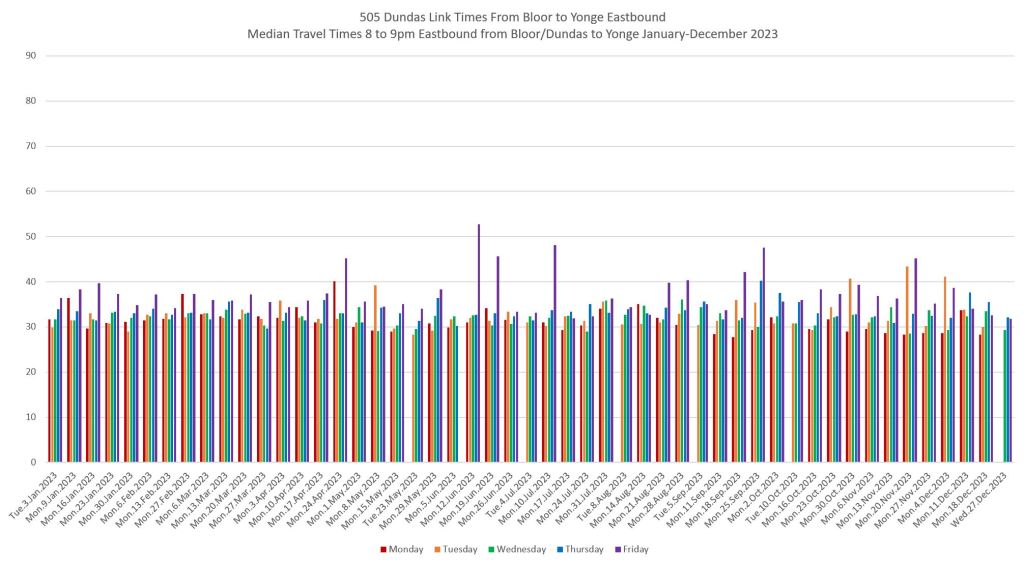
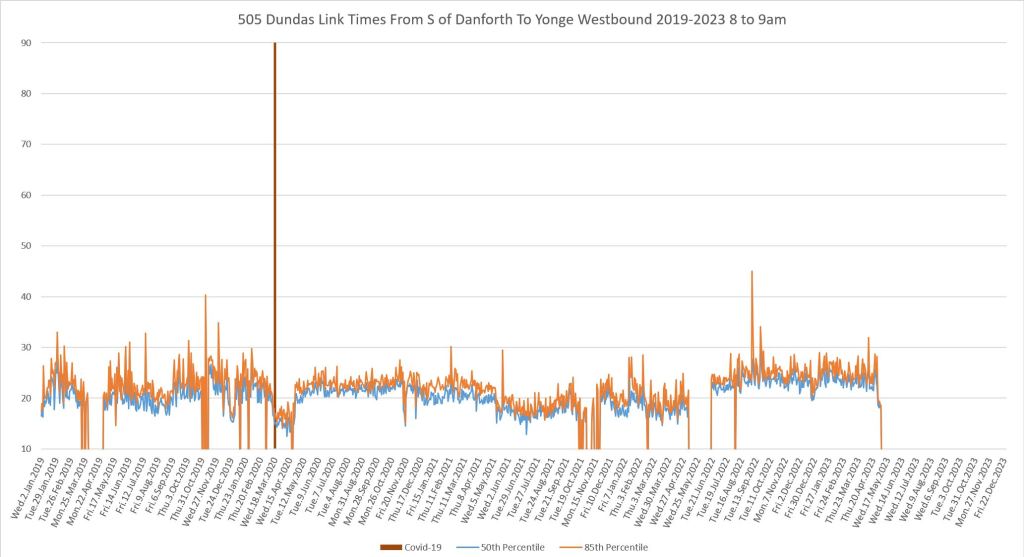
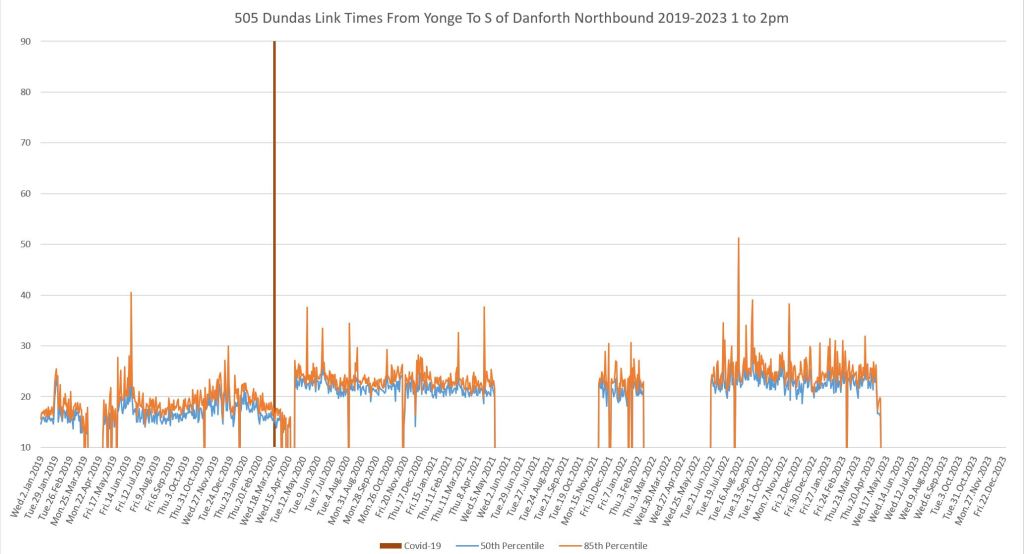
505 Dundas Between Bloor/Dundas and Yonge
Travel times up to March 2020 reflect bus operation over the entire route, and streetcars returned in April 2020. There is a pandemic drop in travel times in March 2020 when buses were operating, but this is reversed with the return of streetcars in April. In previous articles, I have observed that buses run more quickly than streetcars on uncongested roads partly due to driving styles and partly due to TTC streetcar operating practices. However, on congested roads, travel times are determined by traffic conditions and stop service times.
During the period when Dundas cars operated to High Park Loop (May to August 2022), the screenline for the western end of the route is at Howard Park & Parkside, not at Dundas & Bloor.
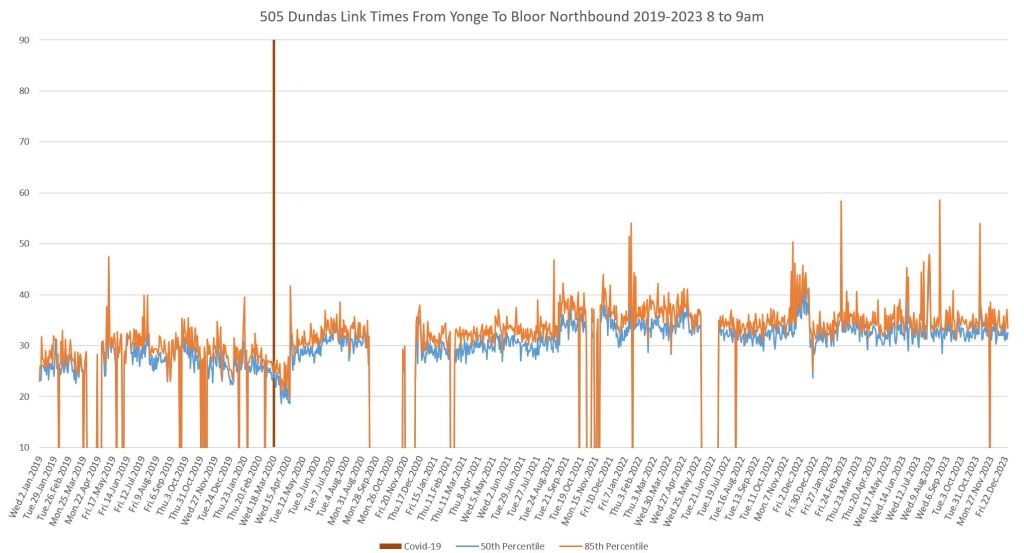
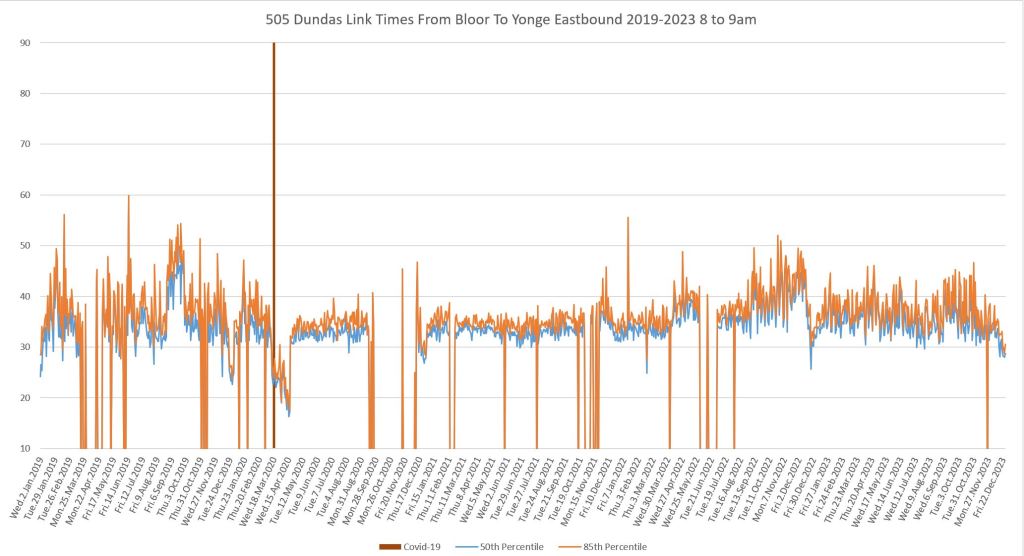
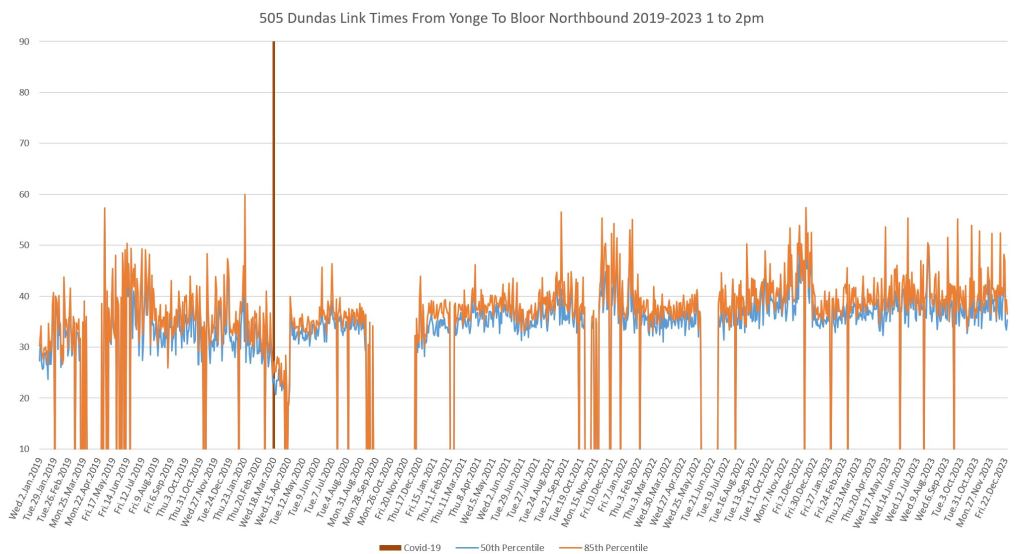
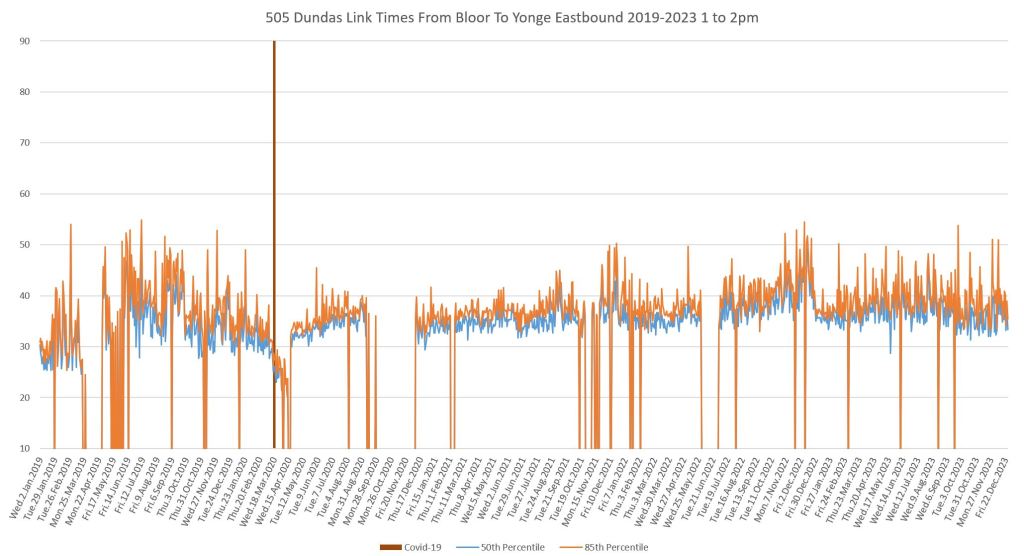
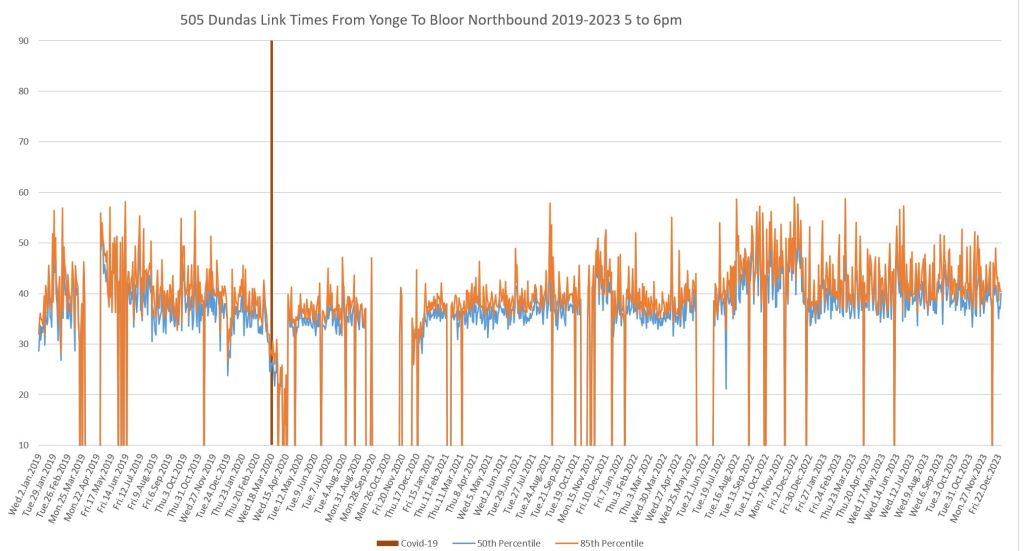
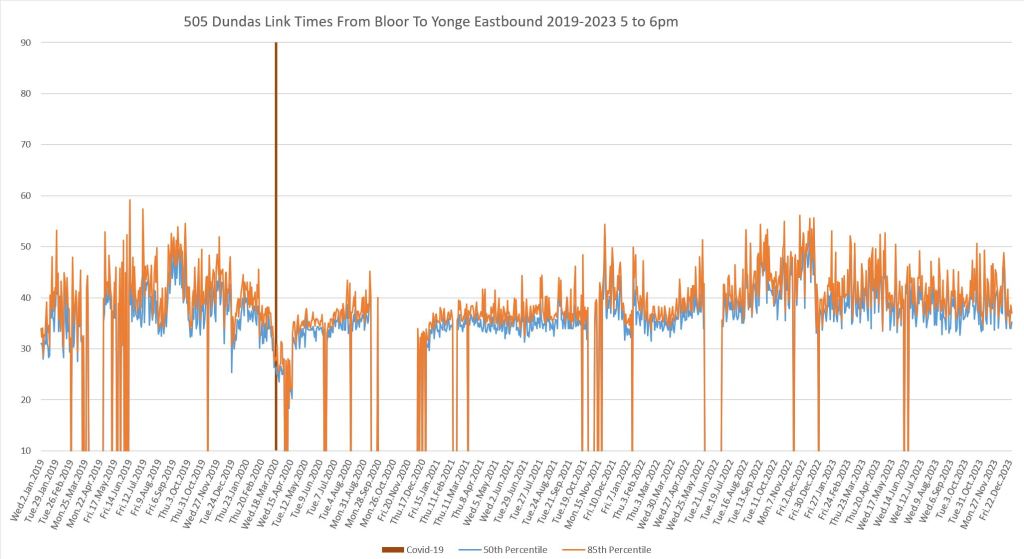
Day-by-day travel times in 2023 for 505 Dundas do not change much and show somewhat less midweek peaking than on other routes. Evening travel times are higher on Fridays.
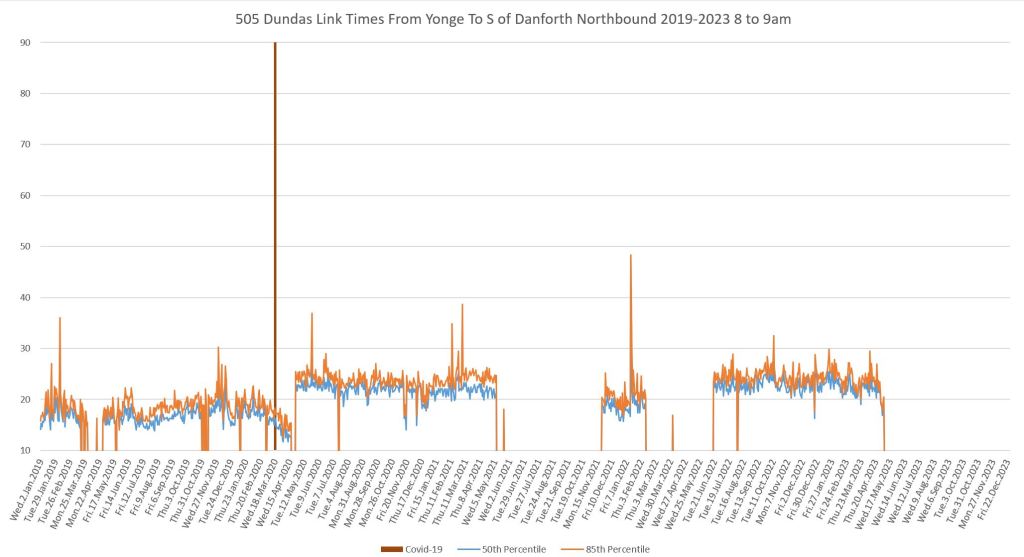
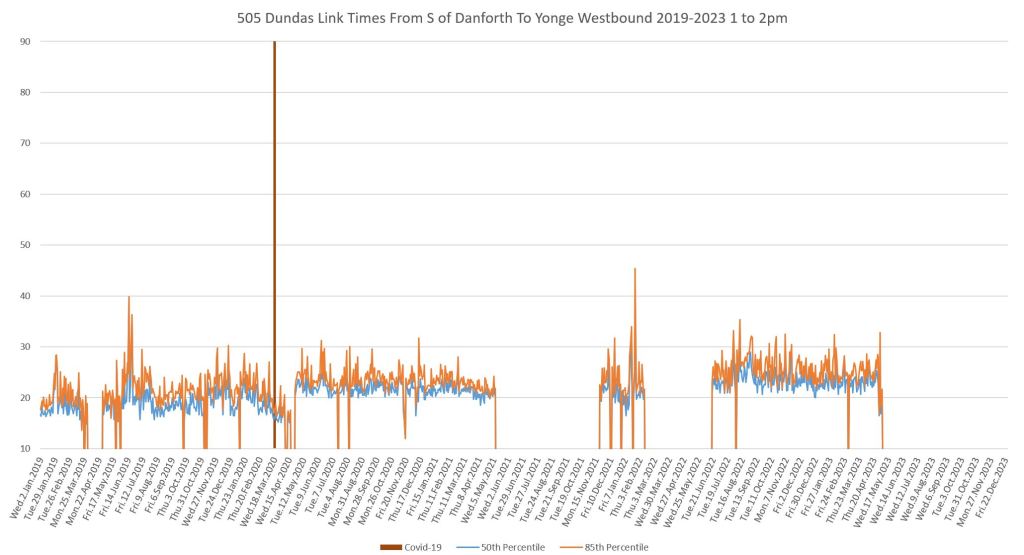
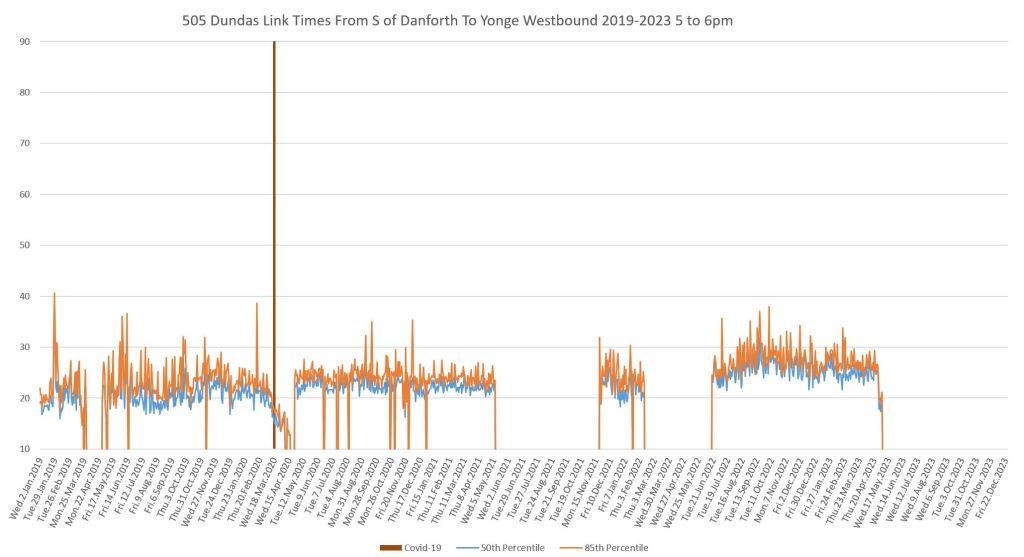
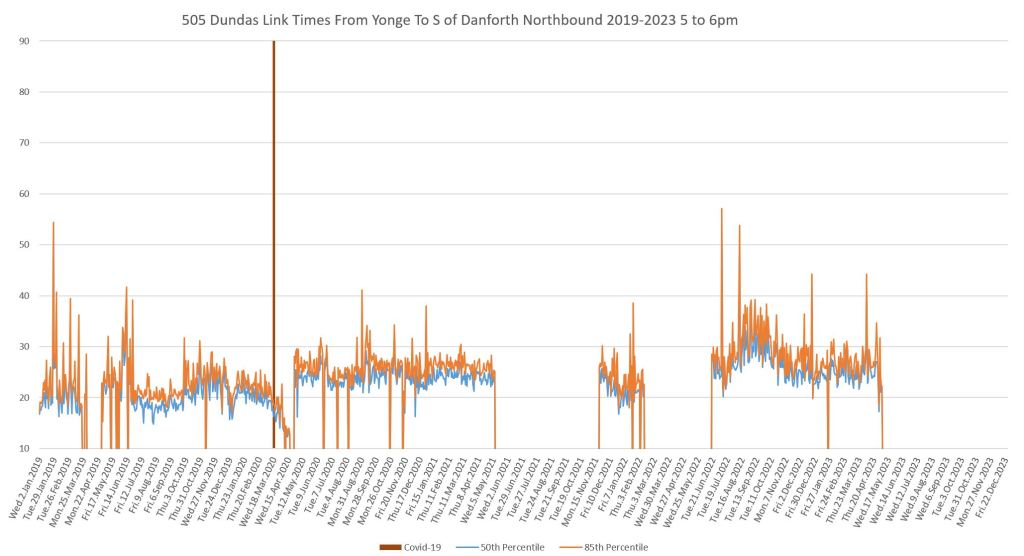
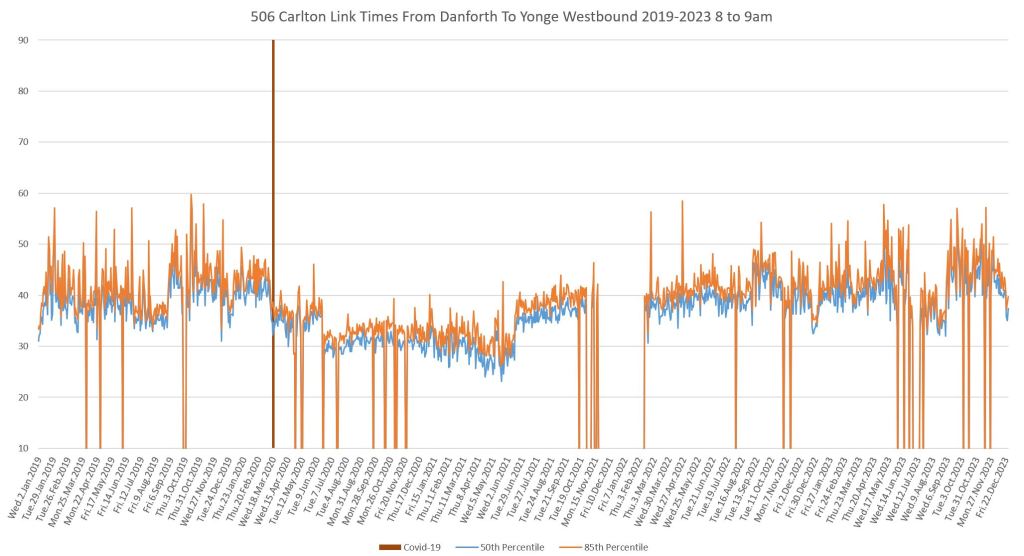
505 Dundas Between Danforth/Broadview and Yonge
The eastern segment of 505 Dundas has not operated to Broadview Station during various construction projects including for much of 2023. I have not included hour-by-hour charts because, as one can see below, the travel times do not vary much in 2023.
As on the western portion, there is a covid drop in March 2020, and a jump when streetcars returned in April. However, the pre-pandemic bus times are shorter before March 2020 in some periods because the east side of the route has less congestion than the west side.
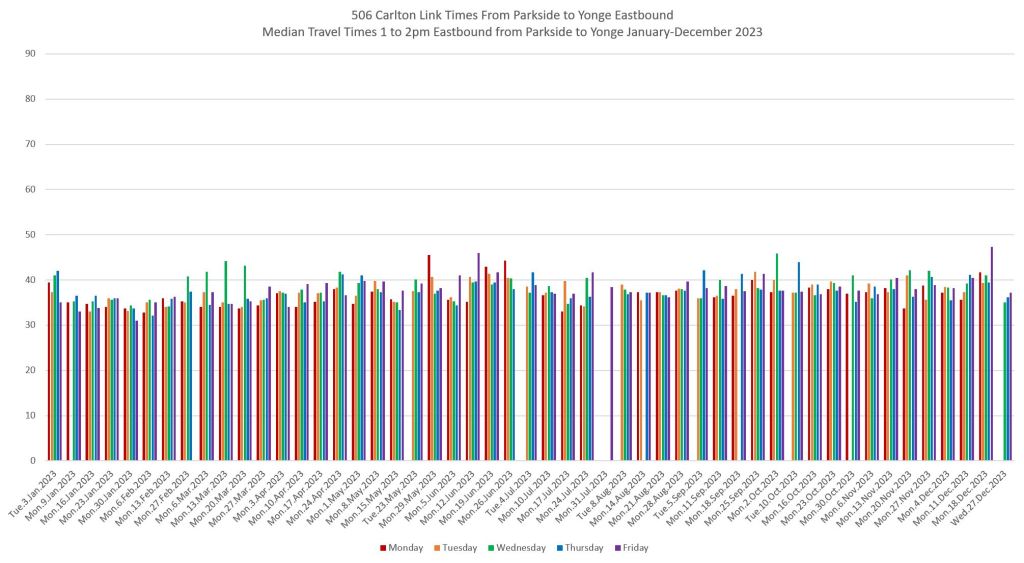
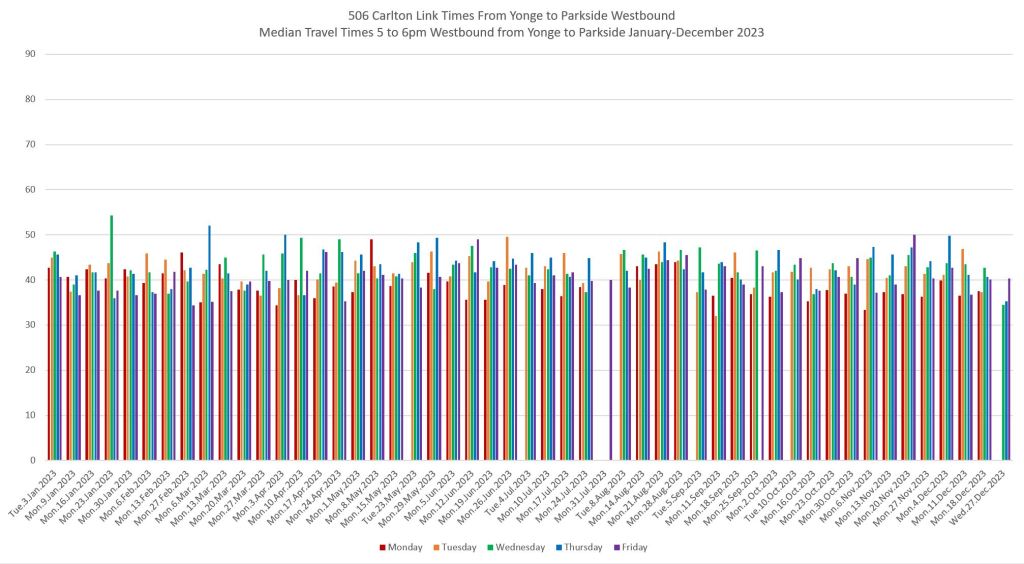
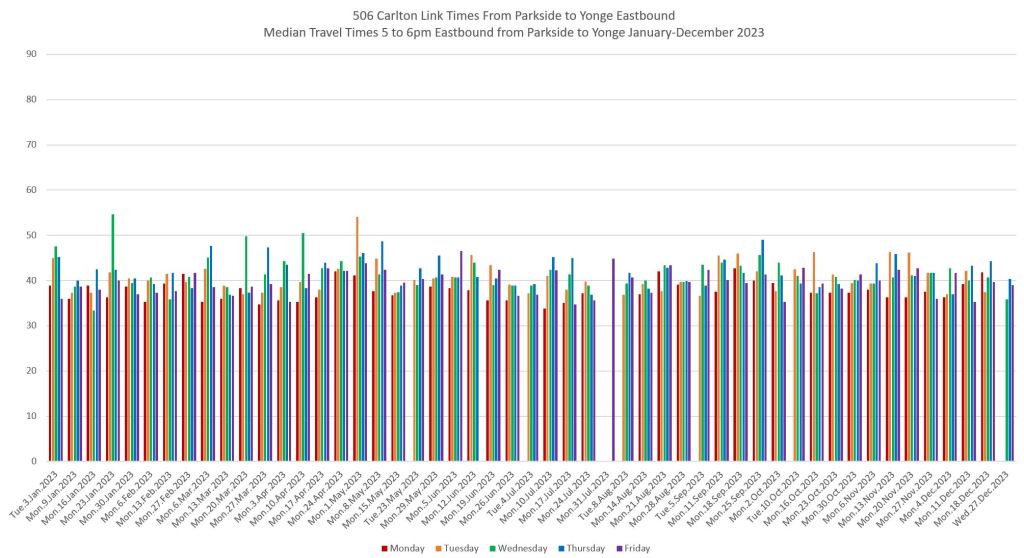
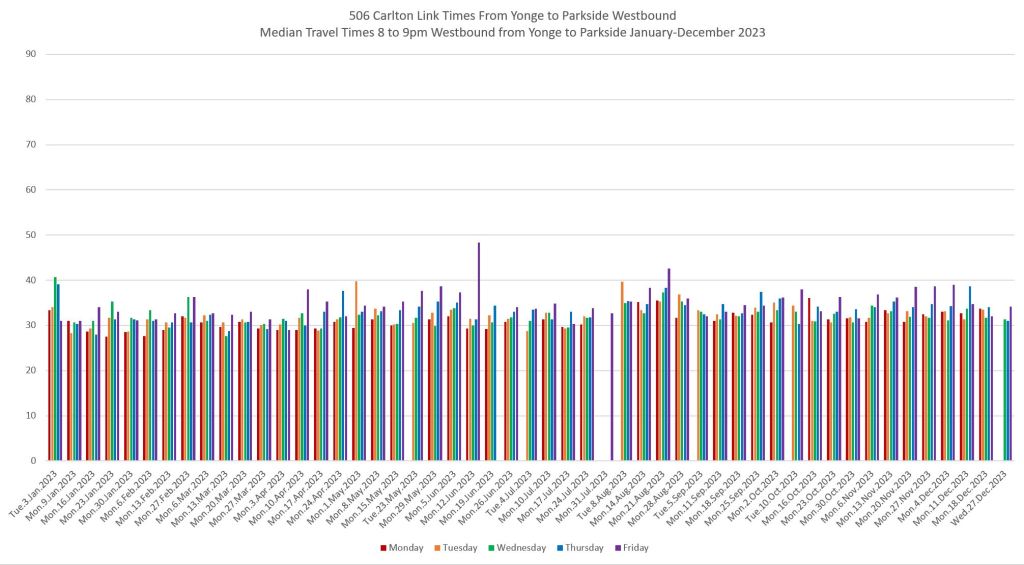
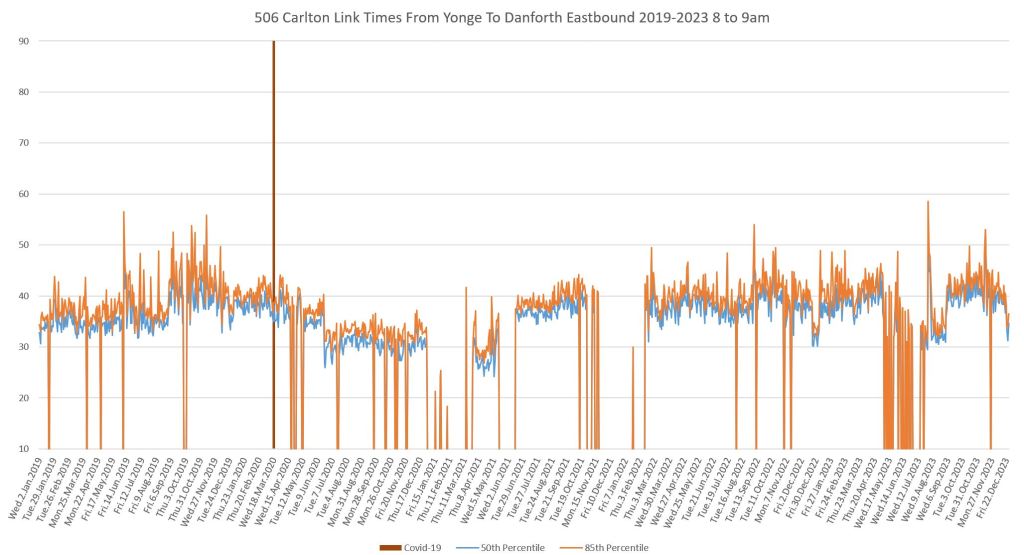
506 Carlton Between High Park and Yonge
For these charts, the western screenline is at Parkside & Howard Park except when the Carlton car ran to Dundas West Station (August to October 2023) when the screenline is at Bloor & Dundas.
Schedules for 2019 are based on CLRV operation, and travel times in 2023 are slightly higher.
Note that from August to December 2022, the route was on diversion due to construction, and this increased travel times because of the extra mileage and turns needed for streetcars to get off of and back onto their normal route.
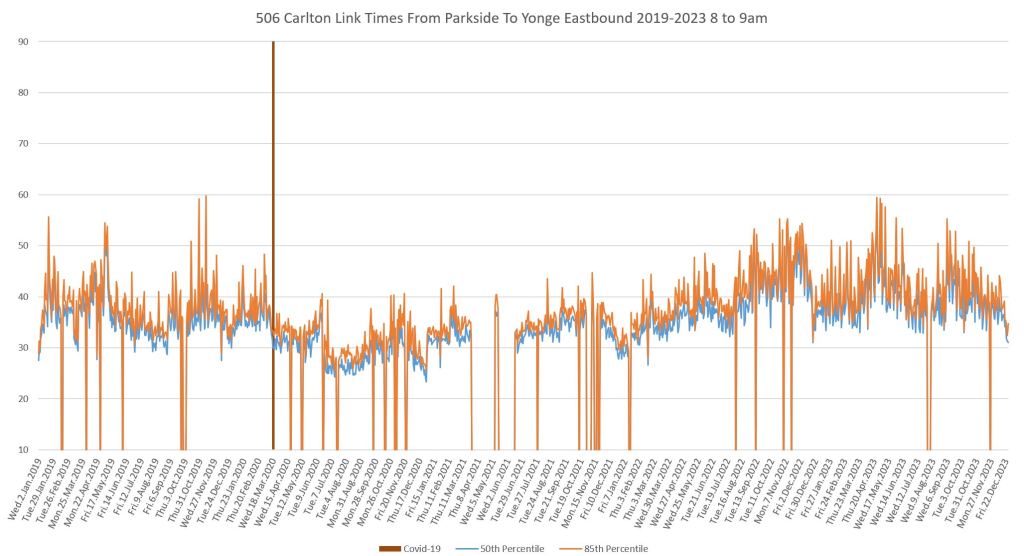
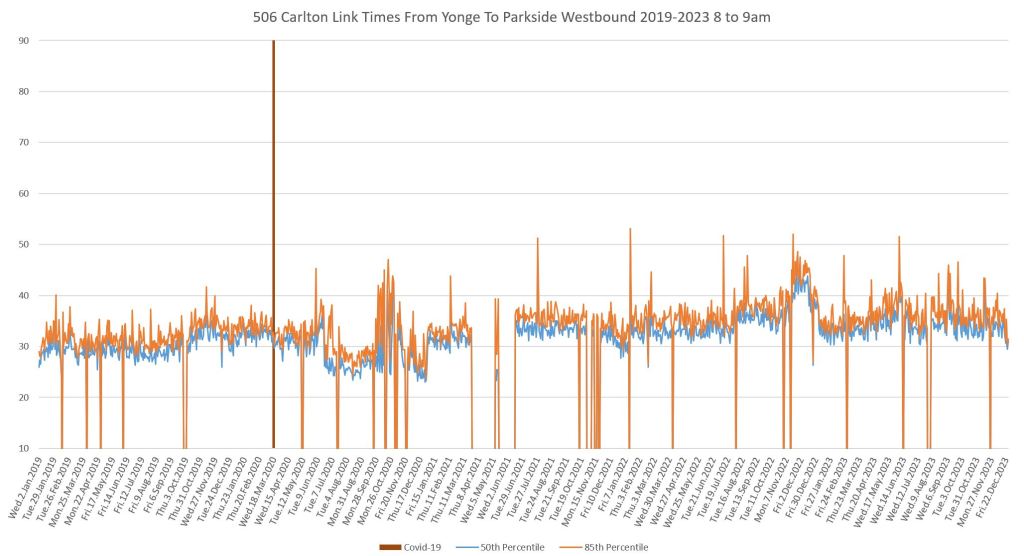
The day-by-day data for 2023 show less variation than other routes although some midweek peaking is evident particularly eastbound in the AM peak.
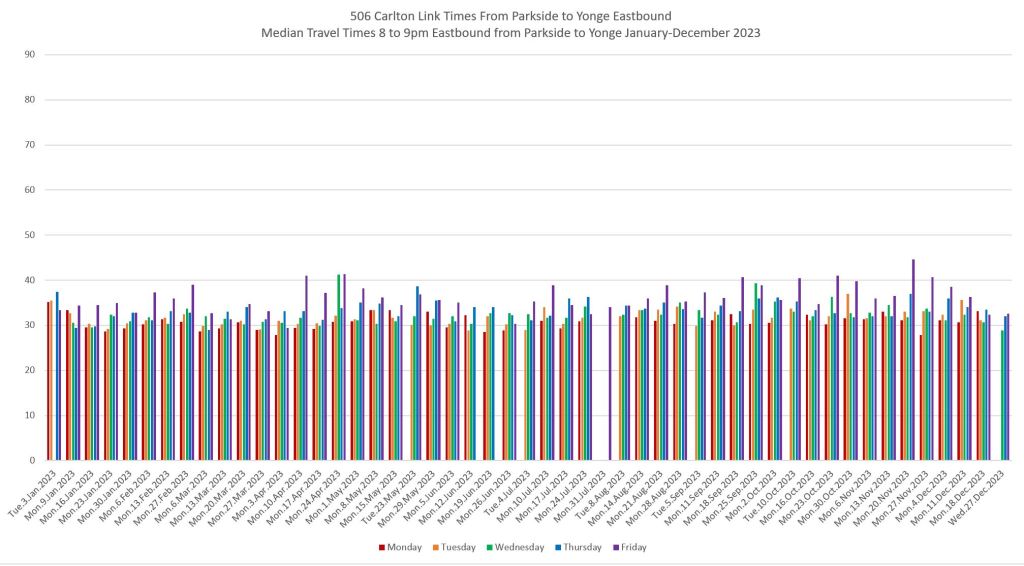
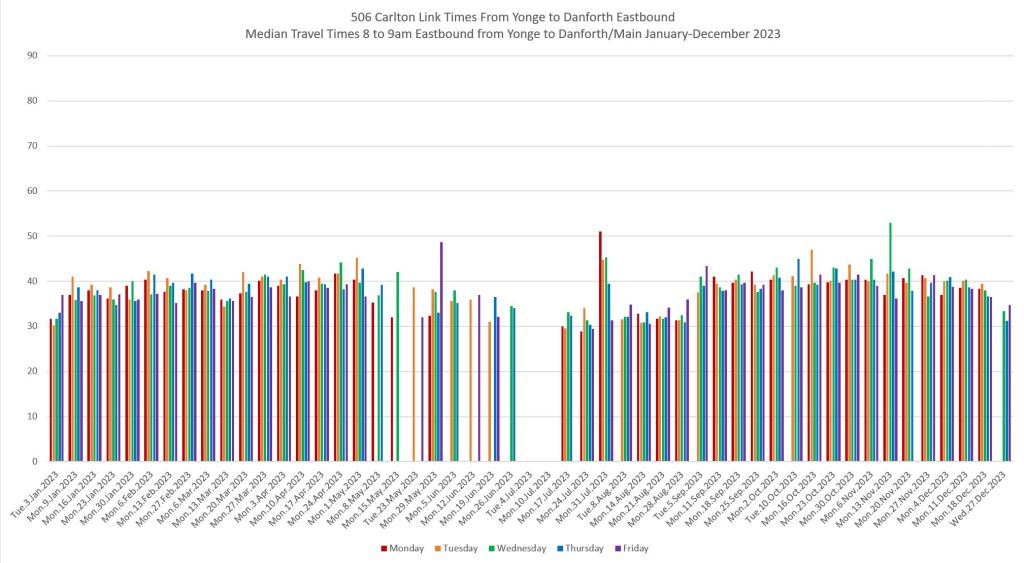
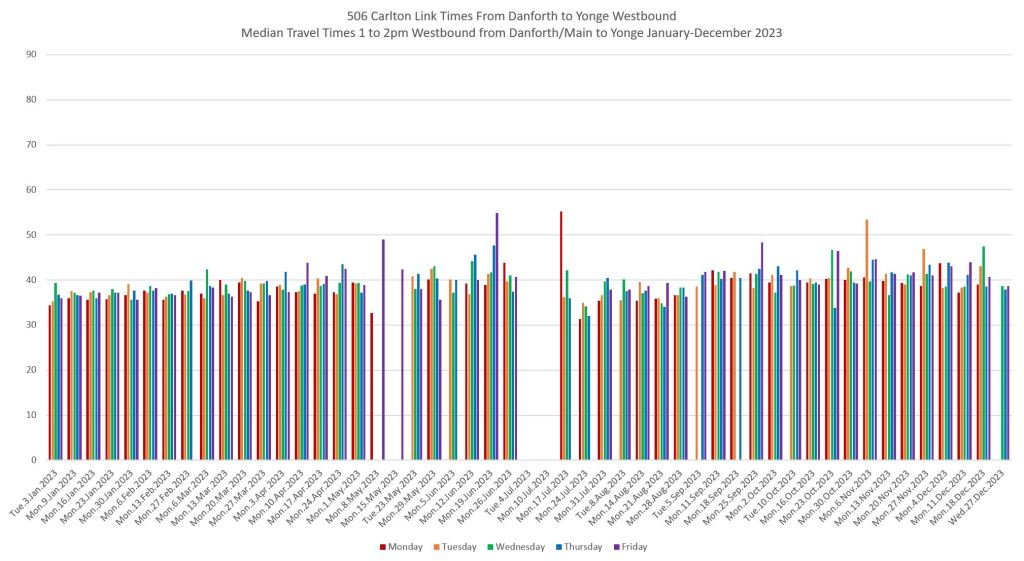
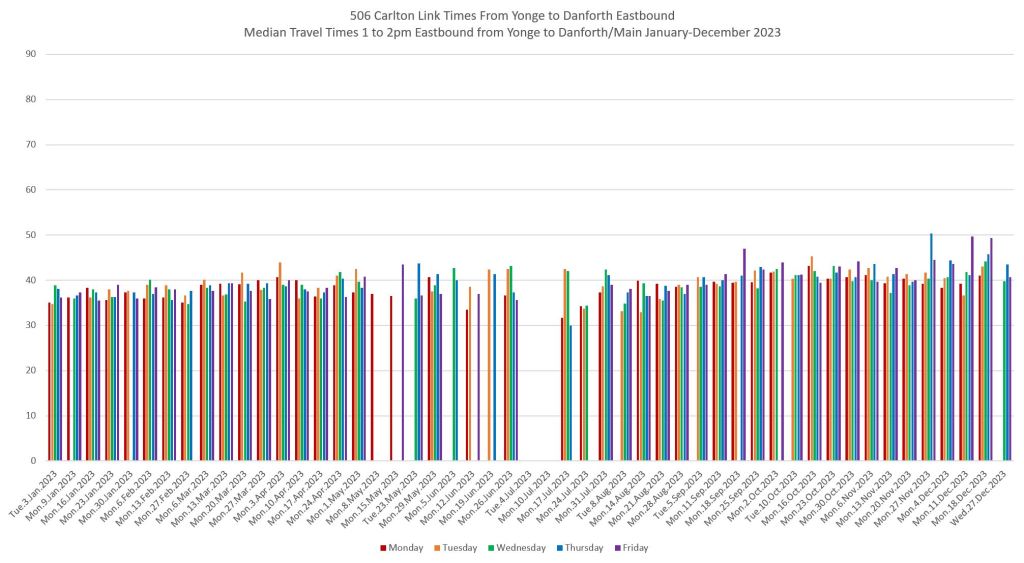
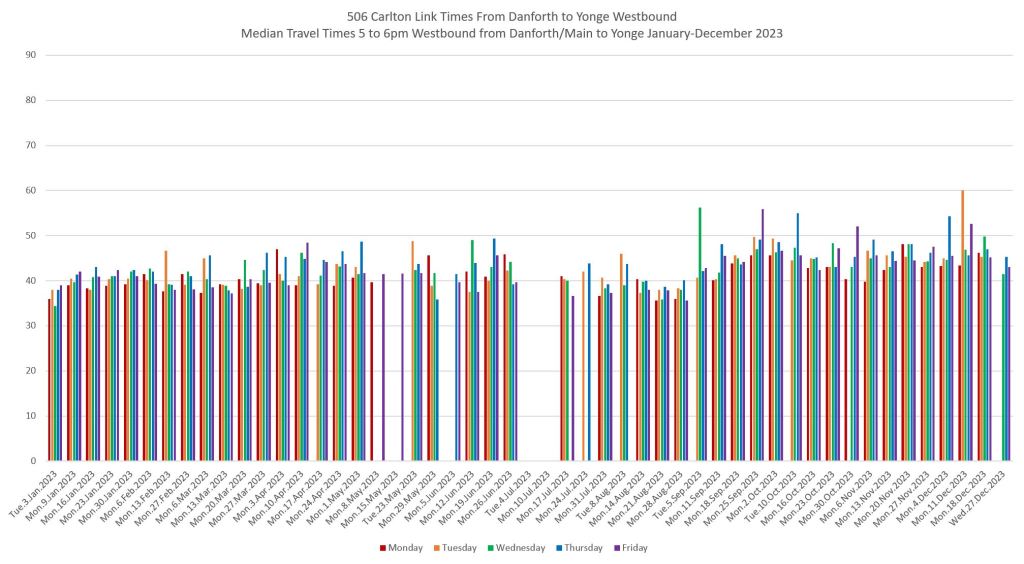
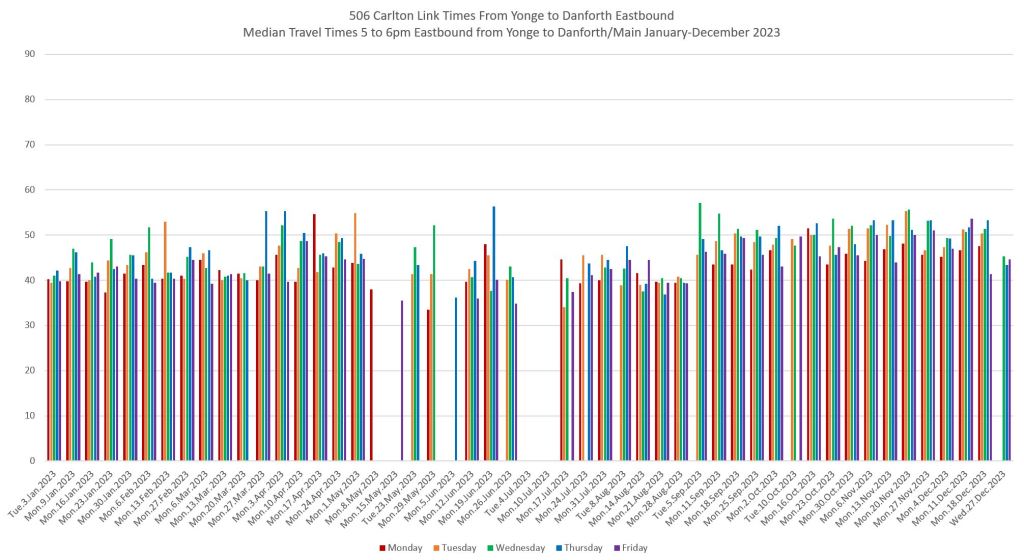
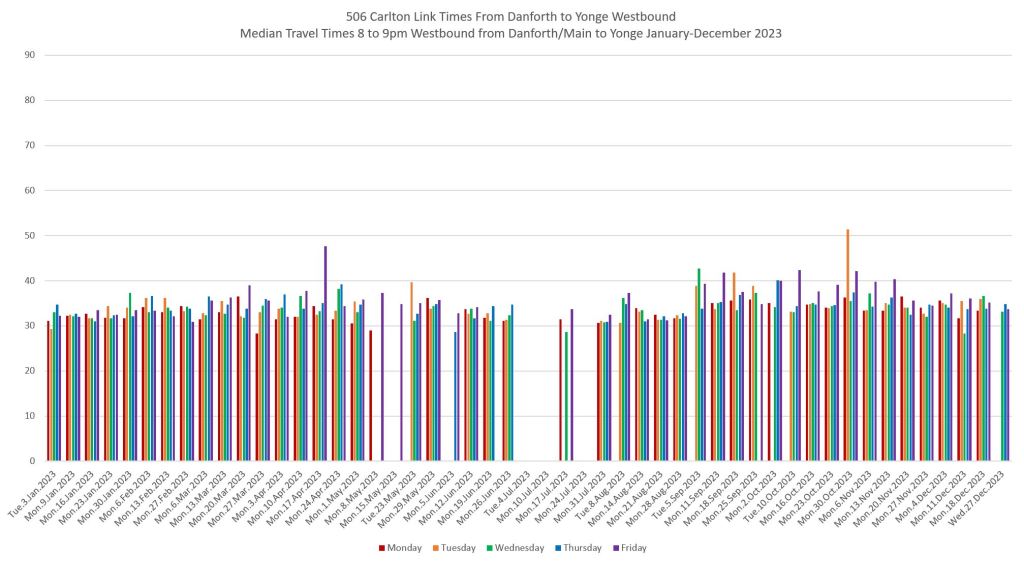
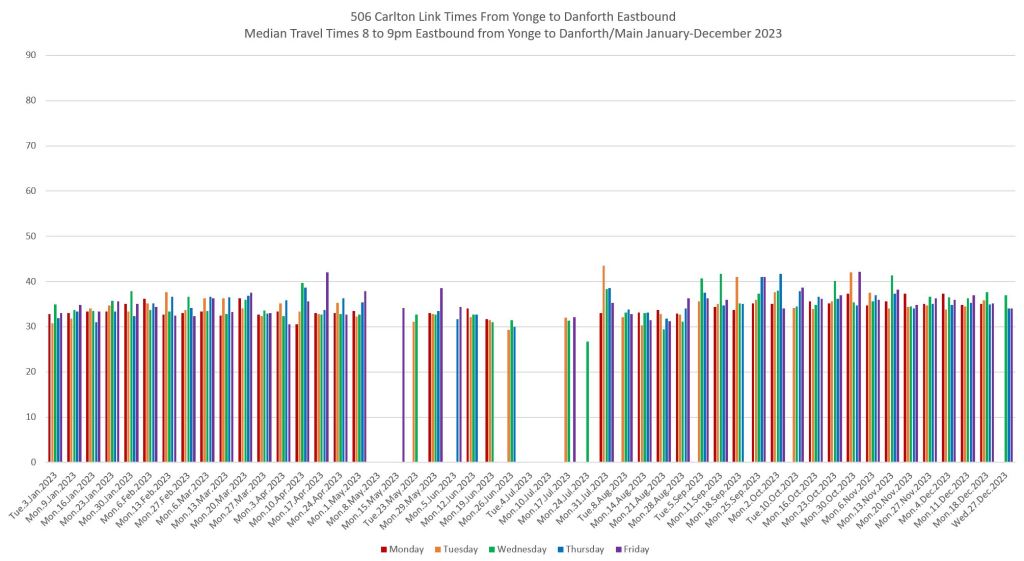
506 Carlton Between Danforth/Main and Yonge
For these charts, the eastern screenline is in the middle of the Danforth & Main intersection.
Almost all of the data are for streetcars, but there are a few bus trippers in the AM peak. Normally these are mixed in with streetcar data, but they are on their own when streetcars were cut back to Broadview as in January 2021. Note that there are values shown on the 8am chart for this period but not on the 1pm or 5pm charts.
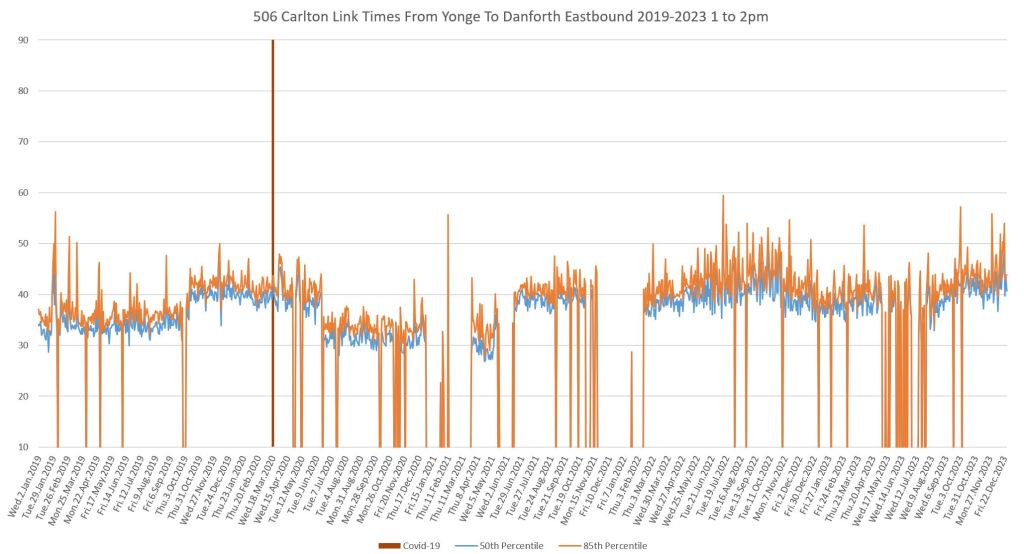
The hour-by-hour data for 2023 show midweek peaking westbound in the AM peak and eastbound in the PM peak, moreso later in the year.

Yesterday evening I got on a streetcar at Spadina station. It was already quite crowded, indicating that it had been sitting there for a while, but it was another five or so minutes before the operator got in and got going. All this time, there was a streetcar sitting in the tunnel waiting to enter the station to unload, and I would assume at least one more somewhere further back.
Has there been any evidence that there has been any attempt to find a solution to this one-streetcar-only problem at Spadina? Because it would have been evident with the start of LFLRV operations, which started with the first deliveries of the new cars, and was officially all-low-floor in January 2016 — eight years ago.
Has it actually occurred to anyone at the TTC that the current arrangement is deeply annoying and frustrating to riders? Who wants to pay to sit or stand in a packed streetcar stuck at a standstill in a tunnel for a length of time that starts to approach the actual travel time (Spadina being a relatively short route)? Have there been any solutions proposed or trialled, other than “Well, we need $200 million to rebuild the underground loop, that’s the solution”?
To me, the current situation says that they really don’t give a shit.
Never mind slowing down the door closing to a crawl, and letting the opening buttons stay active. Thus making dwell times at stops many multiples of treadle-operated PCC and CLRV doors. When the doors have just about crept closed, yet another person runs up and pushes the button and we go through the entire cycle again.
I will point out that, first of all, “It’s for the safety so that people don’t get left in the street” just encourages people to get into the habit of running into the street to push the buttons. I will also point out that Spadina is all platform-loading: no one will be left in the street.
Whatever TTC management might give a shit about, it’s not providing an efficient and effective transit service for riders.
Steve: Condo construction near Spadina & Bloor will expose the loop structure. At that point, the plaform will be extended east so that two cars can be on the platform at the same time. That said, there remains a big problem with long layovers at the loop creating backlogs of cars in the tunnel. As for “safety”, this is too often a catch-all excuse like “congestion”. It’s a serious issue in many parts of the TTC, but is a convenient “out”, a “motherhood” justification that cannot be assailed.
LikeLike
So rather than thinking about ways to accommodate two streetcars right now (like for the past decade), leave it to some future condo project to solve this problem. All those riders stuck in the tunnel can take heart that in five or ten or XXX years, this magically won’t be a problem.
Or maybe they should just walk to the station and save some time. Because the TTC apparently doesn’t care enough to trouble itself to come up with interim solutions. (See “Mistakes Were Made” by Leary regarding the Scarborough RT busway.)
Steve: No questions it is a problem. I have sat in cars waiting to enter the station many times. Part of the problem is that TTC needs to change how it handles crews on those cars by implementing a step back system, shortening the round trip time so that the cars (not the operators) do not have such padded layovers, and ensuring that cars enter and leave the station promptly. It’s the long wait for crew changes and calls of nature that really foul things up.
LikeLike
Let me finish by doing some grade-school math.
Let’s assume that only four streetcars, carrying 50 passengers, are delayed per hour. (The rest all zip right in.) This happens between 8 AM and 8 PM only, so 12 hours per day. And only five days a week. But it’s happened for the last ten years.
Unless I have done my math wrong, that amounts to just about five million person minutes per minute of delay. (50x4x12x5x52x10 = 4,992,000). That’s 83,200 person-hours wasted stuck in a streetcar in the tunnel, even if the stuck streetcars are only stuck for a single minute.
And I think that underestimates the delay, as I have used pretty darn conservative numbers. What sort of “business case” would Metrolinx create for plopping a station down in a greenfield to save 83,200 person-hours of travel time?
Yet the TTC can’t be arsed to try to figure out some interim solutions. Because it’s Too Hard, maybe.
Steve jumps in: 50 passengers x 4 cars x 12 hours x 5 days x 52 weeks x 10 years = 6,240,000 passenger minutes. You undershot by about a million. That’s 104,000 person hours wasted.
The typical value of time used in some of the business cases these days is about $20/hour ergo about $2 million. Those calculations are only used when justifying major “regional” projects, and Metrolinx has been using 60 years in their calculations. Of course if Metrolinx were building it, there would be no streetcar, there would be a subway five levels underground and it might have two stops between Spadina/Bloor and Union.
BTW I think this type of analysis is bogus because those are not real dollars someone can spend, and typically projects are “justified” only through the notional payback of moving people faster. If we proposed just handing out $2mill in small bills at Spadina Station, we would be attacked as raving socialists.
LikeLike
Of course! You should do it at Old Elm GO, then it’s promoting transit for regional connectivity, increasing opportunities, and making it easier to choose transit first.
LikeLike