
This is a follow-up to my first article on this subject: The King Street Diversion Debacle.
From October 19 until early November, there was a major disruption of transit service downtown due to concurrent construction activities and the complete absence of transit priority or traffic management.
- A sinkhole of King east of Jarvis blocked all streetcar service from the afternoon of Wednesday, October 18 to Tuesday, October 24. From October 25 onward, streetcars diverted only weekdays until 7pm.
- Construction on Adelaide Street for the Ontario Line 501 Queen eastbound diversion track continued including the relocation of several underground chambers. This work closed York Street northbound at Adelaide.
- Construction on Queen Street at Yonge for the Ontario Line closed that street from James to Victoria.
This event showed what can happen when a transit service and the streets it runs on are nearing the point of gridlock, and are pushed over the edge by loss of capacity. It also showed, quite starkly, how Toronto’s talk of managing congestion is much more talk than action.
This is a vital lesson in planning for future diversions and special events.
An important issue here is that some of the congestion problems pre-dated the sinkhole. Moreover, congestion did not occur in the same time at all locations, and some of it did not correspond to traditional ideas of peak periods.
The volume of turning movements overloaded the capacity of the intersections to handle transit, road and pedestrian traffic. A detailed list appears later in the article.
Streetcars and buses stop to serve passengers at many intersections, a fact of life for transit vehicles which behave differently from other traffic. Often two traffic signal phases would be consumed per vehicle: one for it to pull up to the stop, and one for it to make the turn. This limited the throughput of some intersections to fewer cars/hour than the combined scheduled service of the routes.
The electric switch southbound at King and Church was unreliable, and operators had to manually throw it so 501 Queen cars could go straight south to Wellington while other cars turned west on King. On its own, this would be an annoyance, but it compounded other delays.
Only 501 Queen ran on its scheduled route looping south on Church to Wellington, then west to York, north to King and east to Church. During some periods, the congestion was so great that the 501 Queen service was redirected from the Don Bridge westward via King to Distillery Loop. Off-route operation plays havoc with trip prediction apps adding to riders’ woes in finding when and where the service they needed would be.
In this article, I review the vehicle tracking data and travel times over the route from Queen and Parliament, west to Church, south to King and west to Peter (east of Spadina) using the 503 Kingston Road car as the primary subject. This was the only route that travelled the full length of the area during the diversion. Some cars did short turn, but most operated west to Charlotte Loop (King, Spadina, Adelaide, Charlotte) and they give a good representation of travel times experienced by all routes.
In the third and final part of this series, I will review the effect the delays downtown had on service of the three streetcar routes. This type of event has effects far from where it occurs, and these are not always acknowledged. A related problem is the inherent irregularity of TTC service even without a major diversion and congestion added to the mix.
After the break, there are a lot of charts for people who like that sort of thing, but there is also a summary for those who want the highlights.
Summary
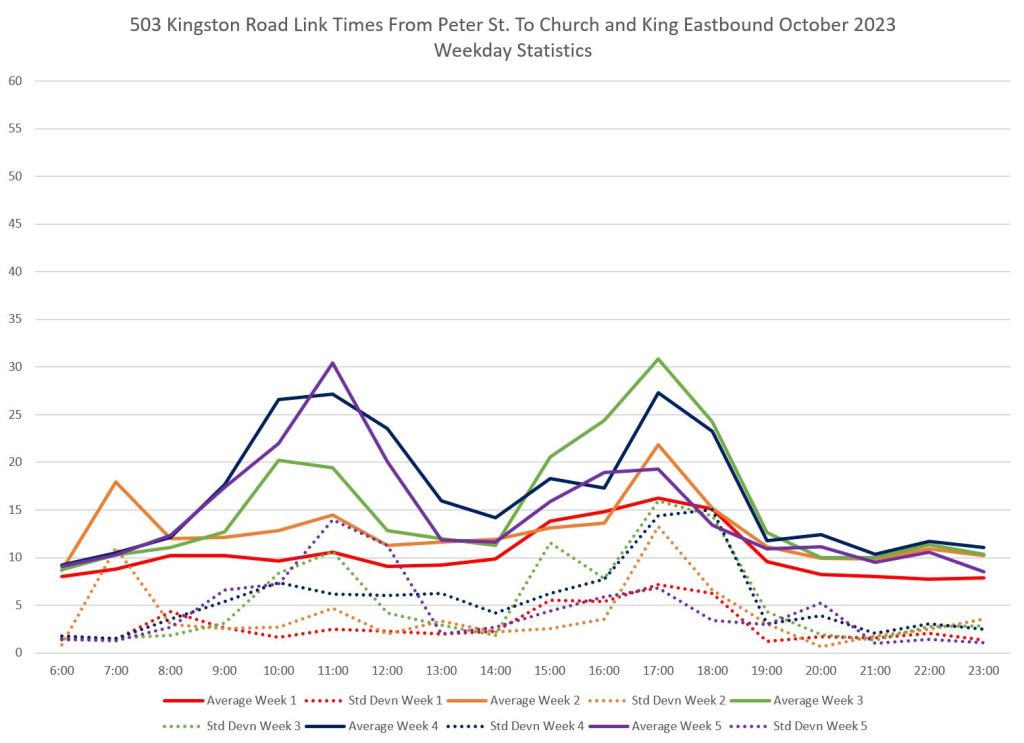
The charts in this section show the travel times between Peter and Church in each direction by week, and then by day. Several points leap out:
- There was congestion at times and locations on King Street that had nothing to do with the diversion, but which pre-existed. The diversion and other nearby works compounded existing conditions.
- Eastbound, the worst figures are seen in week 3 onward when the diversion was in full effect.
- Some congestion problems were outside of the peak period and are probably influenced by delivery and taxi activities. Note that for eastbound delays, there is the familiar “twin peaks” chart of pre-pandemic congestion, but the AM peak is between ten and noon.
- Special events such as baseball games bring their own congestion problems which add to whatever else is happening.
- Some of the weekly data show the Monday/Friday work-from-home effect with shorter travel times even before the sinkhole diversion began, and this persisted after the diversion started. In weeks one and two, there is PM peak congestion on midweek days.
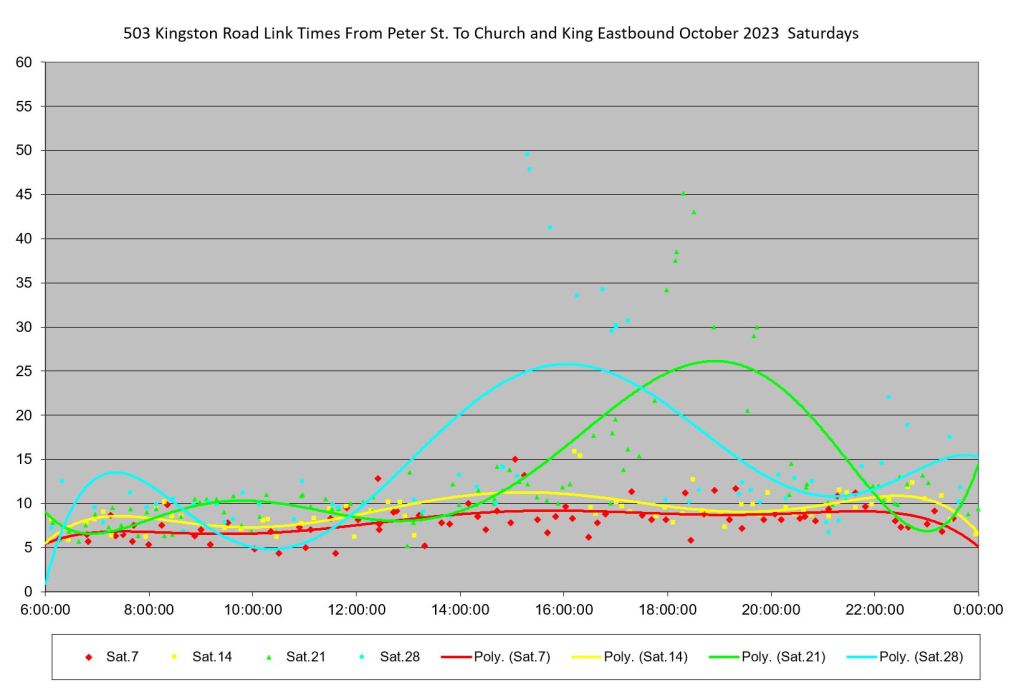
- The eastbound travel time peaks on Saturdays October 21 and 28 arise from different causes, but this is not evident without looking at detailed data. This is discussed later in the article.
Updated Nov. 6/23 at 3:30 pm:
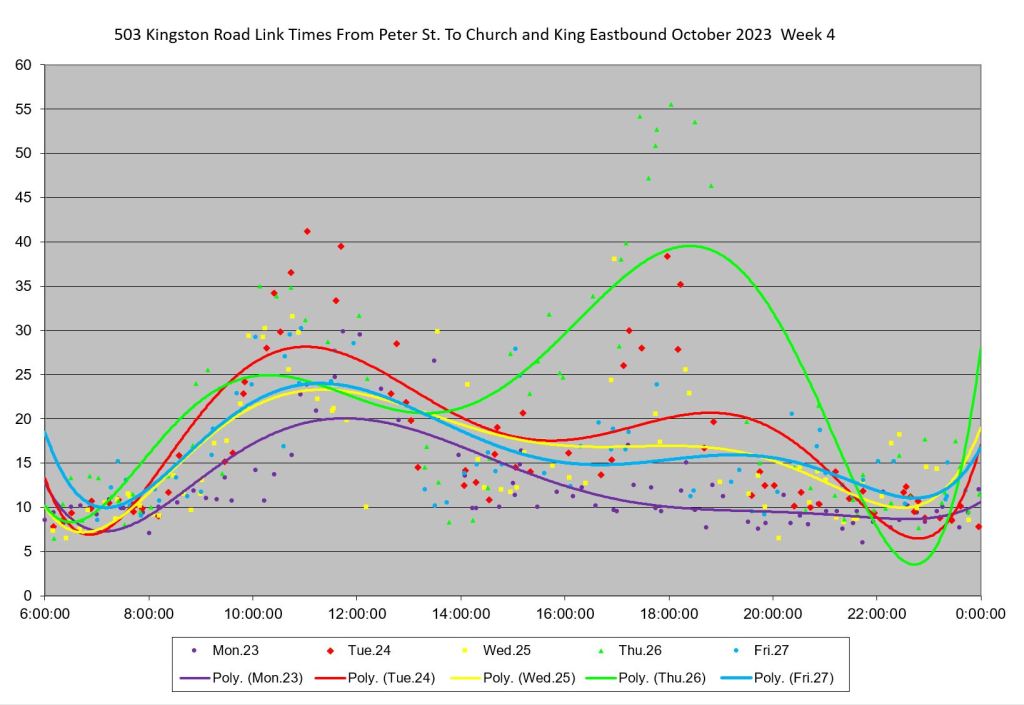
In the Week 3 eastbound chart below, there is a big dip in the trend line for Thursday, October 19. This is not an actual drop in the data values, but the result of an outage on the TTC’s Vision vehicle monitoring system from about 9:30am to 3:30pm.


Turns and Intersection Traffic
The combined transit demands at each intersection where turns occurred was:
- At Church and King:
- Left turns eastbound: 501 Queen, 503 Kingston Road and 504 King.
- Right turns southbound: 503 Kingston Road and 504 King.
- Through traffic east-west: 501B Queen and 504 King/Distillery buses.
- Through traffic southbound: 501 Queen.
- At Church and Queen:
- Left turns westbound, right turns northbound: 501 Queen and 503 Kingston Road.
- At Church and Richmond
- Left turns northbound: 504 King cars
- Through traffic both ways: 501 Queen and 503 Kingston Road.
- At Church and Adelaide
- Right turns eastbound: 504 King cars
- Through traffic northbound: 501 Queen, 503 Kingston Road and 504 King cars.
- Through traffic southbound: 501 Queen and 503 Kingston Road cars.
- At Bay and King:
- Right turns westbound: 501B Queen and 504 King/Distillery shuttle buses.
- Left turns southbound: 501B Queen buses.
- Through traffic westbound: 503 Kingston Road and 504 King cars.
- Through traffic eastbound: 501 Queen, 503 Kingston Road and 504 King cars.
- At Yonge and King:
- Left turns southbound by 504 King/Distillery shuttle buses
- Through traffic westbound: 503 Kingston Road and 504 King cars, 501B Queen and 504 King/Distillery shuttle buses.
- Through traffic eastbound: 501 Queen, 503 Kingston Road and 504 cars, 501B Queen buses.
- The 501B buses also added to left turning traffic eastbound at King and Church, and westbound at Queen and Church, for a brief period when the streetcar diversion was first implemented. The 501B was rerouted to King Street to replace the diverted streetcars.
Screen Lines and Segment Details
For a detailed view of where streetcars and buses were delayed, I have used a more finely-grained set of screen lines than in my usual analyses with the area divided into short blocks, specifically at:
- King & Peter Streets (east of Charlotte Loop)
- King Street & University Avenue
- King & Bay Streets
- King & Yonge Streets
- Church & King Streets
- Church & Queen Streets
- Queen & Jarvis Streets
- Queen & Parliament Streets
Between Peter and University
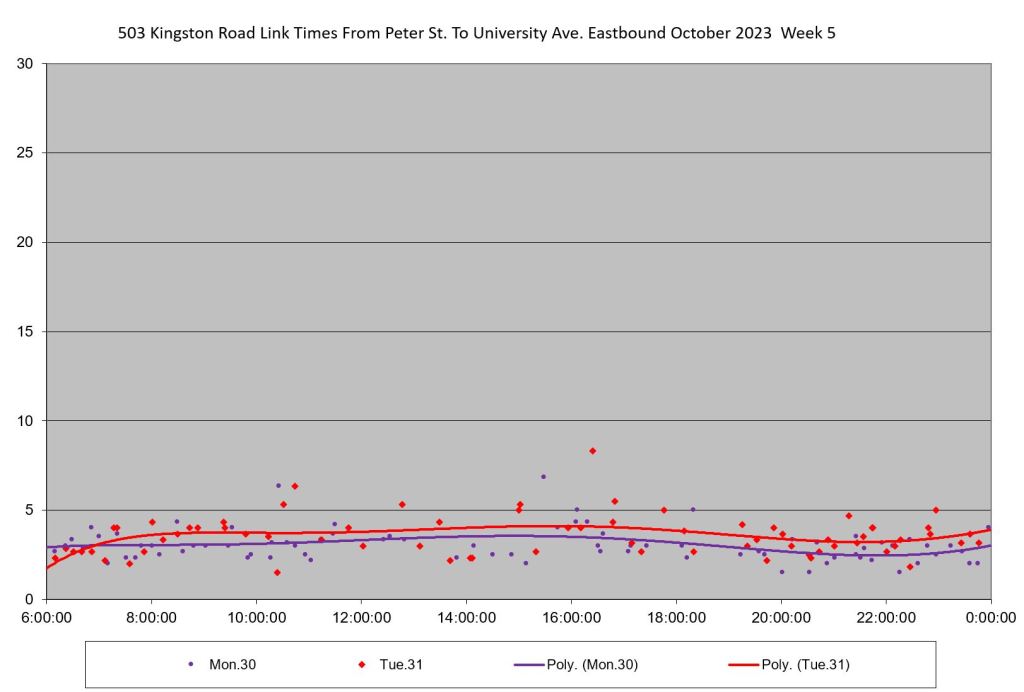
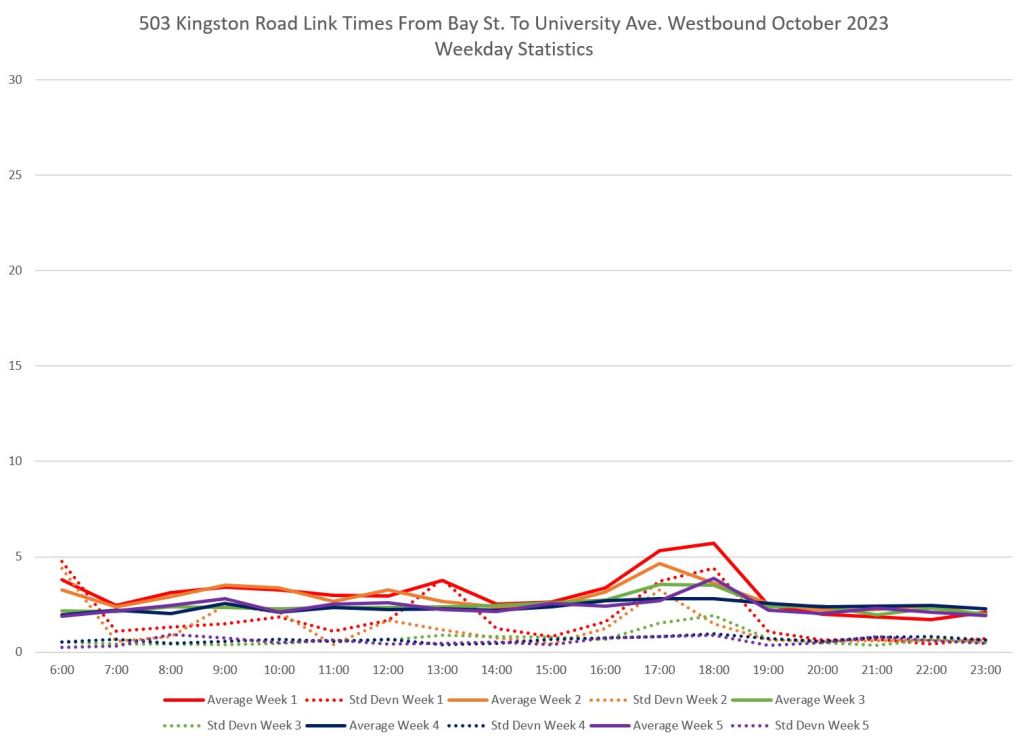
Here are charts showing average travel times by week and hour in each direction over this segment. Each week has its own colour with the solid lines showing the average values, and the dotted lines showing the standard deviations, a measure of scatter in the underlying numbers.
For eastbound travel, the disruption during the afternoon is not confined to weeks of the sinkhole (midway through week 3 onward). Week 1 (red, operating with buses) and week 2 (orange, with streetcars) show delays in this segment. This is typically caused by traffic backing up into the King/University intersection and slowing all approaching vehicles, and it is particularly bad on major event days.
There is little change in travel times westbound, and the standard deviation values are low indicating that the individual times are tightly grouped around the average.


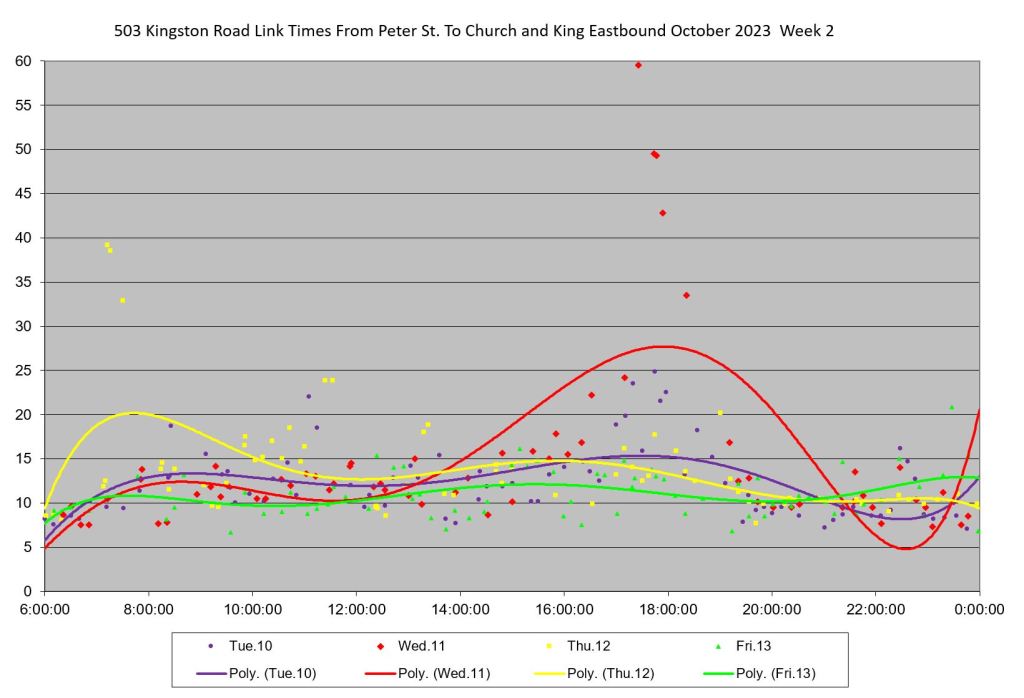
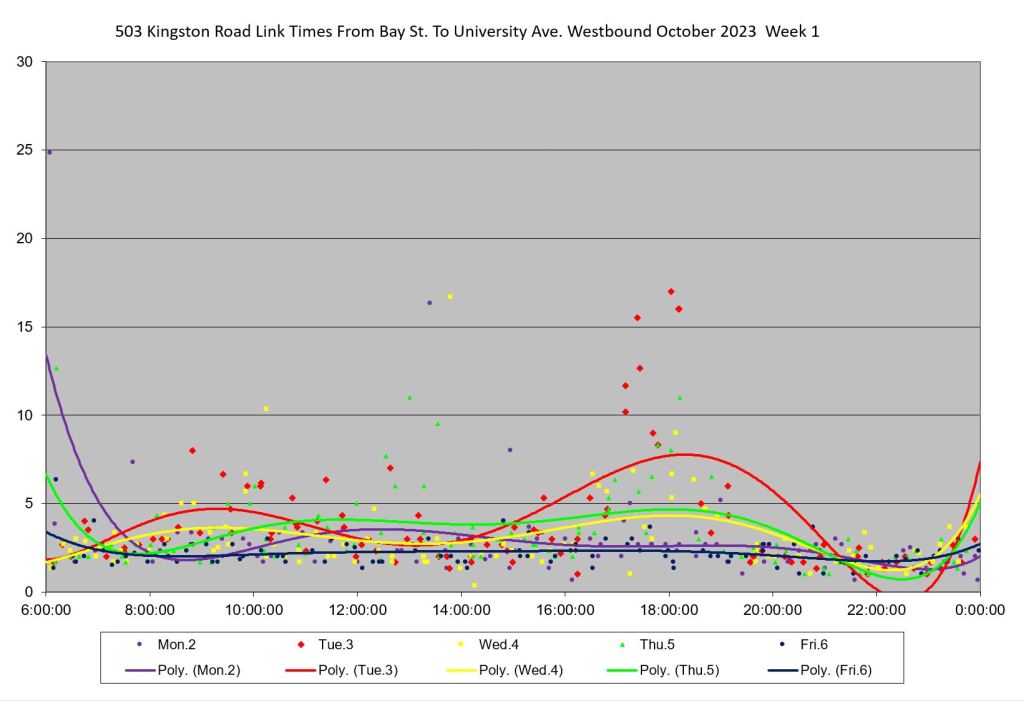
Here are detailed breakdowns of eastbound travel times for weekdays and Saturdays (click on any image to open the gallery). Note the high travel times on October 3, 4, 11 and 17 before the sinkhole diversion began. Two Saturdays were affected, October 21 and 28, but at different times. (These are discussed in detail later in the article.)
[Note that the solid lines are not averages, but rather trend lines showing the overall movement of values. The math behind them creates odd effects attempting to fit a smooth curve when there is a lot of variation such as dipping below zero in a few cases, but the overall shape shows the contrast between good and bad days.
Updated Nov. 6/23 at 3:30pm: The dip below zero for Thursday, October 19 eastbound at midday is caused by the absence of tracking data for four hours. This causes the interpolation equation to attempt to fill in for the missing data with a best fit that falls below zero.


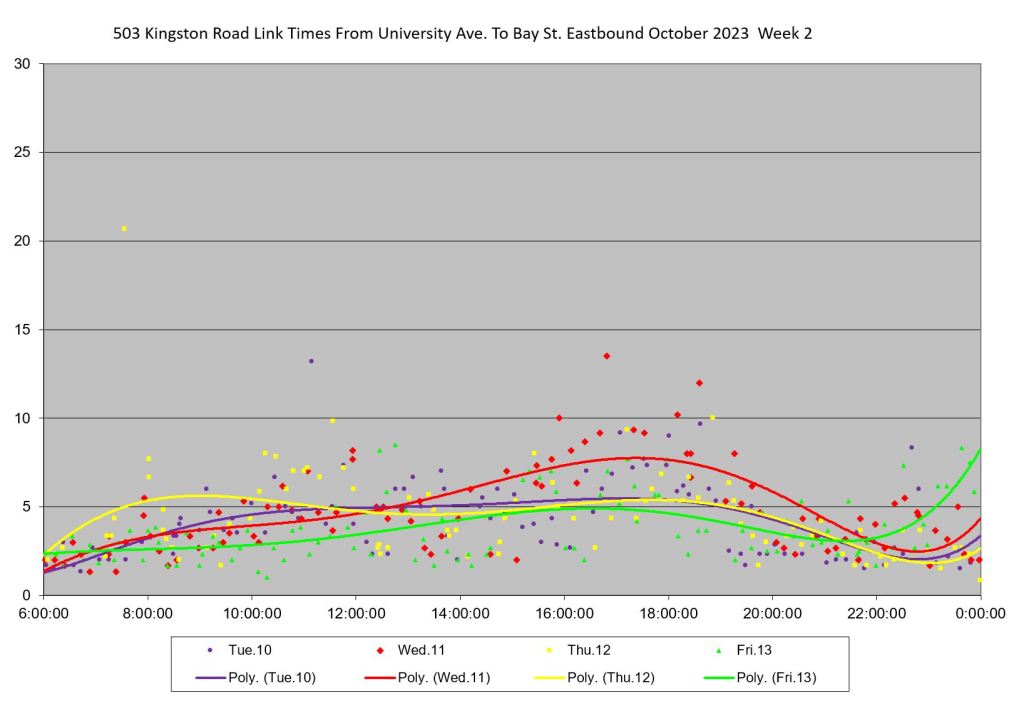
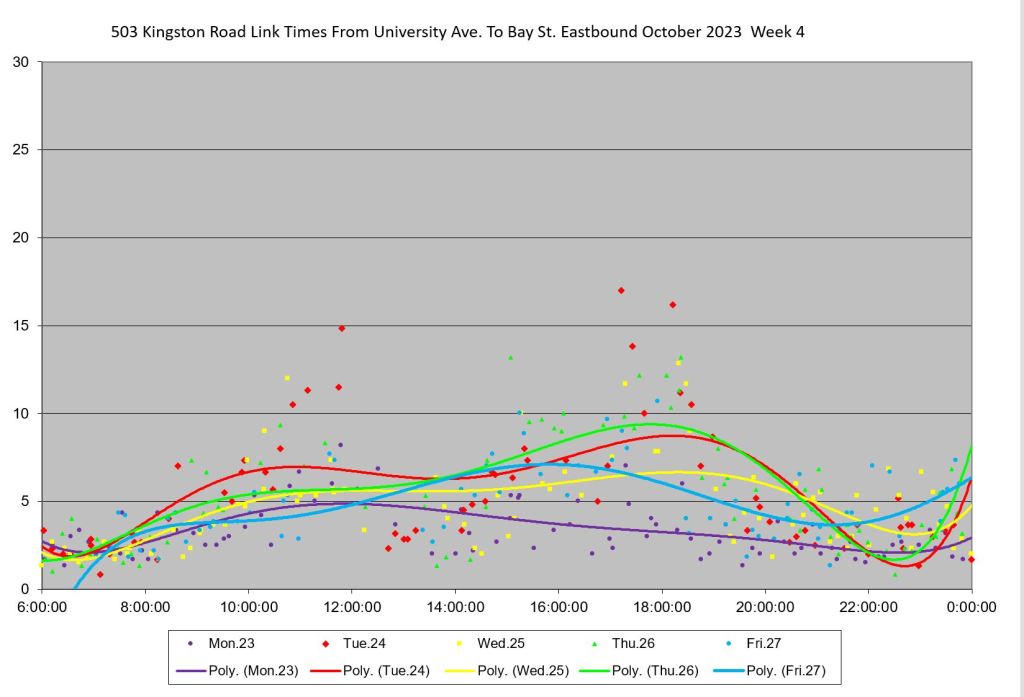
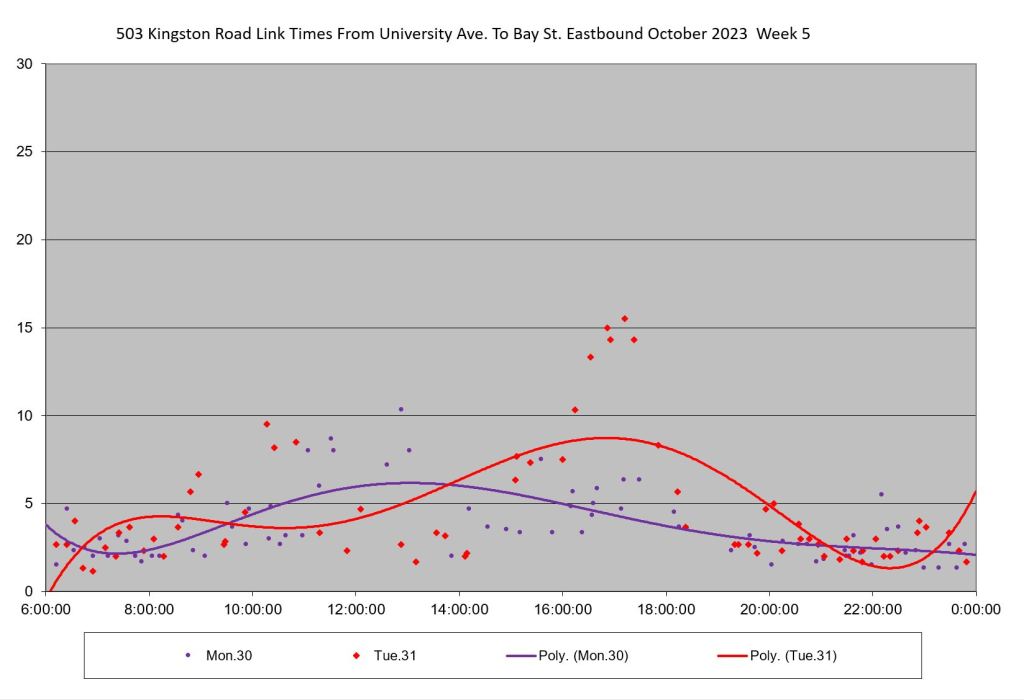
Between University and Bay
This segment also shows some extended travel times in the weeks before the sinkhole diversions, but it includes a late morning effect (10 am to noon) eastbound that is not present in most other segments.
Westbound travel times are quite consistent for weeks 3-5. Saturdays show a similar pattern to the section west of University.

Here are the averages by day and hour for each day and direction.


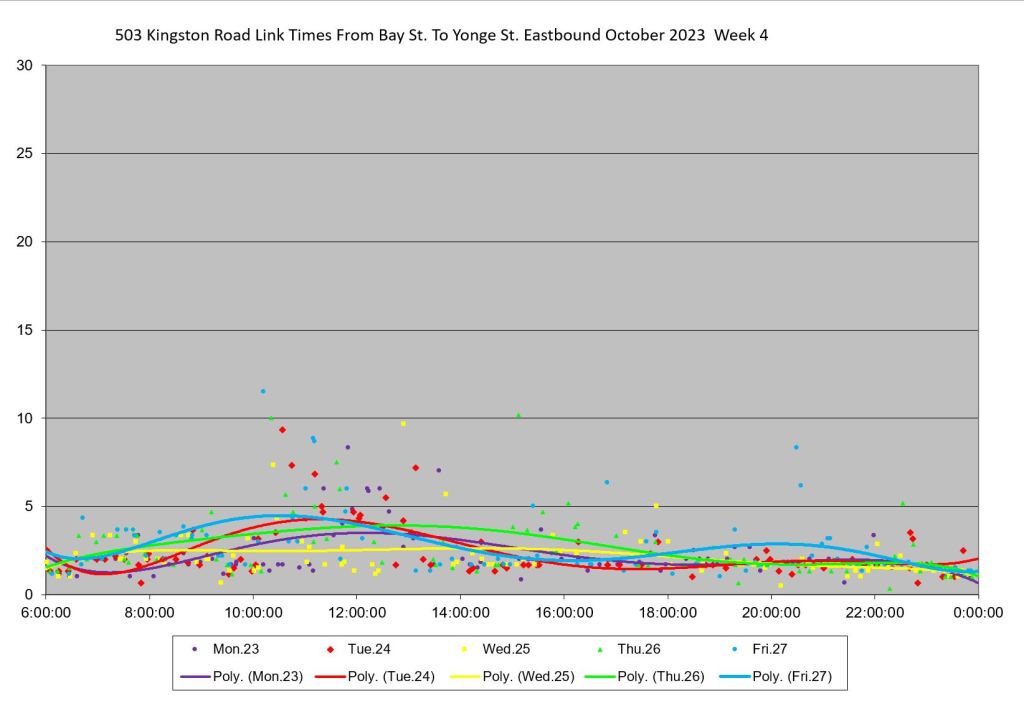
Between Bay and Yonge
Travel times rose between Bay and Yonge in both directions but at different times. Eastbound travel was slower in Weeks 4 and 5 midday, while westbound travel was slower in the traditional PM peak.
Note that Week 3 contains three days when the diversion was not in effect and this dilutes the variation in weekly average values.


The detailed charts show how individual trips are in some cases well above the trend lines through the data.


Between Yonge and Church
This segment was the most severely affected by backlogged traffic with average eastbound travel times rising from a few minutes in Weeks 1 and 2 to almost a quarter hour in Weeks 4 and 5. Note that this effect drops off in the afternoon, and the worst problem is during the midday when transit vehicles were likely competing with other traffic for road space and time. Westbound travel times also rose, but at a different time and not as badly.


Week 3 contains a mix of data from pre-diversion up to midday on Thursday, October 19, and post-diversion thereafter. On an average basis above, the peak is lower, but the daily figures show the increase when the diversion began, notably on Friday.
Weeks 4 and 5 show the effect of the diversion on all days. There are also delays eastbound on the evening of Saturday, October 21 when the weekend diversion was in effect.


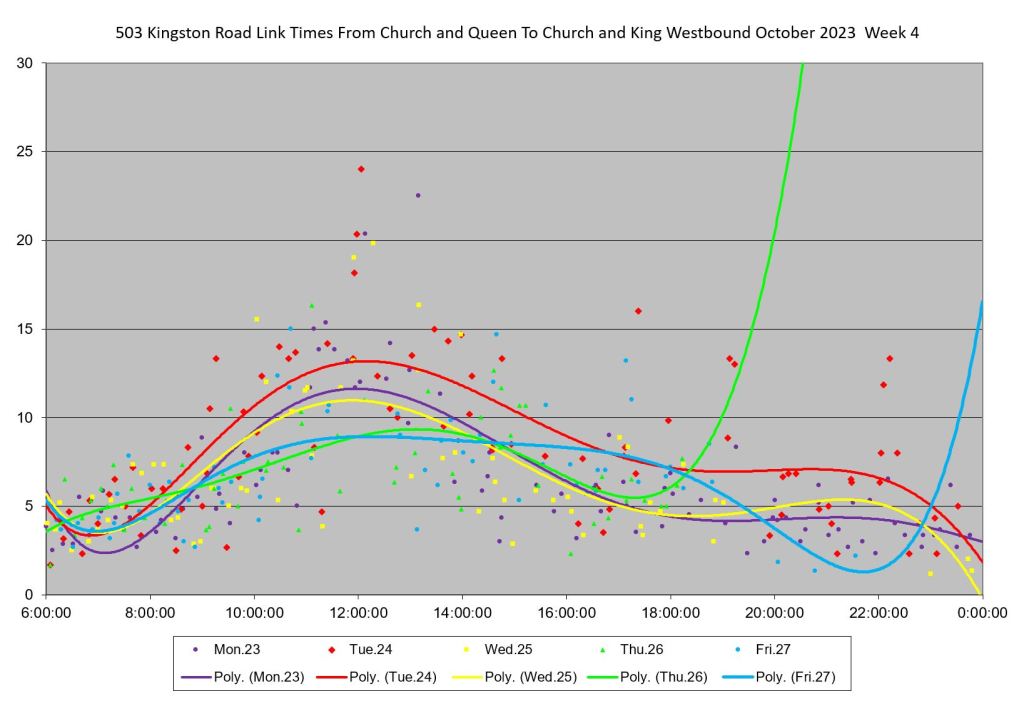
Between King and Queen on Church
Travel times on the Church Street segment of the diversion varied over the course of the day, and were particularly bad westbound (southbound on Church). Times in Week 5 evenings fall to zero because the service resumed operation on King Street and there are no data for that period.
Note that the standard deviation values rise particularly for westbound travel reflecting the scatter of individual travel times visible in the detailed day-by-day charts with some trips from Queen to King taking over 20 minutes.


Between Church and Jarvis on Queen
The rise in westbound travel times in Week 3 in the early afternoon was caused by the combined effect of 501 Queen cars, 501B Queen buses and 503 Kingston Road cars all trying to turn west to south at Church and Queen Streets on Thursday, October 19 when the diversion began. After 3pm, the 501B buses were rerouted to King Street between River and Church, and this reduced the total number of turning transit vehicles at Queen and Church.
Note that in Week 5, the average travel time drops to zero in the evening because service returned to King Street during those hours and there is no data for 503 cars on Queen.


Between Jarvis and Parliament on Queen
The situation in the segment from Jarvis to Parliament is similar to that at Church except the backlog of traffic from the westbound left turns at Church on October 19 in Week 3 is not as severe.


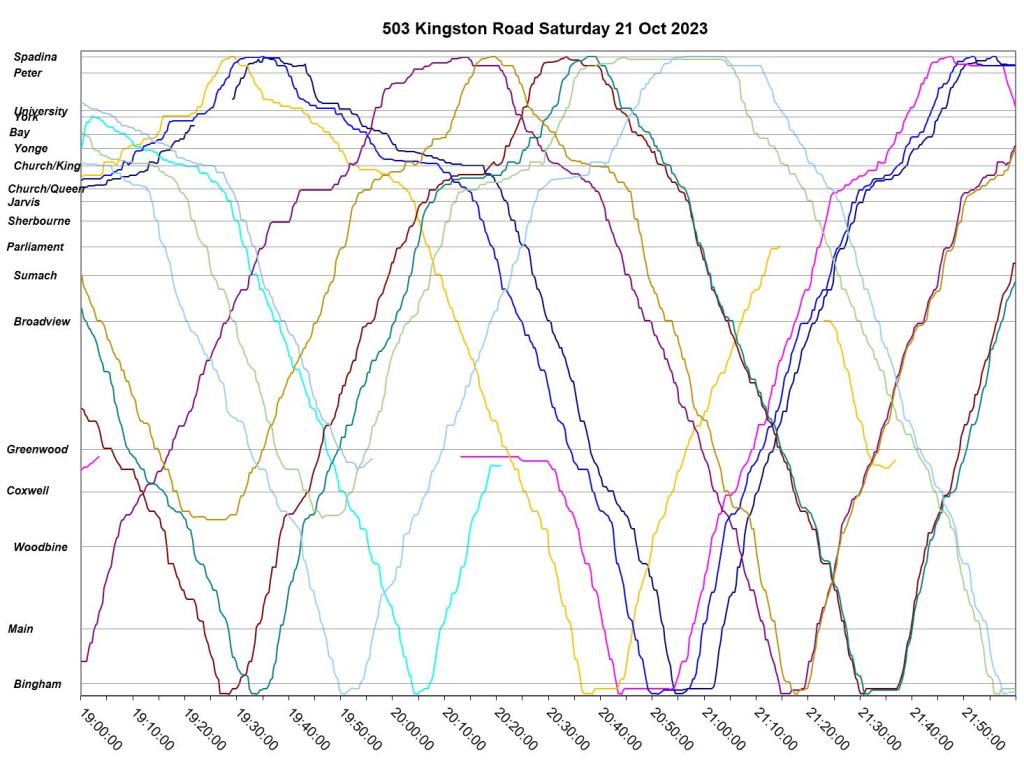
Two Different Saturdays
In the Summary section above, there are charts for Saturday travel times showing delays primarily eastbound, but also westbound, on October 21 and 28. Although these appear similar in aggregate, the underlying problem was quite different in these cases. The charts are repeated here for easy reference.
The congestion eastbound on King on Saturday October 21 (green line in the charts above) in the early evening was general through downtown and much worse eastbound stretching from Peter to Church. The level of congestion was much less westbound and was confined mainly to Church Street. On this date, cars were still diverting around the sinkhole area.
From 1pm onward, the congestion southbound on Church from Queen to King is evident, although it varies over the day (the slope of the line is more horizontal when cars move slowly). By early evening, eastbound congestion stretches from west of University to Church Street, and at the same time service is becoming much more bunched.
The congestion mostly disappears by 10pm, but the service is badly bunched with a travelling gap leaving downtown eastbound after 6pm, echoing back and forth on the route until after midnight.
I will turn to headway problems in Part III of the article.
[In these charts, each line represents one streetcar moving back and forth across the route. Bingham Loop is at the bottom, and Spadina at the top. Westbound cars travel upward and to the right, while eastbound cars travel downward. The speed of a car is indicated by the slope of the line. The more horizontal the line, the slower the car. Gaps and bunching can be seen by the horizontal spacing between lines (cars). Short turns are evident when a line does not reach all the way to a terminus. For example, two cars short turn at Woodbine Loop between 3 and 4pm.]


On Saturday October 28 (blue line in the charts above), many eastbound cars were delayed in the late afternoon, but the diversion was not in effect. The problem was almost entirely due to backlogs of traffic at University Avenue. This affected eastbound trips more than westbound, although some effect is evident in the individual date points.
Looking at the tracking data, we can see that service runs fairly normally with only a few short turns until about 3:30pm when all service is held in the core area (this effect spills between charts at 4pm). Even after service moves off, there is congestion around University Avenue in both directions until about 5:30pm. Several cars are short turned at Church Street.
Unlike the situation on October 21, fairly normal service resumed after 7pm.


This is an example of how data may appear to tell the same story at an aggregate level, but reveal different problems when examined more closely.

Steve, I happened to be on Church street frequently during those weeks it was laughable unless you were in a transit vehicle. At no time did I see a TTC supervisor at any of the intersections nor were there any police or special constables directing traffic.
Also why did the city allow parking on Church between King and Queen, surely no parking/stopping/standing should have been enforced.
Cheers, John
LikeLiked by 1 person
Toronto Star: Osgoode Hall Trees Growing Back
There is still time to save the historic Osgoode land and fence. Why don’t we move the new station to the northwest corner of the intersection since construction has not yet begun on Osgoode Hall grounds? Where are all the protesters? Why nobody cares?
Steve: Many people care, but Metrolinx behaves like a gorilla that always gets its way. The option of the northwest corner has already been studied, and it has two problems. First, it would require the relocation of Campbell House to another site as that building would conflict with the excavation. Second, a west side entrance would be too close to the secondary exit at Simcoe Street for the required spacing between exits needed to meet the fire code for the new station.
LikeLike