This is the second part of my review of service quality before and after the substitution of buses for streetcars on 512 St. Clair in September 2023. Part I deals mainly with bus operations in September.
Until May 8, streetcars operated between St. Clair Station and Gunn’s Loop over the full route. Work on the GO bridge west of Caledonia was expected to start in May, and so on May 8 the streetcars were cut back to Earlscourt Loop and the 47A Lansdowne to St. Clair bus service was extended west to Gunn’s Loop.
The work did not occur as expected, and in response to problems with and complaints about service provided by the 47A, the streetcars resumed operation to Gunn’s Loop, but with no added running time, effective on July 4. That condition remained in effect until September 3 when buses took over the full 512 St. Clair route, and the 47A Lansdowne returned to its normal terminus at Earlscourt Loop.
The TTC has a lot to answer for here with the combined effect of service cuts and erratic operation of the service that remained while the line operated with streetcars. Buses look better by comparison because the streetcars, even with their dedicated lane, were so unreliable.
This was compounded by the effect of the long-running bus substitution on travel times discussed in Part I of this series, and by the inadequate preparation for transit priority as of day one of the bus replacement.
Scheduled Service
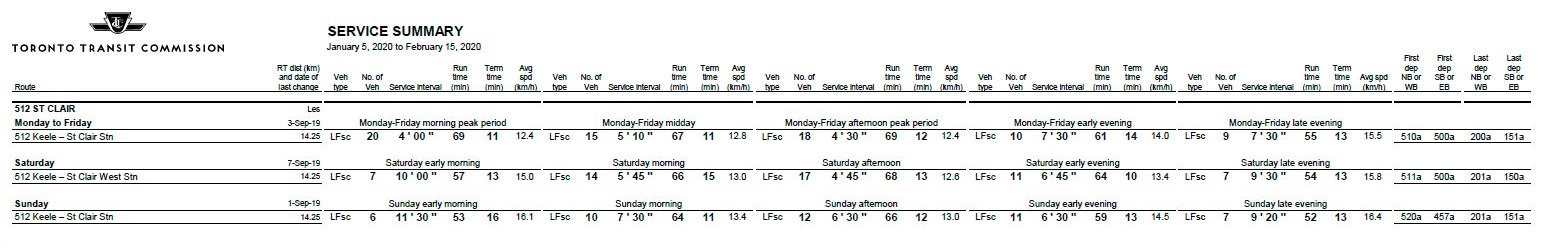
Comparison of January 2020 to May 2023
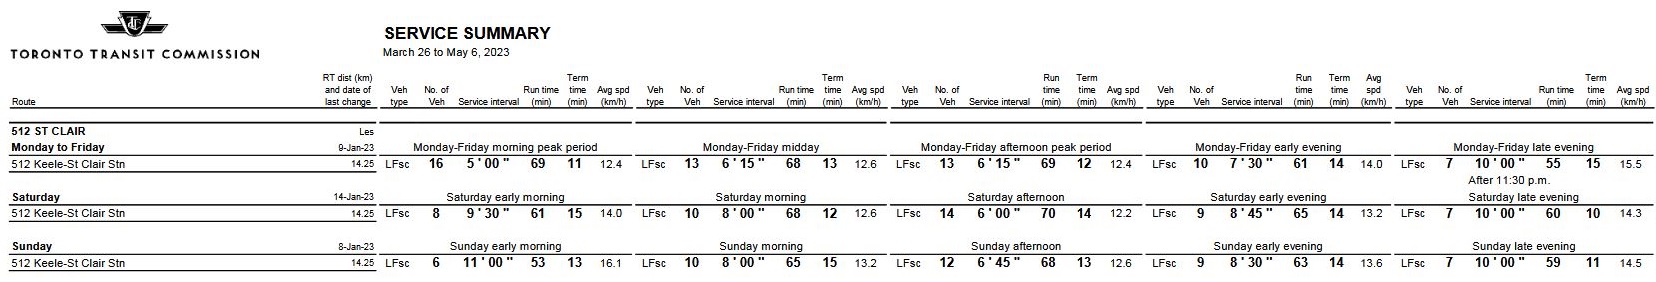
Pre-pandemic, the service on 512 St. Clair was much better than it was by mid-2023. Unlike the bus network where TTC has been re-establishing service, the 512 streetcar continues to operate well below pre-pandemic levels. The worst comparison is the AM peak where service in 2023 is only 50% of the 2020 level.
As service becomes less frequent, any unevenness in normal operations is magnified. Practices that might be a minor inconvenience with headway variations turn into major impediments to use of transit service.
| Weekday Period | Jan 2020 M-F | May 2023 M-F | Weekend Period | Jan 2020 Sat | May 2023 Sat | Jan 2020 Sun | May 2023 Sun |
|---|---|---|---|---|---|---|---|
| AM Peak | 4’00” | 8’00” | Early AM | 10’00” | 10’00” | 11’30” | 10’00” |
| Midday | 5’10” | 8’00” | Late AM | 5’45” | 8’00” | 7’30” | 9’00” |
| PM Peak | 4’30” | 8’00” | Afternoon | 4’45” | 7’00” | 6’30” | 8’00” |
| Early Eve | 7’30” | 8’00” | Early Eve | 6’45” | 8’30” | 6’30” | 9’00” |
| Late Eve | 7’30” | 10’00” | Late Eve | 9’30” | 10’00” | 9’20” | 10’00” |
January 2020 Service Summary
January to May 8, 2022:
By January 2022, weekday, especially peak, service was less frequent during many periods.

May 9 to June 19, 2022:
- Weekday peak and midday service improved from 6’15” to 5’00”.
- Weekday evening service improved from 8’15” to 7’30”.

June 19 to September 3, 2022:
- Summer schedule change.
- Weekday peak and midday service cut from 5’00” to 6’45”.
- Weekday early service cut from 7’30” to 8’15”.

September 4, 2022 to January 7, 2023:
- Fall schedule restore weekday service to May 2022 levels.
- Weekend service improved during most periods.

January 8 to May 6, 2023:
- Service cut during many periods especially on weekends.
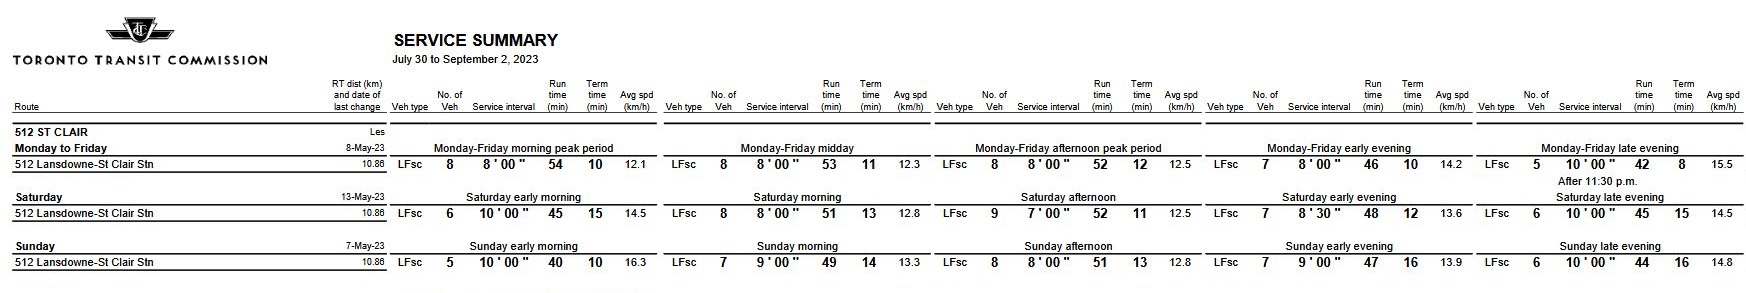
May 7 to September 2, 2023:
- Service cut further during many periods.
- Western terminus shifted to Lansdowne for construction.
From September 3, 2023:
The bus service is scheduled at a level far more frequent than the streetcar service in recognition of the difference in vehicle size. However, this is relative to the streetcar service operating in mid-2023, not the more frequent service of earlier years.

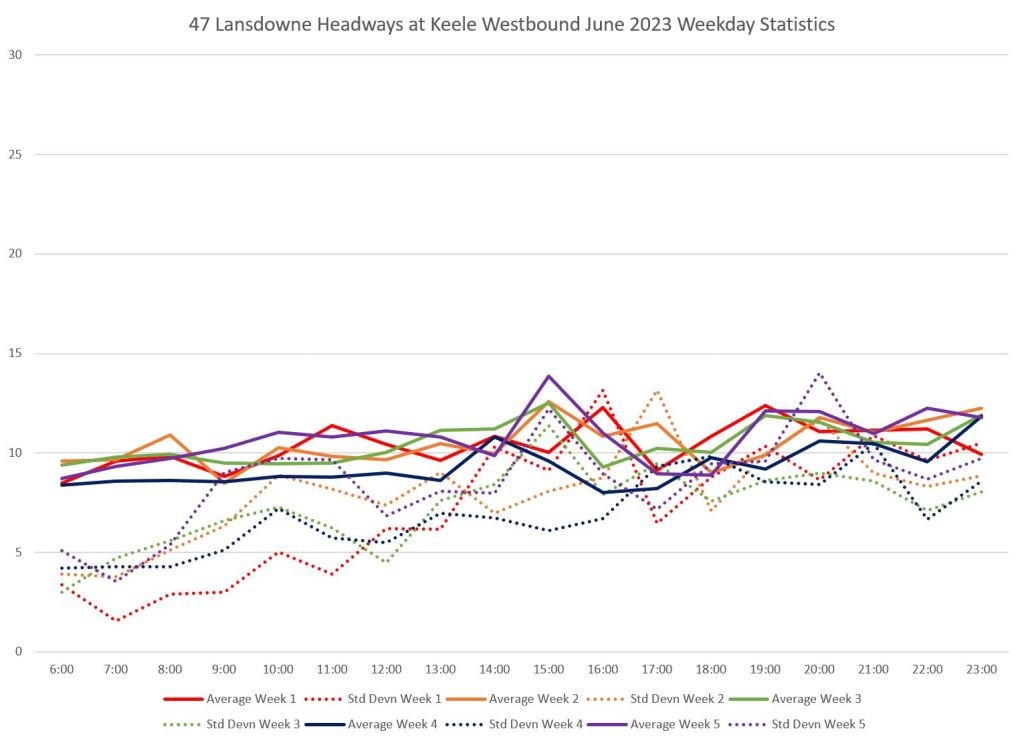
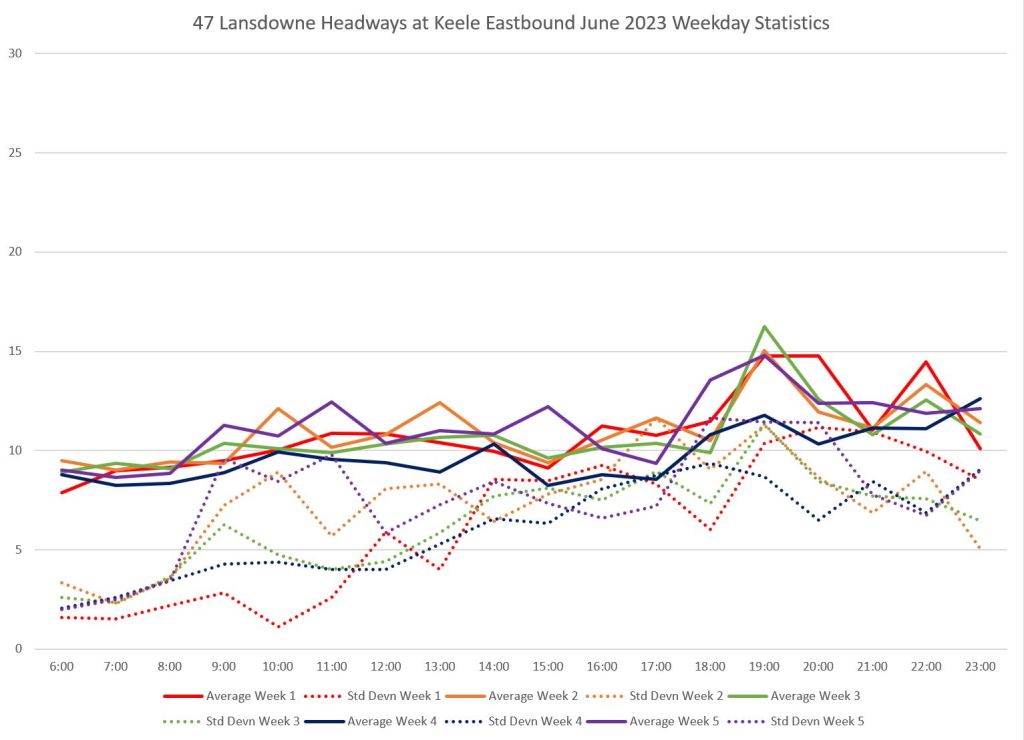
The 47 Lansdowne Bus Replacement
The original scheme for the west end of 512 St. Clair was to extend the 47 Lansdowne service branch that normally ends northbound at St. Clair west to Gunn’s Loop. This was not a success by any measure, and a major issue was the difficulty of operating the buses in mixed traffic. That should have given warning of what would come with a full route replacement.
Here are the average headways and standard deviations for Lansdowne bus service both ways at Keele Street in May and June, 2023.
In both cases, the service begins roughly as scheduled in the early AM peak, but quickly disintegrates with the SD values climbing close to the averages. This indicates that for much of the day, the buses ran infrequently in pairs or worse. This problem was sustained over two months, and in response the TTC extended the streetcar service back to Gunn’s Loop, but without changing the schedule that was based on a Lansdowne terminus. We will see the results of that tactic later in the article.
(Note that week 1 of May (red) shows a zero headway because the Lansdowne extension did not begin until week 2.)


Average Headways & Reliability
In this section, there are two sets of charts for three locations:
- Westbound from Yonge: Service from the eastern terminal of the route.
- Westbound from Bathurst: Service leaving St. Clair West Station outbound.
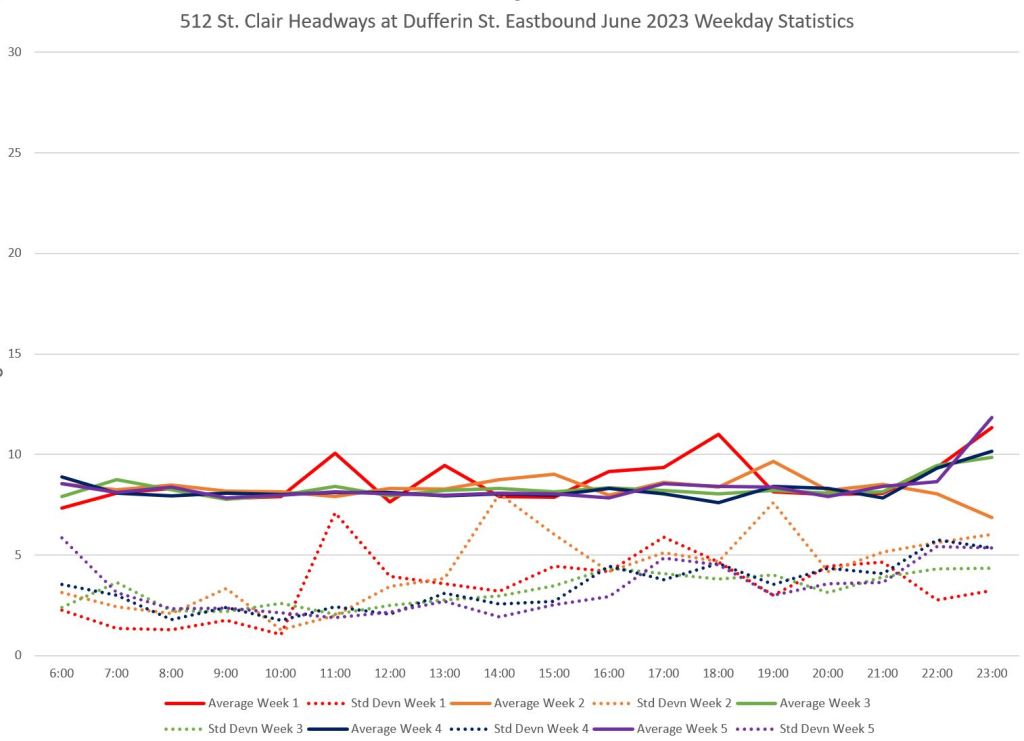
- Eastbound from Dufferin: Due to tracking data problems during the period with service scheduled to Lansdowne, but operated to Keele, I have used Dufferin to analyze eastbound service.
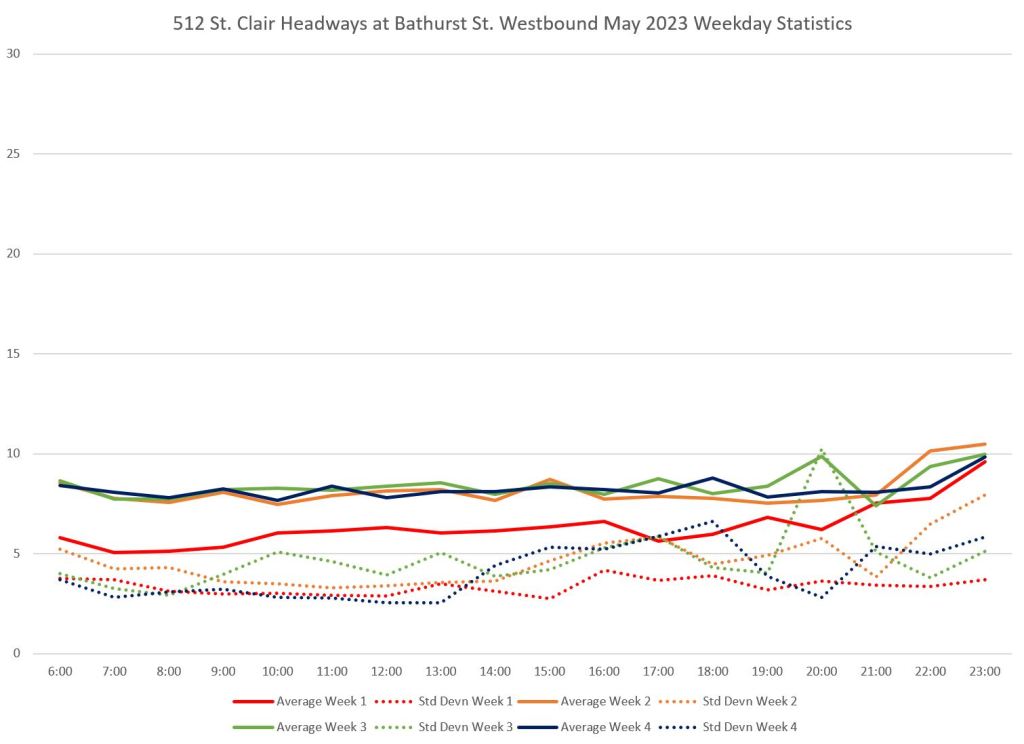
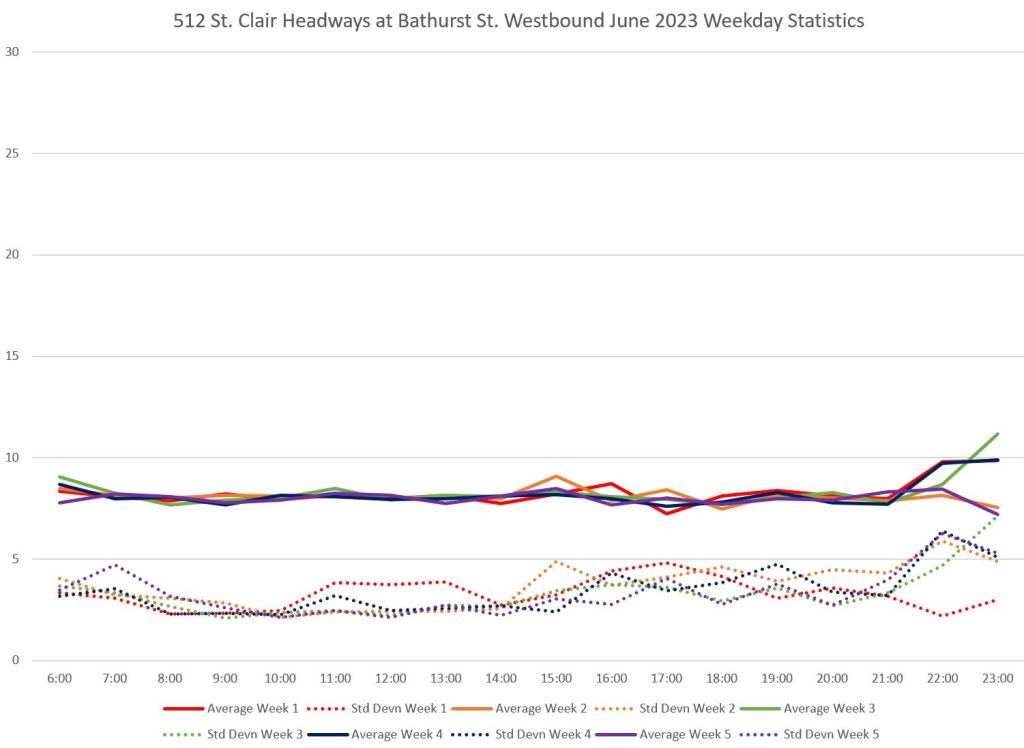
The first set show by month, week and hour the actual average headway and the standard deviation of these values, a measure of how irregular the individual values are. When the SD is low, most headways are within a few minutes of the average. As the SD rises, the band holding most headway values gets wider and the service is correspondingly less reliable. The closer the SD is to the average, the more the service is operating in bunches of two or more vehicles.
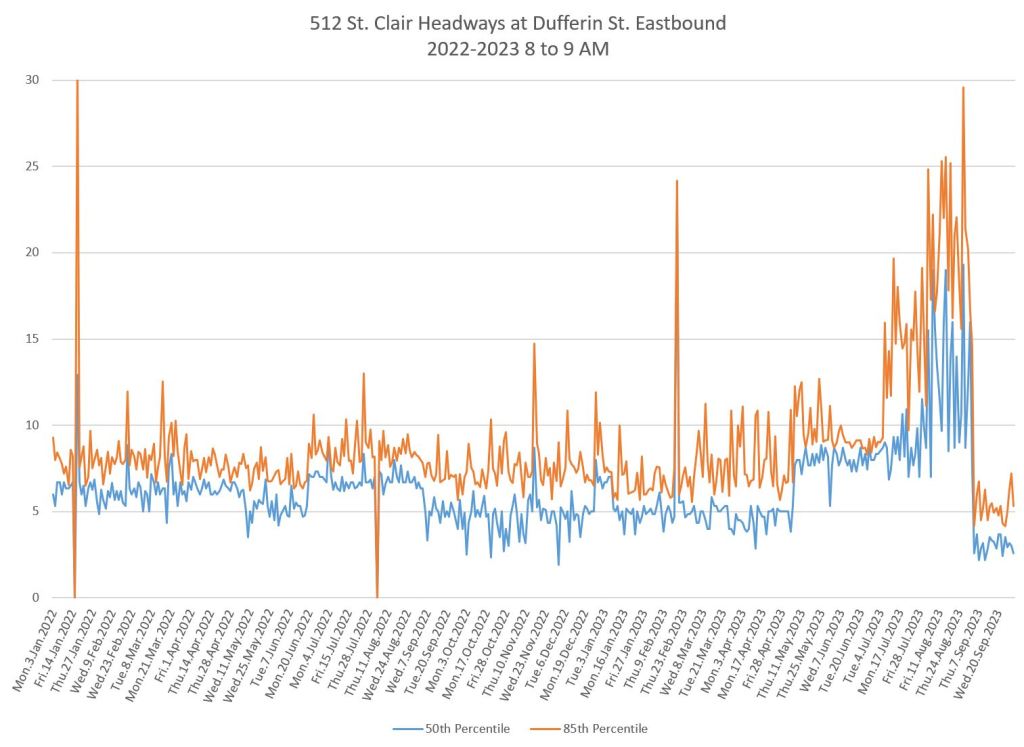
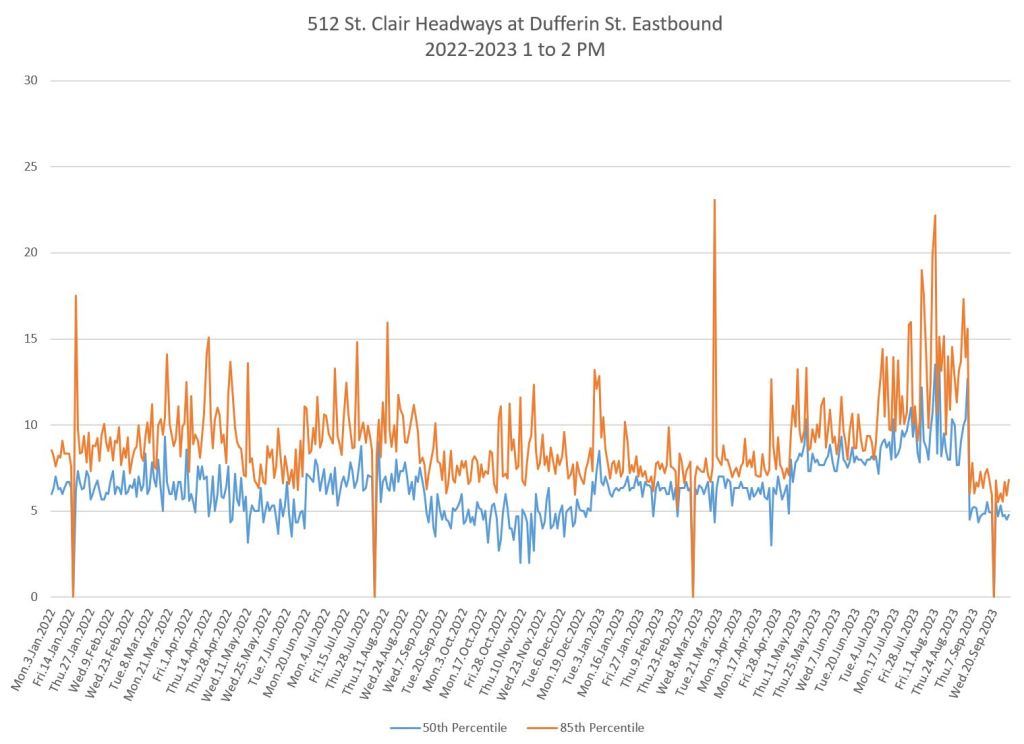
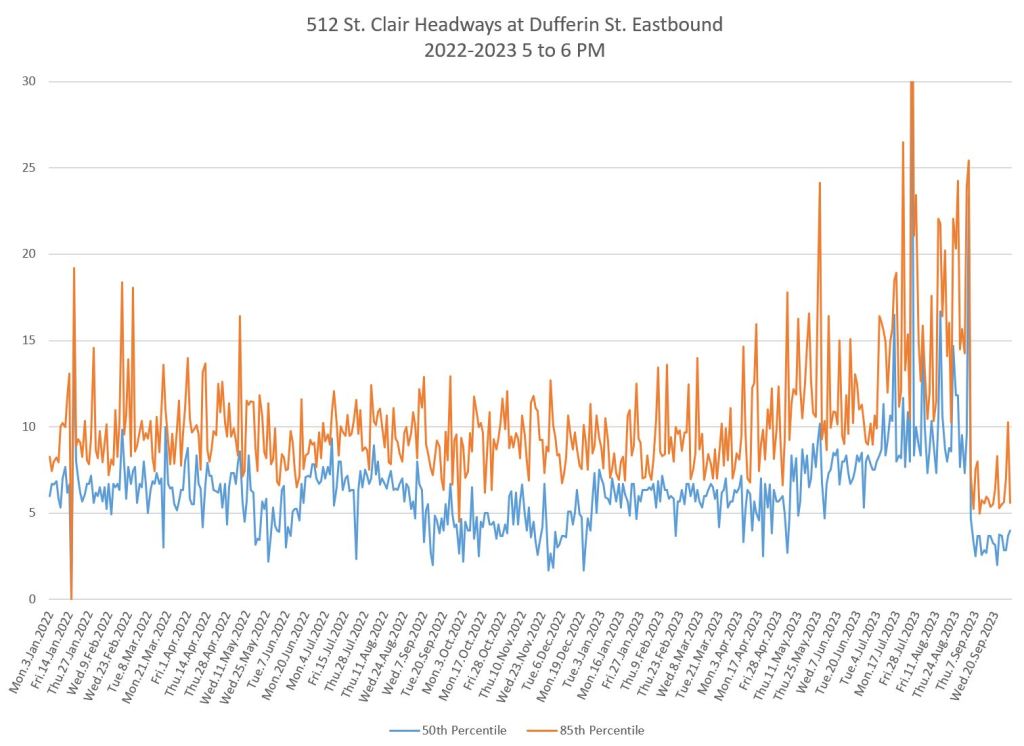
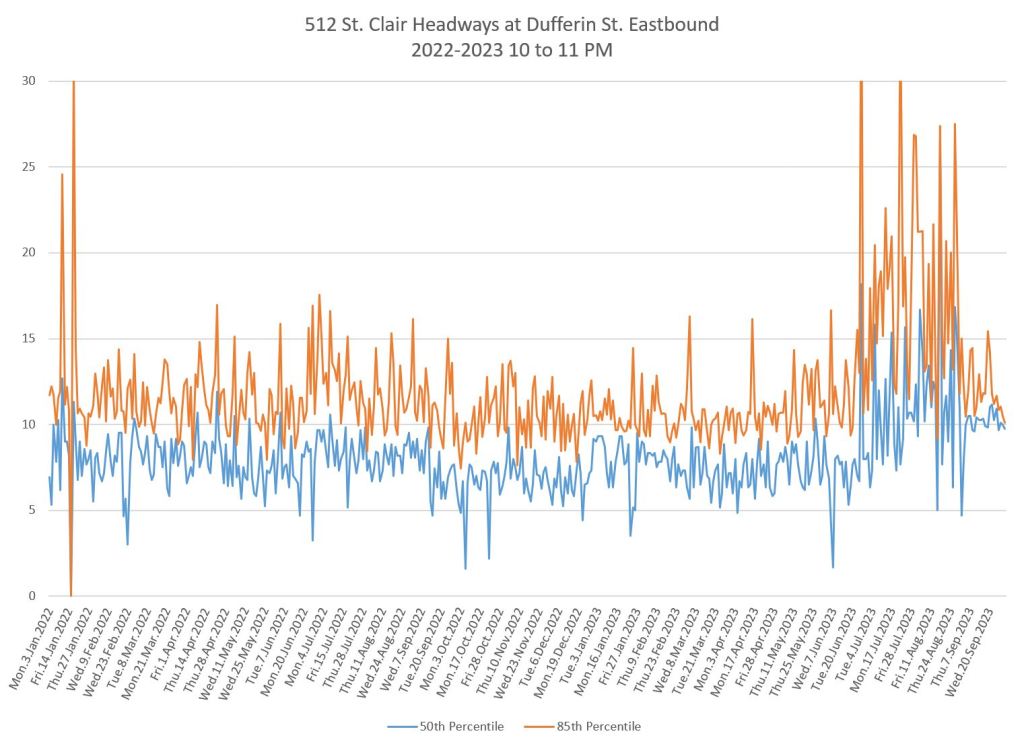
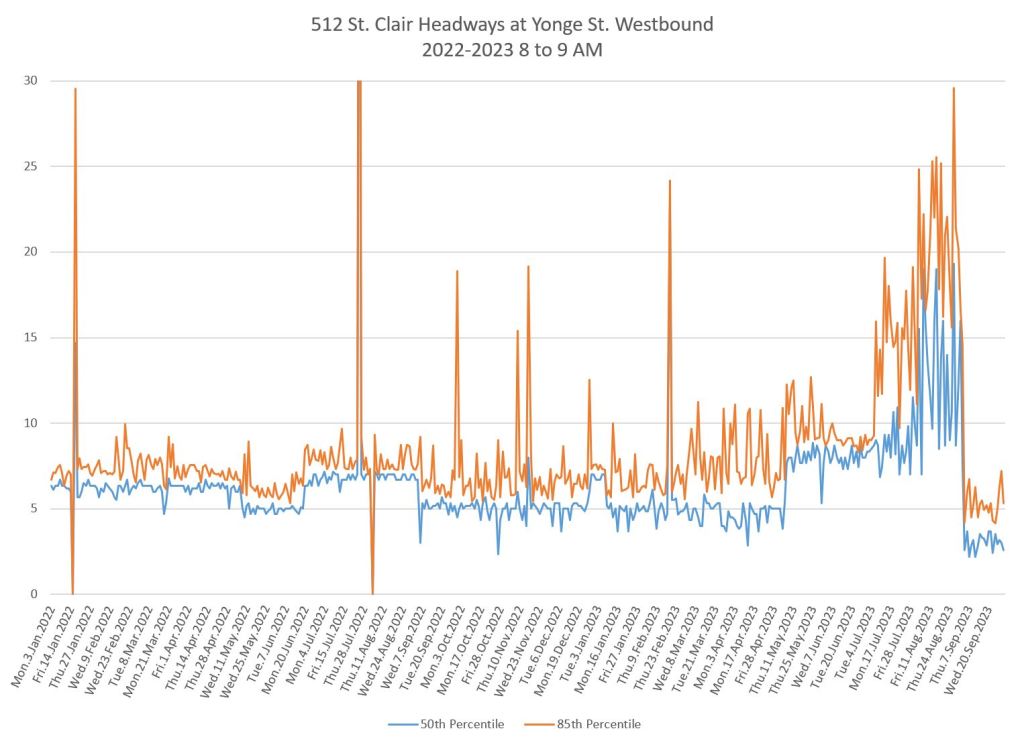
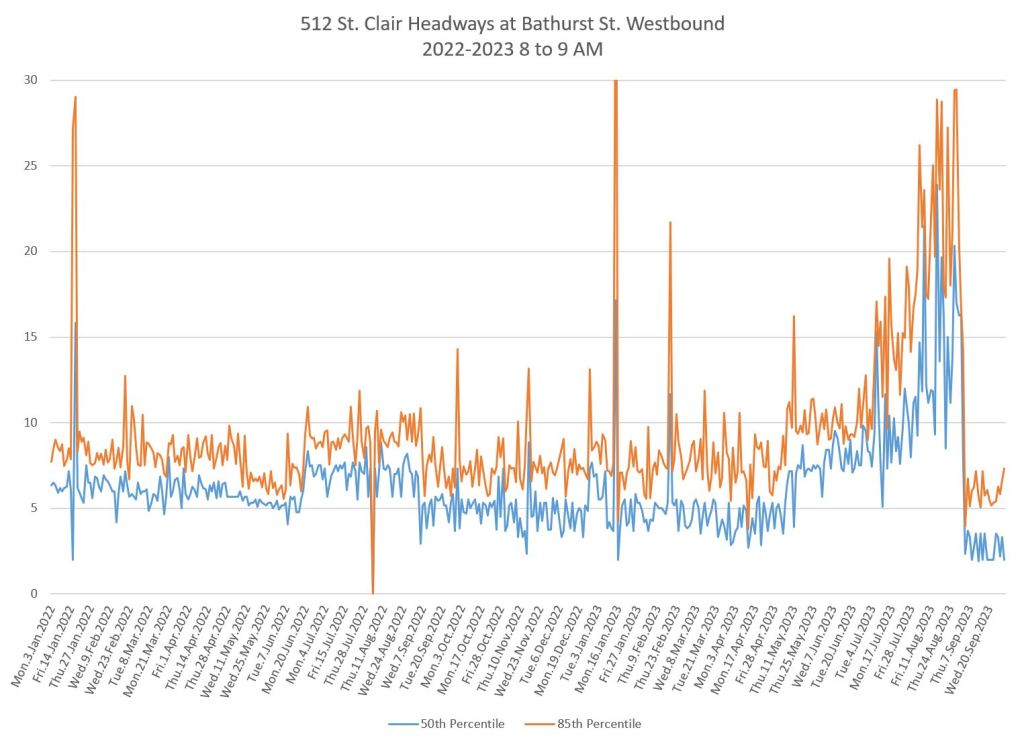
The second set will be familiar to readers who followed the past analysis of the King Street transit pilot. Each chart contains data for one hour within all weekdays from January 2022 to September 2023.
- The blue line follows the median values with half of the service more frequent, half less.
- The orange line shows the 85th percentile which shows all but the worst of the values. When this line is close to the median (blue) line, the service is reliable with most headways in a narrow band. When the two lines are further apart, more gaps (and corresponding bunching) occur.
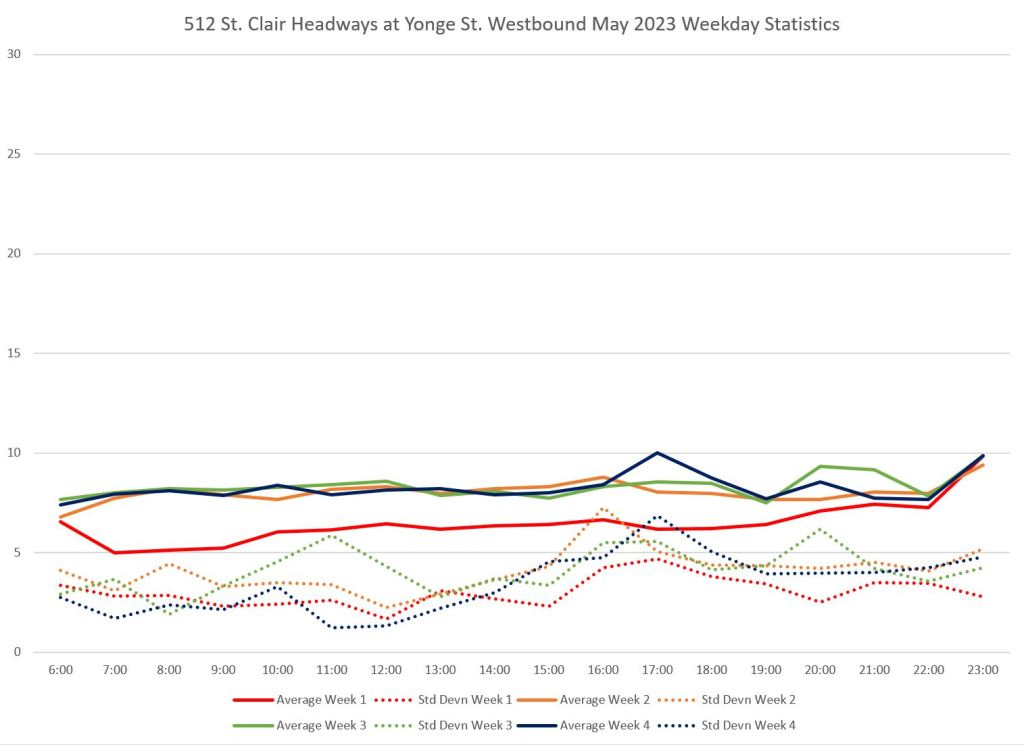
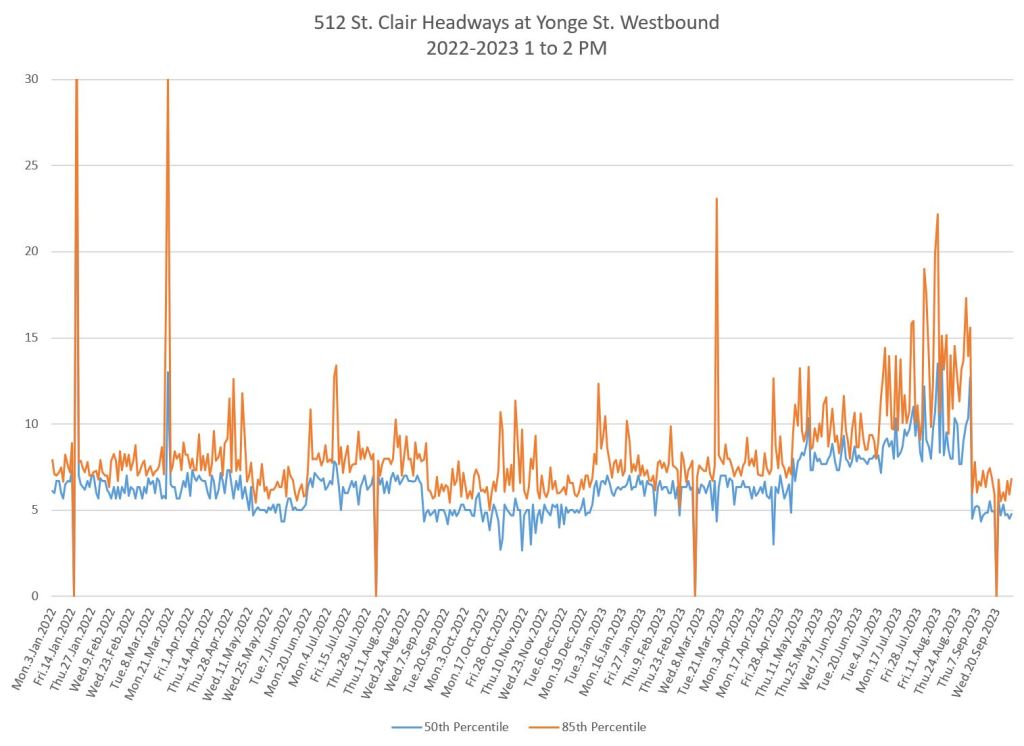
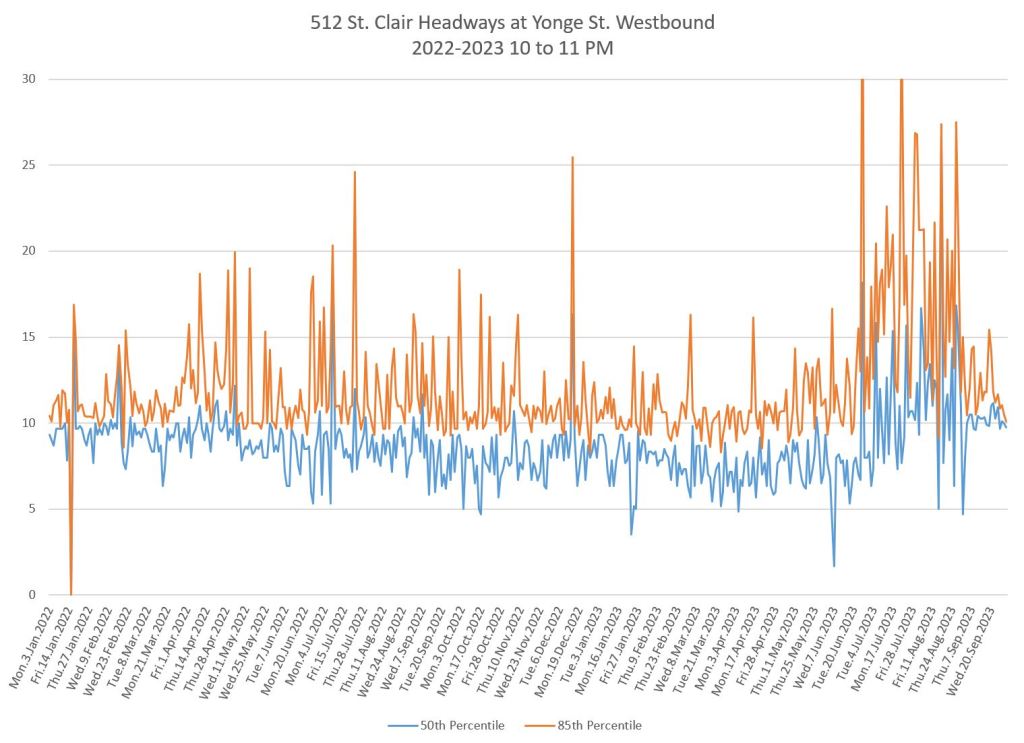
Westbound From Yonge
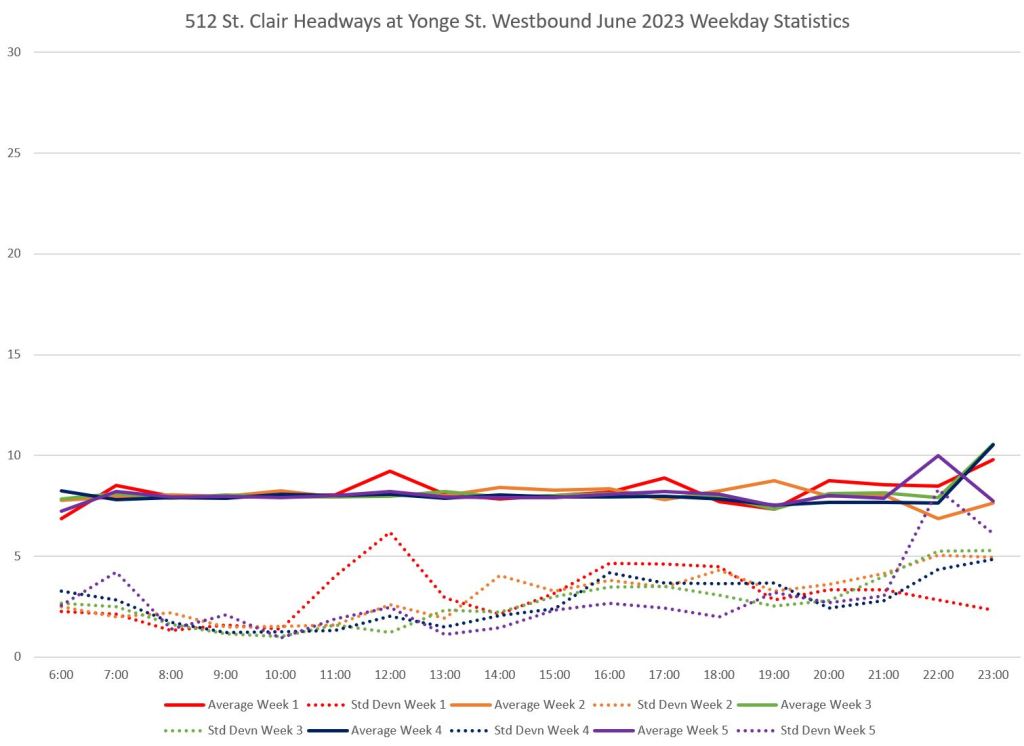
The average headways in May through June are consistent with the shift to summer headways evident after week 1 of May (lower solid red line in the chart). However, standard deviations of four minutes or greater are common indicating the range of actual headways leaving the eastern terminal. This is on the edge of the TTC’s service standards, and even with that, headways will routinely go beyond 10 minutes.
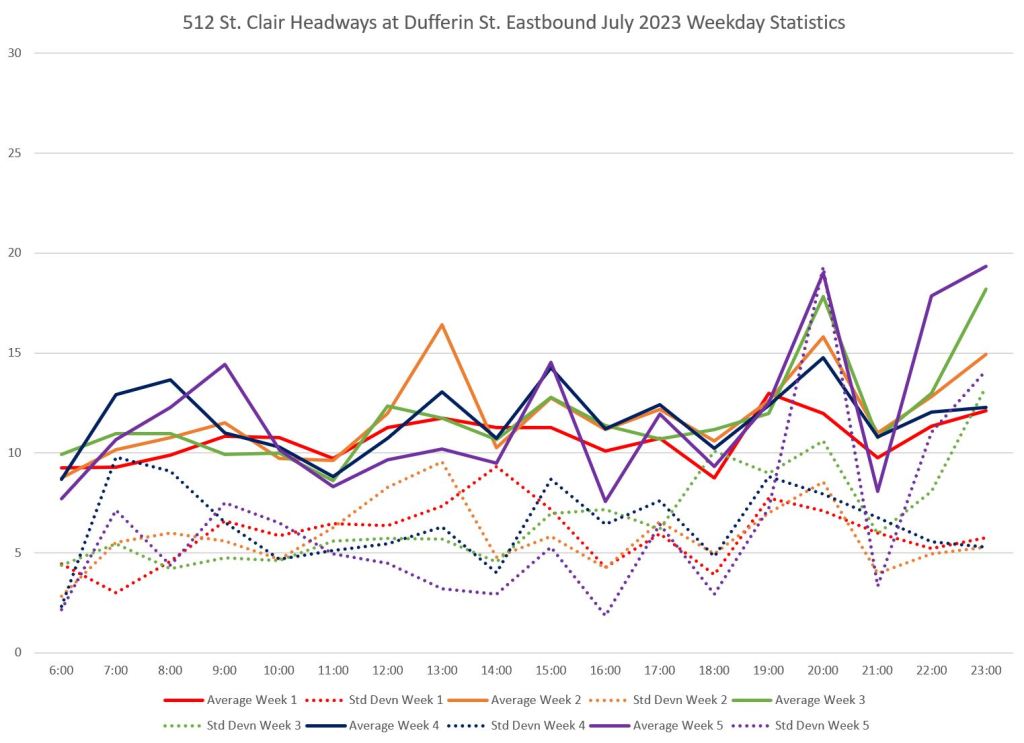
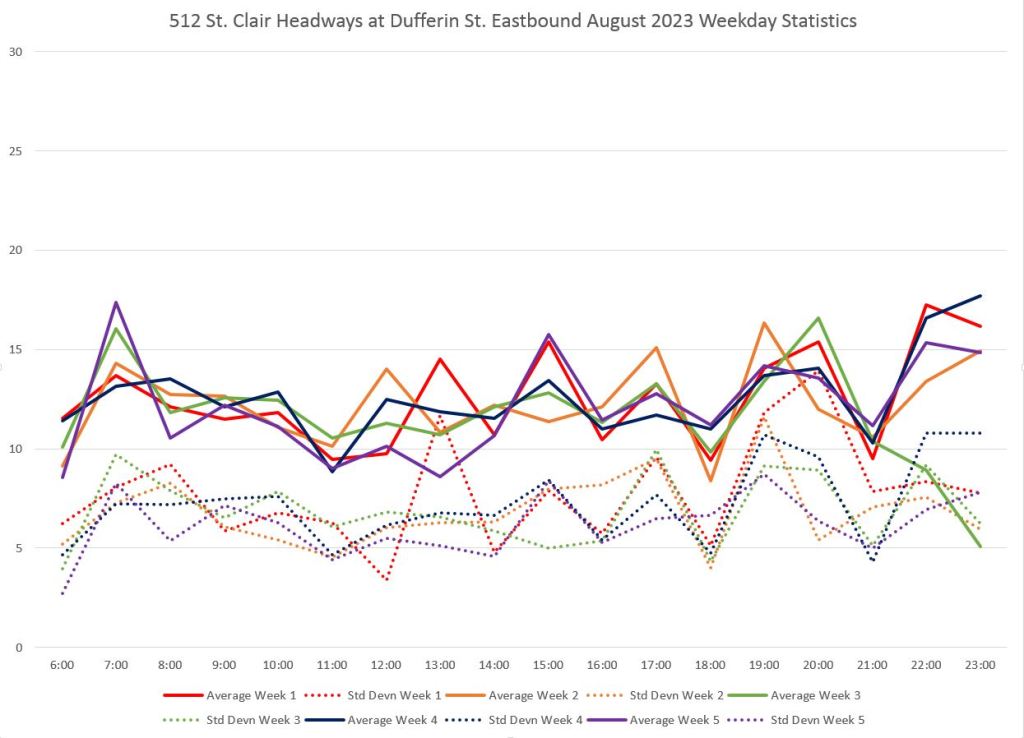
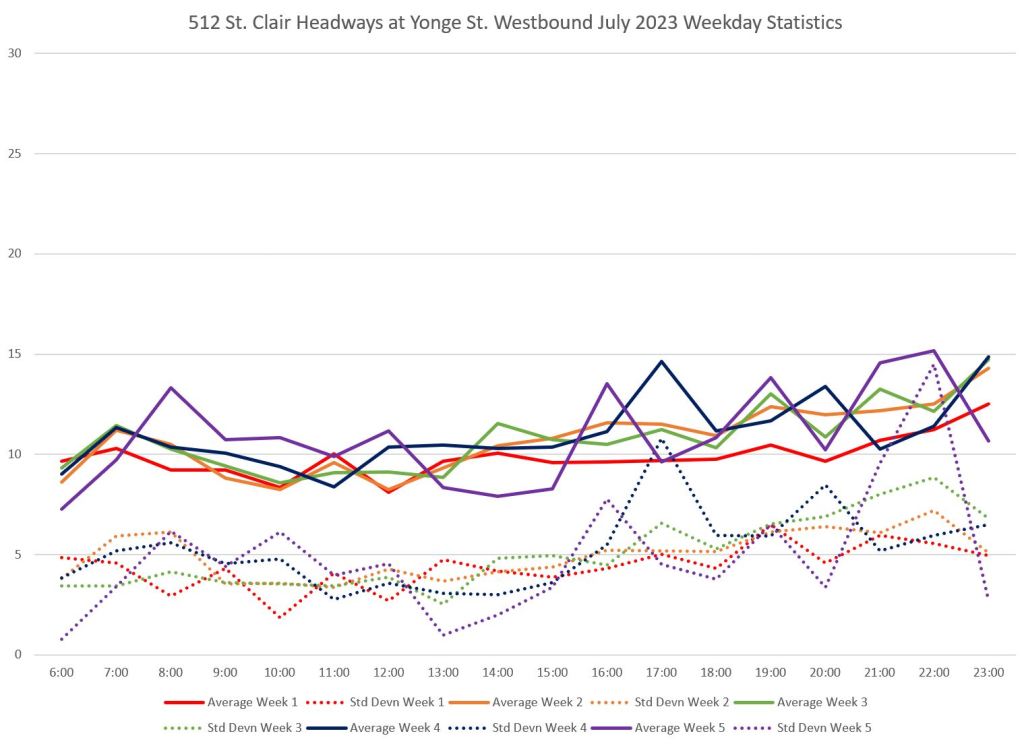
In July and August, the TTC attempted to extend a route whose schedule was designed to operate to Lansdowne through to Gunn’s Loop (west of Keele). The effect of stretching the service is quite evident in the charts for these months where the average headway was 10 minutes or worse versus the scheduled level of 8 minutes. Moreover, the SD values were regularly over 5 minutes showing that there was a wide swing in actual service versus the average or schedule.


Over the two-year view, the deterioration in service quality is quite evident.
- The blue line (median) more or less tracks the scheduled service level until summer 2023.
- The yellow line (85th percentile) stays fairly close to the median with few exceptions during the AM peak and early afternoon (8am and 1pm charts). However, later in the day, the 85th percentile is regularly peaking well above the median showing that reliable service is less likely even into the early and late evening.
- The 85th percentile is particularly bad in July and August with values of 20 minutes or more.
- In September, the TTC flooded the route with bus service, and the headways drop back to a more normal level. Note that this refers to service frequency, not speed which was discussed in part I of this series.


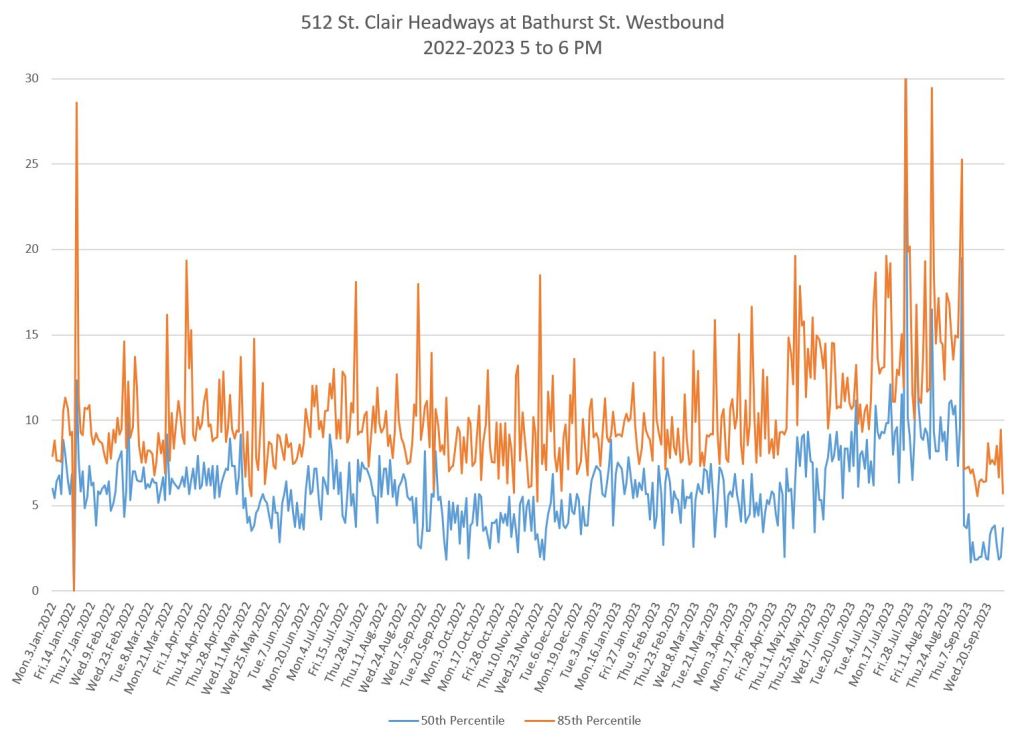
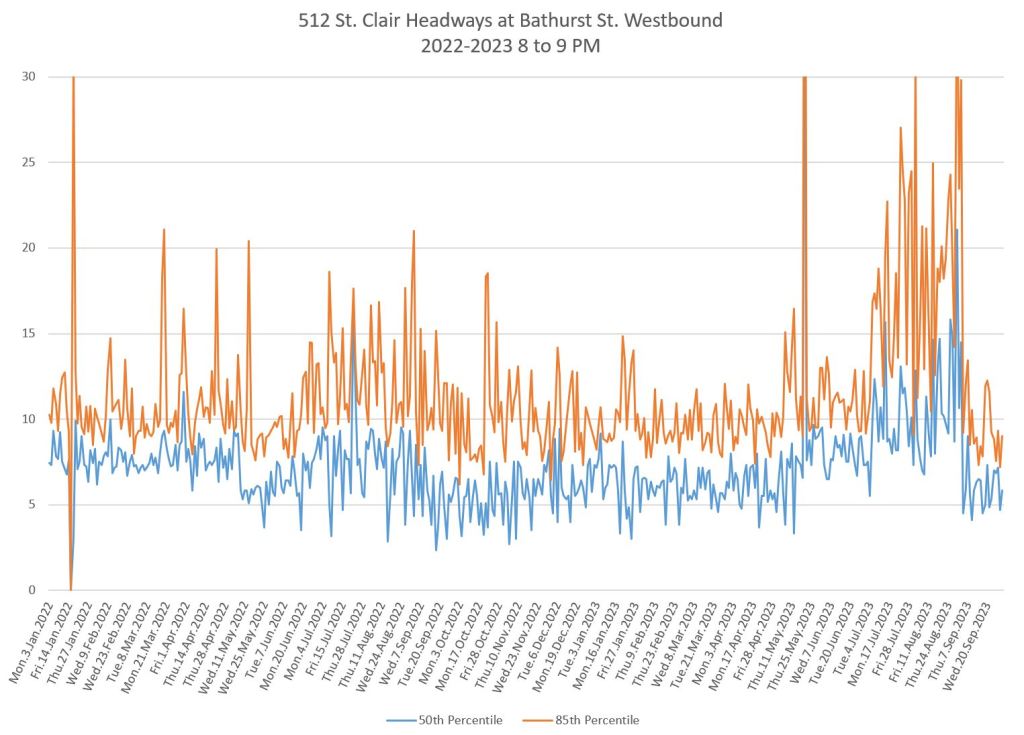
Westbound From Bathurst
The service westbound at Bathurst is similar to what we see above at Yonge, but with an important difference that the SD values are higher at Bathurst indicating more bunching with wider gaps. This is typical of all routes where bunches close up and gaps widen as service travels along the route. Note that this is with streetcars on their own right-of-way and cannot be written off as an inevitable result of “congestion”. Particularly troubling is that service in the evenings is particularly bad.


The median and 85th percentile lines show the same pattern at Bathurst as they do at Yonge westbound. Of particular note is the spread for the bus values in September showing that headways can vary considerably even in the evenings when one would expect them to be more reliable. The only bright side is that the service is much better than the chaotic streetcar service provided in July and August.
This is a case where “buses are better” because of the complete hash TTC made of streetcar service, and then replaced it with a much larger fleet of buses.


Eastbound From Dufferin
Service eastbound at Dufferin shows the same patterns we saw westbound above, and again illustrates that bunching is a severe problem with high standard deviation values particularly in July and August. The service averaged above 10 minutes almost all of the time when the scheduled value was 8 minutes. Actual gaps were even wider, and the high SD values show that a range up to at least 15 minutes, or twice the scheduled headway, was common. This is reflected in the 85th percentile figures in the second set of charts.