
In a recent article, I reviewed the operation of the 41 Keele bus and compared its behaviour in April 2018 with the service in September 2019 running an “improved” schedule. The results were not exactly impressive and the route continued to have quite irregular service, particularly when one looks at the middle of the route rather than at the terminals where the TTC actually measures it.
For the September 2019 analysis, my ability to plot service behaviour at and near terminals was limited by the nature of the data provided by the new Vision tracking system. The data were stop based, rather than a continuous stream showing vehicle movements along the route. (The contrast to the old monitoring system, CIS, was explored in a separate detailed article.) The TTC is now providing Vision data in continuous location format, and this greatly improves the resolution of vehicle locations for the October 2019 analysis.
The data may be better, but I cannot say the same for the quality of service. Although the TTC implemented longer scheduled travel and recovery times (make up time at terminals to compensate for variations in congestion enroute) in September, the reliability of service continues to be poor compounding the longer scheduled waits between buses.
Service reliability improvements – the program for continuous monitoring and improvement to schedules to better match observed operating conditions …
This is a buzz phrase seen routinely through 2019 in service change announcements, but it almost inevitably means stretching the existing buses on a route over a longer round trip time while making headways (the time between buses) longer to compensate rather than adding more vehicles to a route. In some cases, there were routes that simply did not have enough time in their schedule for actual conditions, but this tactic has become a “magic bullet” that is supposed to fix service quality.
But that bullet is made of tin, not silver.
Through all of the charts in this article, it is important to remember that the TTC’s Service Standard, measured at terminals, is that all service should be within a six-minute window of “on time” to the schedule. However, the typical pattern is for over 50% of all trips to show headways ranging well over 6 minutes. The target level of service reliability simply cannot be met. This is with the new, “improved” schedules.
The missing piece in TTC service is the recognition that left to their own devices, vehicles (and their drivers) will not run on time or on a reliable headway. The situation is made even worse by a policy of limiting short turns while doing little or nothing to break up bunches of vehicles. TTC management pats itself on the back because the quality metrics it reports every month look good, but they mask service that can be appallingly bad.
This is not exactly a new situation at the TTC. I remember nearly 40 years ago when the then head of Planning was reported to be shopping around for awards the TTC could win, the better to buff the image of management. This was the same person who introduced “tuning service to meet demand”, a phrase that sounds good to the bean counters, but actually means packing as many riders on buses and running as little service as possible. Managing the service was not part of the program.
A major problem with TTC statistics is that they are reported on an average basis consolidating data from several days and times of the day. This masks behaviour at the fine-grained level riders experience. They do not wait for the “average” bus, but for the next one that shows up. Telling them that on average they have acceptable service is cold comfort waiting in a gap of over 20 minutes for two buses to appear. That might be “every 10 minutes” on average, but that is not what they see. The same is true of vehicle loading with uneven headways leading to uneven crowds, and the bus that arrives in a gap is often full, assuming one can even get on.
The first request of a deputation from Keele bus riders at the September TTC Board meeting was that 41 Keele be made part of the “ten minute network”. This might improve service slightly, but if the buses on the route are not much better managed, that “ten minute” headway will include many much wider gaps and pairs of buses running together.
Chart Formats
Charts in this section appear in formats that will be familiar to readers of previous articles. For those who are not, a quick introduction. This should be read in conjunction with one of the MonthHeadways pdfs linked below.
- Pages 1-5 show the headway data for weekdays broken down by weeks of the month. Each dot is one bus, and the colours are keyed to days of the week. The trend lines thread among the dates showing the overall drift of values through the day, but not the moment by moment changes. Where these lines lie on top of each other, this shows that even though individual data points may vary, the overall character is the same for each day. Note that even when the data points are widely scattered, the trend line can be fairly flat among them when the hour-bby-hour character of the data does not change.
- Pages 6-7 are in the same format, but show Saturdays and Sundays/Holidays each as a group.
- Page 8 shows the average and standard deviation (SD) values for weekday data for the entire month. If the SD value is small, the values are closely clustered around the average and headways are fairly reliable. If the SD is large, then there is a lot of scatter in the data and service is unreliably spaced.
- Page 9 shows the average and SD values for weekdays, subdivided by week. If the SD values do not follow the same pattern for each week, this flags a situation where a short-lived problem disrupted service, as opposed to a condition that is present every week, but could be unpredictable in its effect.
- Page 10 shows the weekly data in quartiles with the centre two blocks giving the 2nd and 3rd quartiles (the middle 50% of all service) and the two tails showing the outer quartiles. Ideally, the central block should be small with most service concentrated at a common headway close to the scheduled value, and the tails should also be short indicating that even the 1st (lowest) and 4th (highest) quartile do not range widely. When the 1st quartile ranges down to the x-axis, this means that there is bunching with short headways. When the 4th quartile ranges upward, this indicates gaps in service.
- Remaining pages give weekly and weekend breakdowns.
Note that although the charts use 30 as the maximum plotted values, some data points may lie above this level and pull a trend line away from the points that are visible.
Headways at Keele Station
The screenline for these measurements is on Keele Street just north of the station. This avoids mistaking movements within the station for actual arrivals and departures.
Note that headways are wider in the peak periods than in the off-peak because there is a separate 941 Keele Express during the peak. This reduces the combined headway, although the express vehicles are of no use to riders who board or alight at local stops. Express service reliability is reviewed later in the article.
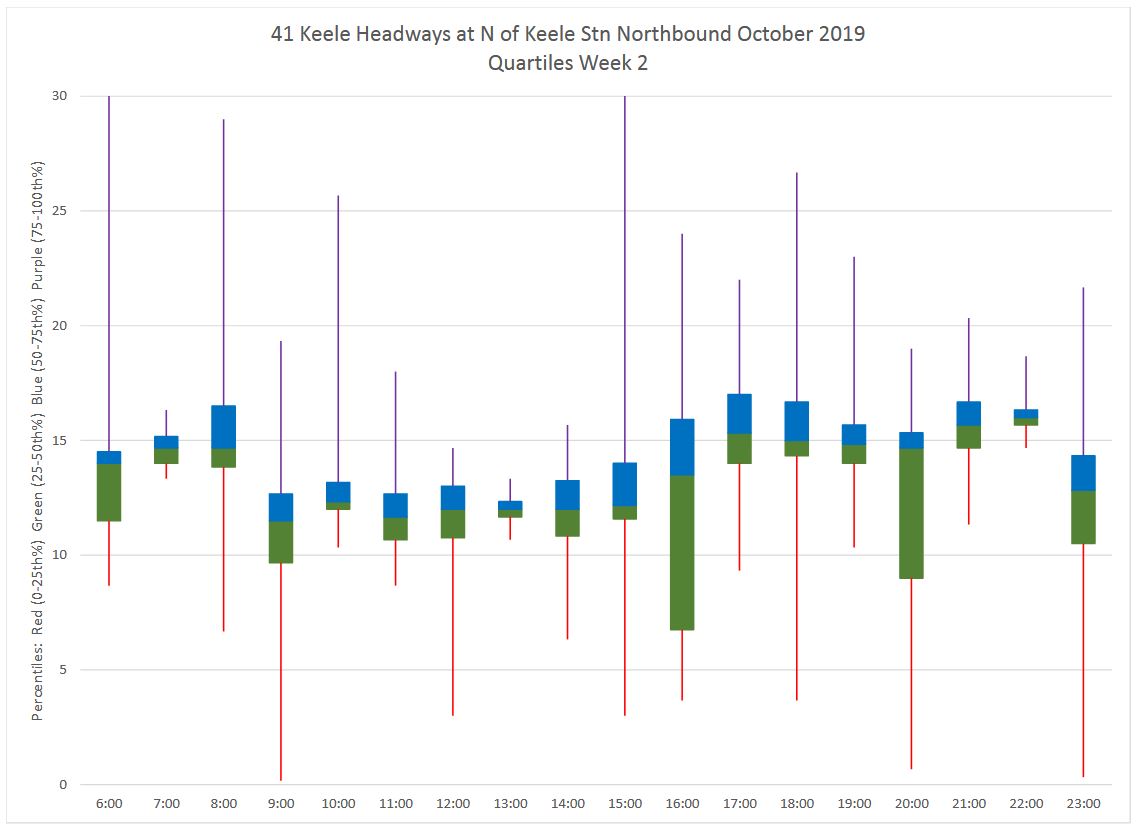
Although headways leaving Keele Station are fairly well-behaved in the morning, by afternoon and especially the peak period they are spread over a wide range of values. Some days are worse than others (there are detailed reviews of a few sample days later in the article). Weeks 2 and 4 are shown below, and they are quite different in character.


During the afternoon peak, the standard deviation for weekdays rises to about 8 minutes indicating that there is a wide variation in headway values. This is visible in the data plots for individual days. Indeed, it is only the relatively low SD values in week 2 that pull the overall number down and some weeks hit SDs of over 10 minutes on an average headway of 15 minutes. This is not “improved” service by any measure.

The overall average masks the difference between individual weeks. In the chart below, the jump in SD in the PM peak is absent for week 2 (the week before Thanksgiving) reflecting the lower degree of scatter seen in the week 2 chart above.

The problem can be seen in another way in the box-and-whisker quartile charts where the central blocks are much wider for the PM peak hours than at other times.

Finally, on weekends when one might expect better service, things really are a mess with worse bunching (headways close to zero) than in the weekday service shown above. Note that “improved” schedules were only implemented on weekdays, and weekend service operates with the schedules implemented in December 2017.


For subsequent locations, I will include fewer inline charts and leave exploration of the details to interested readers. Full chart sets are linked below.
Headways at Lawrence Northbound
The screenline is located north of Lawrence Avenue and measures headways departing from that location.
A major problem, explored in more detail later in the article, is that even when service leaves the terminal at a fairly reasonable spacing, it does not take long for the bunching to get tighter and the gaps to get wider. The charts for Lawrence northbound show a considerably worse spread of headway values than the charts for Keele Station. This is particularly visible on the box-and-whisker charts where the central quartiles spread over a wider range in the morning than in the Keele Station data.
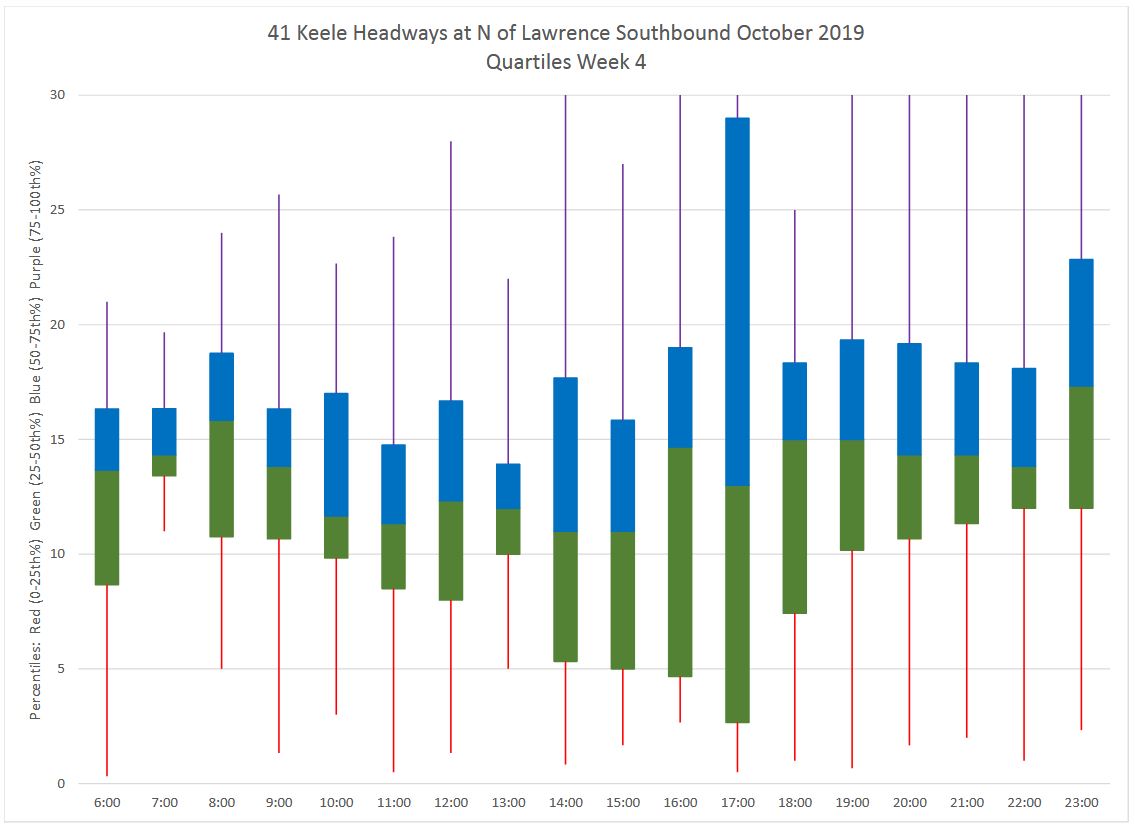
In Week 2, which was the comparatively “good” week leaving Keele Station, headways are spead over a much wider range at Lawrence during the entire day, not just from the late afternoon onward.


In the box-and-whisker diagrams, week 4 still has worse spread in the central quartiles (note especially the 18:00 hour), but the spreads in week 2 in the morning and midday are not as narrow as at Keele Station.


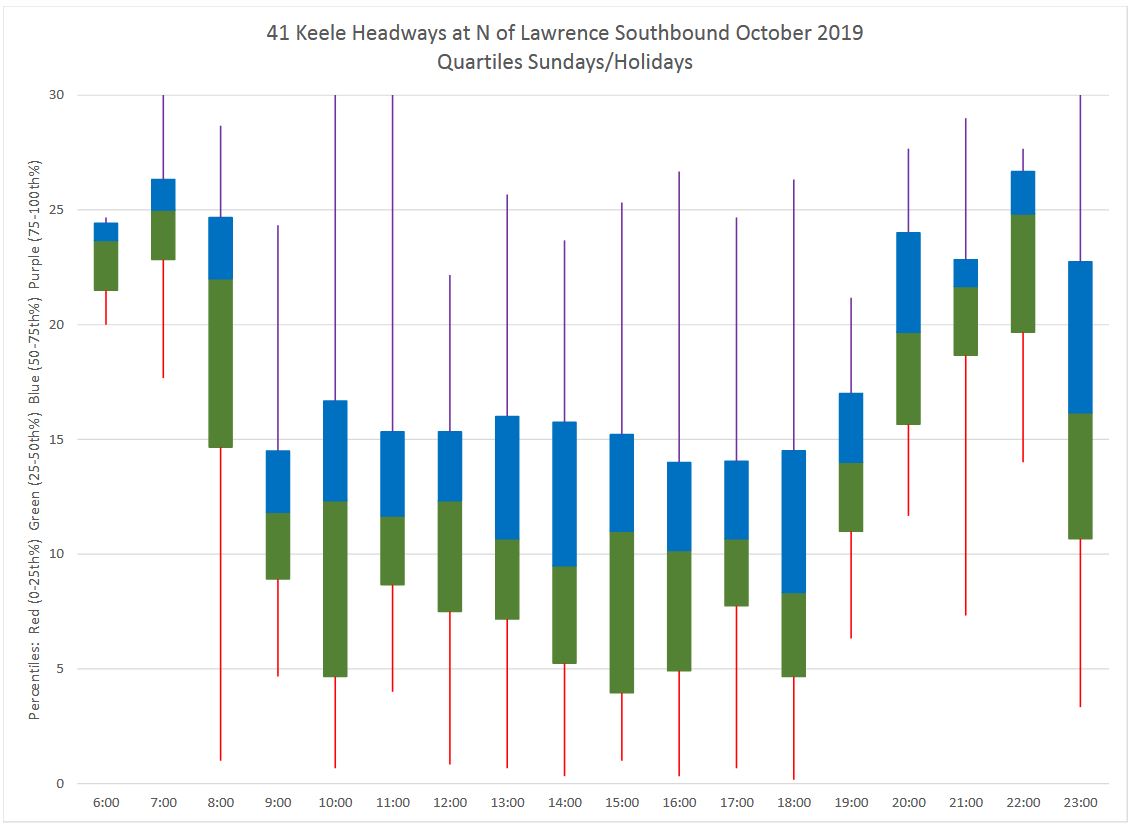
On weekends, headways are quite unpredictable with very wide ranges of values through much of the day. Even though all buses run local on weekends, actual headways have a wide range of values and many are quite short showing bunching.


Headways at Pioneer Village Station Southbound
The screenline is southeast of the station on Ian Macdonald Boulevard east of the NW Gate road. This avoids confusion of movements around the station with arrivals and departures.
Headways leaving Pioneer Village Station show a similar pattern to the one seen northbound from Keele Station. One difference here is that thanks to short turns at Finch West Station on bad days, the gaps at the north end of the route can be wider than those at the south end. This also affects the average headway values which can be wider at Pioneer Village than they are at Keele Station.

As with northbound service from Keele Station, Week 2 has lower SD values than the rest of the month, but overall the SD values are quite high during the PM peak and evening. This is reflected in the box-and-whisker charts showing the range of headways riders could encounter.


Headways at Lawrence Southbound
The screenline is north of Lawrence Avenue and measures headways arriving at that location.
As with the northbound service, any reliability that might have existed in headways southbound from Pioneer Village is lost by the time the service reaches Lawrence West.


Full chart sets in PDF format:
- 41_201910_NB_NofKeeleStn_MonthHeadways
- 41_201910_NB_NofLawrence_MonthHeadways
- 41_201910_SB_SEofPioneerVillageStn_MonthHeadways
- 41_201910_SB_NofLawrence_MonthHeadways
Travel Times Between Keele and Pioneer Village Stations
The travel times measured here are from the screenlines just outside each of the termini of 41 Keele. This means that the actual times will be slightly longer, but only by the time required to exit and enter stations on each trip. Dwell times at termini are captured in the next set of charts.
Unlike headways, the running times are much better behaved, at least on a relative basis. Here are the data for the ill-behaved week 4 whose headways above were badly scattered. The travel times northbound follow a regular pattern although they range in a band 10-15 minutes wide. Some days, in this case Thursday and Friday, have notably longer PM peak times.

Looking at the month week-by-week, the average travel times fall close together except for the height of the PM peak when weeks 1 and 5 are slightly worse. There is always going to be day-by-day and week-by-week variation in travel time, and the schedule must allow for enough of this variation to be workable on the “bad” days.

Looked as a box-and-whisker plot, the degree of variation in travel times is quite evident. The middle two quartiles fall within a 10 minute band most of the time, but both longer and shorter trips do occur among the outer two quartiles.

The same data, with a small change, are plotted below as a set of lines, and one value has been added: the 95th percentile. This chart shows the bounds of the quartiles up to 3 (50-75th percentile), but the top line is the 95% percentile, not the maximum as in the chart above.
For schedule design purposes, the TTC is now using the 95th percentile value (red) to determine running times. However, this leaves a wide band below it of trips, even at the average value (green) which will take considerably less time than a 95th percentile schedule would allow. The situation is similar on weekends and in the southbound direction.
(See full chart PDFs for these plots which are on pp 20-22 of each set.)

- 41_201910_NB_NofKeeleStn_SEofPioneerVillageStn_MonthLinks
- 41_201910_SB_SEofPioneerVillageStn_NofKeeleStn_MonthLinks
Time Spent At Terminals
The times measured here are for the round trip from the screenline outside each terminal, through the terminal including layover time, and back out to the screenline. It is a reasonable assumption that the shortest times given on these charts are for situations where the layover/loading time in the terminal was minimal.
At Pioneer Village Station there is a considerable variation in the time buses spend in the terminal. This is the “flip side” of the variation in travel times seen above. Buses that reach the terminal much sooner than scheduled will have long layovers.
Here are the data for weekdays. The minimum value is 3-4 minutes during the daytime, but values range well above this. Even allowing for access time, some buses have layovers greater than 20 minutes.

Saturdays and Sundays are similar to weekdays, and Saturdays include some very long layovers.


Layovers at the south end of the line show a similar pattern.

Round Trip Times
The chart below combines the travel time between the termini (“driving time”) and the time spent at terminals (access and layover time) to show the total round trip time averages compared to the scheduled value. Notes:
- The “scheduled” line is based on the five periods of weekdays used in the TTC’s schedule summaries, and the transitions may be less abrupt than shown here.
- The “recovery” values include access time to and from the terminals which, based on the minimum terminal times, is about four minutes at each end of the line.
These are average values, and lot is hidden by averages including the swings down to the minimum or up to the maximum, not to mention the variation either side of the average.
The question, quite frankly, is just how much recovery time should be built into schedules, but the 95th percentile design effectively guarantees most buses will get to the terminal with time to spare. This is usually achieved by providing less frequent service to riders, and the result could be counterproductive. Fewer short turns for the worst case trips, but longer waits for everyone, especially when service is bunched as we will see in the detailed reviews to follow.
The linked PDF contains the the weekday and weekend data for this chart.

Samples of Individual Days’ Operations
Chart Format
For readers new to these charts, a few introductory notes.
- The “Chart” files contain eight pages each of which covers three hours’ operation beginning at 4 am.
- The geography of the route is laid out bottom (south) to top (north) and the diagonal lines show the movement of buses in time back and forth between the termini.
- The slope of a line indicates the vehicle speed with the more horizontal lines indicating a slower travel speed. A horizontal line represents a stopped bus, typically at termini, but also at stops along the route.
- The “Headways” files contain eleven pages corresponding to screenlines along the route where headways are measured. The locations are of my chosing to give a representation of service at various points along the route.
- Stepping from page to page of these files shows how the service leaving a terminal evolves as buses move along the route.
- Ideally, headway values should be almost the same for each schedule period, but they often are not with a high value (a gap) immediately followed by a low one (a bunch). As buses move along the route the peaks get higher and the valleys deeper showing that there is no attempt to restore evenly spaced service.
Wednesday, October 2, 2019
October 2, 2019, is an example of a “good day” on the 41 Keele route. Most trips run from one end of the line to the other without undue delay except for an AM peak slowdown northbound south of Wilson Avenue.

There is also some slow operation approaching Eglinton both ways in the PM peak.

Where buses catch up to each other, they run to the terminal, but then leave spaced apart. There are several examples of this through the day including in the two sample pages above.
Although one might complain about a pair leaving a terminal and travelling over the route together, at least this was generally sorted out on the return trip. All the same, there are enough cases of buses travelling close together that the headway charts show how riders are affected even under good conditions.
The first page of the northbound headway charts shows service leaving Keele Station. For much of the day, the headway values stay in a narrow band with occasional examples of a long, then a short headway. No buses actually leave together, and the minimum is about three minutes.

By the time the service reaches Lawrence, however, there is a much greater variation in the headways with the gaps getting longer, and the space between buses shorter, although they are not yet running nose-to-tail.

By Finch, the swing in headways is even wider, and some buses are effectively running as “second sections”, not as independent trips. This is a typical behaviour on all routes, and there is little attempt to manage headways, at least the worst of them, to correct these problems. Some of the variation in travel times is a direct result of this type of operation where buses avoid serving many passengers and thereby save on dwell time at stops. That saving translates to a long layover at the terminal.

The situation southbound is identical with mostly well-spaced service leaving Pioneer Village Station, but this quickly turns into the same pattern of wide gaps and bunching seen northbound.
Tuesday, October 22, 2019
October 22 was not a “good day”. It began well enough through the AM peak, but by midday, buses began running together.

The situation was not helped by a bus that appears to have gone out of service at Grandravine around 15:40, then headed up to Finch West Station, then back to Wilson, vanished briefly only to reappear northbound at Eglinton. Combined with bunching, this left some wide gaps in service for anyone depending on the 41 Keele local service.

The situation continues into the early evening with some buses still not properly spaced …

… and the problem continues into the late night service. It is worth noting that some of the tailgating involves the same buses over an extended period.

The headway charts for October 22 are not a testimonial to good transit service. Until about 3 pm, service leaving Keele Station is well behaved, but then things fall apart and never recover for the rest of the evening. The pattern on 41 Keele for many days is that service is fairly well spaced until about 3 pm, and this suggests the effect of route supervision that goes home just as the PM peak begins.

As on October 2, even the well-space service leaving Keele Station is ragged by the time it reaches Lawrence, and after 3 pm, things are really atrocious with half hour gaps.

The situation leaving Pioneer Village Station is similar, although the headways before 3 pm are not as reliable as they were northbound.

The service at Lawrence is very poor from noon on with vehicles running in pairs separated by long gaps.

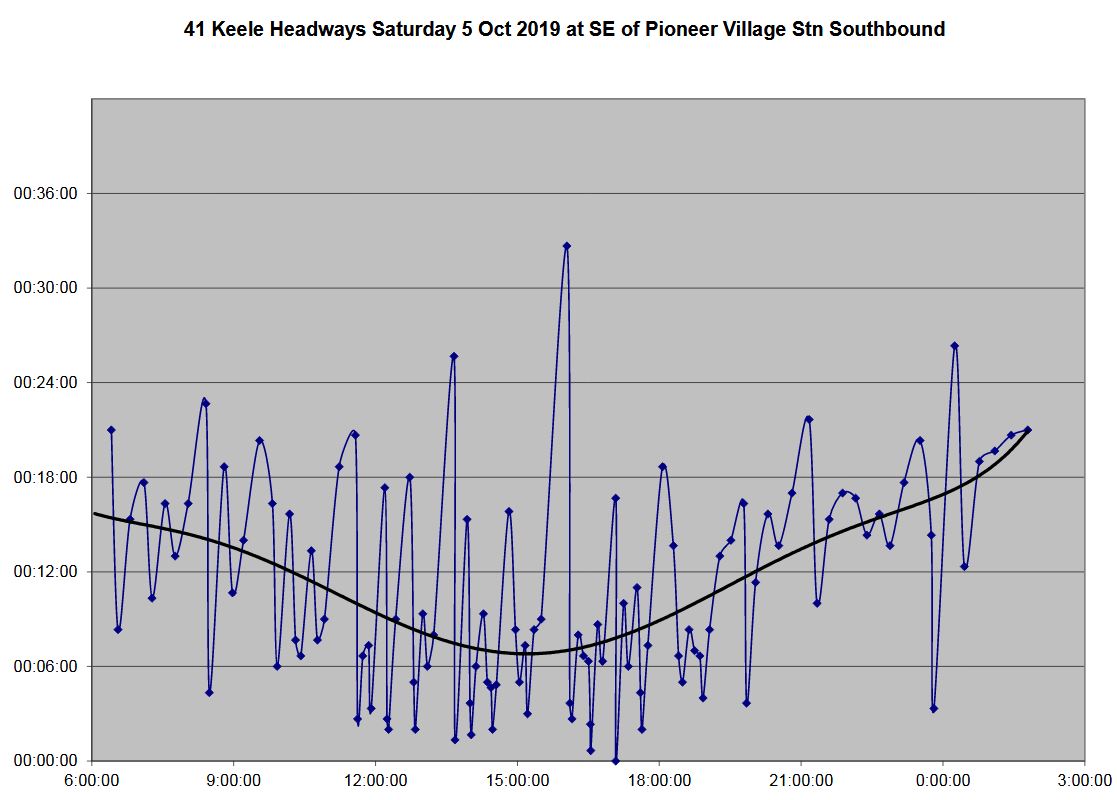
Saturday, October 5, 2019
One might think that service on a weekend – when 41 Keele is not split into local and express service, and the route runs with standard sized buses on a shorter scheduled headway than weekdays – would be an improvement. Alas, that is not the case. October 5 shows a line where reliable service simply does not exist with bunching and gapping all day. This is not a case of buses catching up to each other, although that does happen too, but of leaving terminals together. In some cases, the same buses do this for more than one trip.
For an extra distraction, one bus spends its time shuttling back and forth from Pioneer Village to Finch West Station.


The headways from the terminals are worse than for weekday service with bunches of two and three vehicles leaving northbound from Keele Station (a long headway immediately followed by a pair of short ones), and the situation at Pioneer Village is only slightly better. These headways completely violate TTC Service Standards, and there is no excuse for service to run so raggedly all day long.

At Lawrence, wide gaps are commonplace in both directions.


Sunday, October 13, 2019
Sundays fare no better with buses running back and forth on the route in pairs, wildly erratic headways from both terminals. and several short turns at Finch West Station.


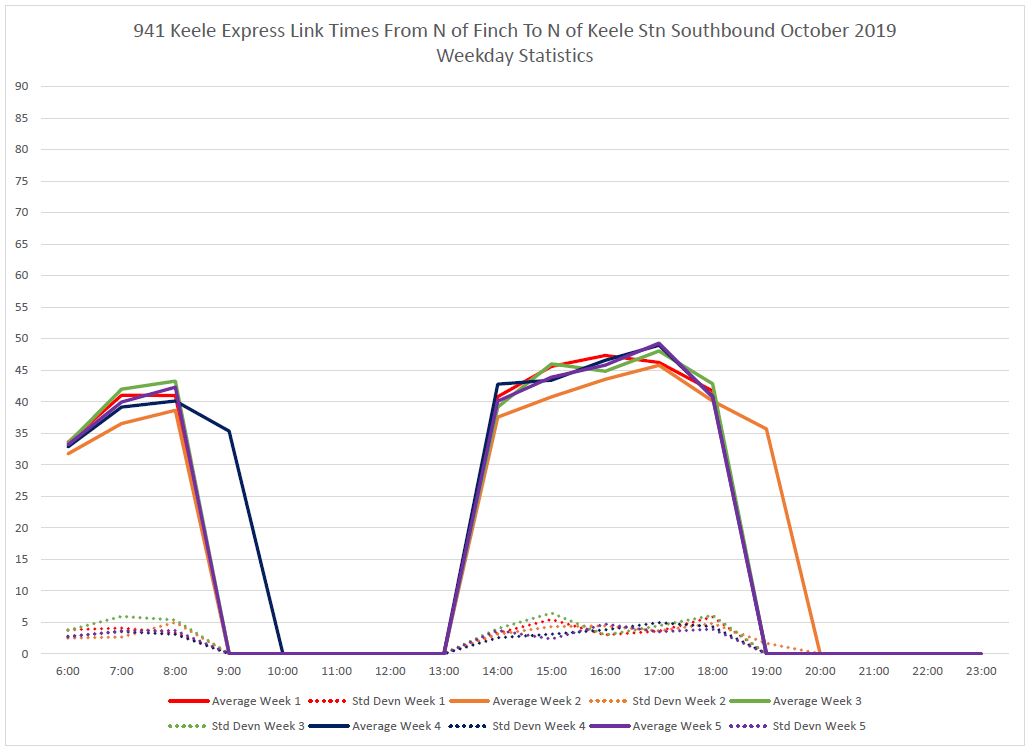
941 Keele Express Service
The express service on Keele, part of a rebranding that was more about marketing than actually adding service, consistently provides unreliable service with headways ranging over the 0-30 minute span at both terminals. Clearly, these buses are running more or less when they feel like it with little attempt to provide regular service.
In the charts for the 941 Express, I have omitted trend lines because there is so much scatter of so few data points and a “trend” is meaningless.
Headways on the 941 Keele Express are so erratic that any time saving an express trip might provide can be more than offset by an unexpectedly long wait for an express bus to show up. They are spread over a wide range of values, especially southbound from Finch West Station in the PM peak.
The following charts show the scatter of headway values from Keele and Finch West Stations in Week 4.


The two charts below show the quartiles for data for the entire month.


Travel times between Keele and Finch West Stations are shorter for the Express service, but that full saving only applies to someone travelling the entire distance. A trip between points along the route will save less time, and the benefit could be lost through a long wait for a bus to appear.
Express services advertised as an improvement on what went before should not have half hour gaps and buses running in pairs.
Service charts for three days are included below. Items worth noting include:
- October 2 and 22 were the “good” and “bad” days shown above for 41 Keele.
- October 25 was added here because it shows considerably more congestion delay in the PM peak than other days.
- Terminal layovers/recovery for buses on all days is generally good, and so departure times should be regularly spaced.
The charts show clearly that the express buses get long layovers at the terminals, and unevenness in departure times is not caused by buses arriving late thanks to traffic congestion. A major problem with excessive running time is that it can encourage late departures because it is always possible to make up time during a trip.
Travel Time Comparisons Between 41 Keele and 941 Keele Express
The local service takes about 10 minutes more for the run from Keele Station to Finch West Station, less so in the AM counterpeak direction, northbound.
Northbound


Southbound

Full chart sets:

Eons ago there were checkers that rode every bus on a route all day long writing (pen and paper style!) times plus rider counts at every stop. I recall the effect this had on time keeping. After a short time buses left the subway terminal OTATT On Time All the Time. End result was for a week or two was GREAT service!
When the checkers ended their work it only took a short time for things to revert to normal with operators doing as they pleased. SNAFU. Situation Normal All F***ked Up!
I also remember when there were Supervisors part way along major routes (such as at Keele and Eglinton) who kept buses spaced properly. They worked EVERY day.
There is no substitute for “Boots on the Ground”.
LikeLike
I happen to drive the Keele route and this is what I will share.
The articulated buses give management an excuse to cut down the number of vehicles while preserving the capacity.
The articulated buses are slow to accelerate and requires early braking.
Passenger numbers are very high on this route.
Traffic Congestion at St Clair, Old Weston Road, Eglinton, Lawrence and Sheppard is what’s holding up the buses. Ride at 6am in the morning compared to 8am and there will be a big difference in travel times and speeds.
Steve: This is quite evident in the charts of vehicle movements. There are of course variations in travel time and congestion, but these are known parts of building any schedule. What this does not excuse is the variation in vehicle spacing especially when most buses get an adequate layover time at terminals but leave on a less than exact headway, moreso in the afternoon than the morning. There appears to be no attempt at headway management especially on weekends.
I have heard that there is a possibility the artics will go back to 7 Bathurst (thereby further screwing up that route), but there would then be standard buses on Keele. This will shorten headways, but won’t address reliability problems which are quite evident on weekends when there are already 10m buses on Keele.
LikeLiked by 1 person
The 41 is especially bad as it has to deal with the crosstown construction and navigate through multiple highly congested bottlenecks in the junction. In my experience it can take more than 10 minutes for the buses to clear some intersections.
The situation with the express service is common on many other routes, and I speak from experience with the 925 Don Mills. If the TTC is not willing to manage the express network properly the program should simply be terminated and its resources reallocated to the local routes.
In a similar vein the TTC seems to be unable to manage blended headways on routes with multiple branches. The 70, 47, 96, and 52 are prime examples, but this even happens on the Spadina line, which does not have to deal with traffic congestion. They are almost better off not even trying and instead scheduling each branch independently rather than running a service that is never operated as advertised.
Steve: The actual vehicle tracking information, which would be very hard to fudge, does show some delays at Eglinton, but actually worse problems in the Junction and south of Wilson. The TTC recently added running time to the 41 Keele schedule and widened headways (which worsens crowding), but seems to make little effort to space service even with mostly adequate time for terminal layovers.
LikeLike
The issue that I feel in traffic is getting worse in the city and not many on council will pass a gridlock tax or something like it. I am so sick of the treatment of transit in this city as second or third rate.
LikeLike
October 2010?? I didn’t know you time traveled!
Steve: An obvious typo with the “0” being right beside the “9”, but I missed it!
LikeLike
The TTC’s rescheduling approach actually does have one situation where it is beneficial — when you have a route running at a long headway (say, 30 minutes), the posted schedule is very important, and adding recovery time so that they schedule can be maintained can be effective. I regularly ride one of those routes that was notoriously frustrating until the schedule was adjusted, and now it is actually usually pretty reliable.
Where the route is frequent and even headways are more important, then the answer is not reducing the frequency so that recovery time can be increased (you don’t need to crank up recovery time to maintain a schedule, because the schedule is not important). Instead, the route should be run to conditions and, if anything, the schedule should be MORE frequent than required so that when the inevitable foul-ups and slow-downs occur due to variable conditions on the route the frequency is still reasonable plus there is enough flexibility to adjust.
What it means is instead of dealing with the problem in the service planning department, the problem needs to be addressed in the supervisory department. I really think supervisors should be familiar with your Marey charts because they really show the range of operating characteristics and service quality, and show how schemes to manage operations may or may not work depending on conditions. (There are several cases where there are two buses at a terminal at the same time, and one is held back for 7 minutes or so to try and respace service, which you would expect to be a good strategy. But because the leading bus is trailing a large gap, the second bus easily makes up that 7 minutes and catches back up again. Maybe in certain conditions there are strategies that would work better.)
Increasing the layover time on frequent routes has complicated terminal operations because suddenly terminals are congested with multiple buses on the same route laying over at the same time. It is readily apparent on streetcar routes because streetcars have to line up to enter the terminal, but it happens with buses too. At Vic Park station, it is common for there to be so many buses laying over on both sides of the bus driveway that it is difficult for buses to manoeuvre, or that operators have to let passengers off so far away from the station that the bus is half outside the fare paid area.
LikeLike
Steve said: There are of course variations in travel time and congestion …. What this does not excuse is the variation in vehicle spacing especially when most buses get an adequate layover time at terminals
It is clear that traffic congestion is one source of the problem. A second “potential” source is extreme fluctuation in the number of passengers. A bus may leave early, from its lay over schedule, because it is full. We do not know how full the buses are. When a full bus stops, it takes longer for passengers to get off or on. When there is a big gap in the headway, there will be a bigger build up of passengers waiting at each stop. When things go bad, they get worse.
From a human perspective, I would hate to be a bus driver who has to go to work driving in these conditions. From a passenger perspective, I am really frustrated to see buses bunched up. The worst is to have a full bus stop, while some half empty ones skip my stop. I totally agree with Steve (the poster above) who noted blended headways and routes with multiple branches misuse capacity. I would add watching empty express buses whiz by, while regular buses are packed.
I am most frustrated when 4 buses are bunched up. The route supervisor must know the whole route will suffer. I’m not sure that holding a bus back to respect its layover schedule is the answer because there is a huge gap in service at the other end of the route. To break up a bunch, the supervisor has to know which bus is the fullest (he doesn’t, maybe with Presto?). He orders that bus to become an express bus. The driver has to announce to passengers on board, so some will get off. The hope is that this bus will be able to break away from the bunch. Also needed is to get an additional bus onto the route further down. This borrowed bus will be replaced with one of the buses from the bunch.
Elevators in large buildings are dynamically dispatched to maximize service. The route supervisor can’t do the same job because he doesn’t know the number of passengers waiting at each stop, nor what stops the passengers on board want to get off at. A forced schedule seems of limited use in congested traffic and fluctuations in passenger flow. Will the Finch LRT or Eglinton Crosstown help current Keele passengers to use the Line 1 subway?
Steve: This is a very rosy view of route management. When two buses leave a terminal and make an entire round trip running as a pair, this is laziness by one of the two operators and an absence of line management. If one of the two buses really is late, nothing prevents expressing it part way down the line to make up time. This is generally not a problem of variation in travel times.
LikeLike
This is an interesting point. I know each route supervisor is assigned a set of routes. With all the statistics gathered, is there a way to measure each route supervisor’s performance. For me, I’m most annoyed at bunching. If we could measure the number of bus bunchings that occurred, then swap out another supervisor to see the new supervisor made a difference, we may push for better service. I truly suspect some route supervisors do absolutely nothing. As bus drivers are union folk, some have the mentality to screw up the system, as a lark.
Steve: I think that there are times and routes that have no supervision at all unless something like an accident attracts their attention. In other cases, a supervisor might have a collection of routes nominally assigned to them, but they concentrate on the major ones and leave the rest to fend for themselves. Keele, however, is hardly a minor route.
LikeLike
Steve said: Keele, however, is hardly a minor route.
This would be a perfect test case. Can different route supervisors make a difference on service performance on Keele. I bet yes, some route supervisors are better than others and the big problem is that senior management is oblivious. It could be more and better hands on route supervisors improve bus service.
LikeLike
I would gladly invite you to do the 7 Bathurst and 307 Bathurst blue night route analysis.
Having two to three 7 Bathrust buses all sitting (and usually, all idling) at the top-end and bottom-end of the route as well as Bathurst/Wilson (changeover point) are a daily occurrence, whether it be AM or PM peak, midday or early evenings. Right now, the tracker shows the next three southbound Bathurst buses coming into Bathurst station at +9, +11 and +7.
I have also been complaining about a 7 Bathurst op for the past eight months who on his last northbound trip prior to deadheading back to Wilson division, never seems to complete the route in its entirety; instead, he does a self-appointed short turn, usually at Bathurst/Finch (as opposed to finishing at Bathurst/Steeles) and is usually back at Wilson division at the same time he is scheduled to be at Bathurst/Steeles.
It’s also funny seeing the 160 Bathurst North, a route that runs parallel to 7 Bathurst from Bathurst/Wilson to 6101 Bathurst St (near Bathurst/Steeles), having less running time than the 7 despite the fact that both routes run in the same traffic, on the same road and serve all the same stops.
307 service is sporadic at best. It is common to have 40-50 minute gaps in service Friday nights/Saturday mornings. Insufficient running time early Sunday mornings also results in large gaps on the 307 which creates gaps on the 7 (most 307 buses become 7 buses on Sunday mornings).
Steve: None of this surprises me from previous examinations of the 7 Bathurst route. I plan to revisit this one early in 2020.
LikeLike
I might add that this is probably is probably a big part of the reason why Rob & Doug Ford’s Subways Everywhere messaging was so persuasive to voters in the inner suburbs. It’s not surprising seeing the state of most of the major suburban bus routes and how the subway is the only part of the network where the TTC seems to be willing or able to manage a fairly reliable headway.
Steve: Exactly! As long as the TTC treats the surface network as at best second class, there will always be demands for subways.
LikeLike
5 questions:
Steve:
1. Short turns were always an annoyance to riders who in turn complained to their councillors who in turn complained to the TTC. Driving down the short turn count became a major goal. To some extent it was valid in that short turns can be a quick fix, but it allows operators who are lazy to simply run late deliberately to get turned and thereby have a nice layover somewhere like Sunnyside or Woodbine Loop on the Queen line. However, this turned into an obsession which drove schedule redesign to give more running time so that nobody would ever have to be short turned. That creates its own problems, but also the premise that we have to keep the count as low as possible (and this is trumpeted in the CEO’s report as an achievement) means that an attitude develops where short turns are rare, and needed short turns don’t happen.
2. I have seen some Route Supervisors make adjustments, but they are a minority. Also, the degree to which they use technology to “see” the overall condition of the route will vary. TTC created a handheld devicefr them, but it was cumbersome, and when I see a Route Supervisor they usually have the tried and true pen, paper and printed schedule. This itself can create problems because one cannot manage to headways simply by relying on the schedule.
3. As for internal performance evaluations, I don’t know what they are measured on. An obvious issue is that if upper management’s goals are misguided, the people with the responsibility of carrying them out will “learn” the wrong job.
4. No.
5. I think there is a general problem with visible of TTC station personnel and this will get worse when they are not in predictable locations like Collector’s Booths or in recognizable garb. It was an idea Andy Byford imported from his early days in London, but I suspect that the implementation, especially without him here, has not been handled well. In some circles it is seen as a cost management approach rather than an opportunity for better customer services.
LikeLike
I wish you luck. You may be waiting for a very long time. They recently changed the Pape route to independent services on each branch during some periods because it took them about 20 years to realize their original arrangement wasn’t working.
Steve: Speaking of taking ages to recognize a problem in service design – it took the TTC two decades to split what is now the 501L, formerly 507 Long Branch, off from the main 501 Queen service and acknowledge that they could run better service on a separate route west of Humber Loop.
LikeLike
So what does this mean for 35/935? The situation on this route I feel is much worse than on Keele with even more overcrowding, bunching, short turns etc. It is also the only route I can really speak for as I use this route the most out of the ones I use. I can say that since 2012, I haven’t had an overly pleasant time riding this bus and its getting worse. More and more people are using the 35 every year.
I’m witnessing what was a smaller problem bloom into huge problem and I haven’t seen any vocal acknowledgement from the TTC to address the issues at hand. The fact of the matter is, the normal 40 foot buses simply aren’t capable of handling the huge loads of passengers. Even with the addition of more buses, all this has caused is bunching, gaping and frequent short turns.
It is the single most frustrating thing when a bus skips your stop because they have no more room whatsoever to let you on and equally frustrating to have an already overcrowded bus short turned to fill a gap in the other direction. I’m not liking what appears to be negligence on the TTC’s part. Has there been any consideration at all to deploy articulated vehicles on the route?
Even if it meant slightly longer wait times, I feel it would be better overall with more room for people, more manageable crowding, less short turns and no more stop skipping. I just thought I’d give my two cents and I know I’m not the only one who is fed up with bus service on Jane.
Steve: There are many routes I have to review now that detailed tracking data are available from the TTC’s new Vision route management system. Jane is among them.
As for the larger articulated buses, be careful what you ask for. The TTC tends to replace vehicles on an equivalent capacity basis, and so there would be fewer vehicles with little or no additional capacity on the route. Until the TTC acknowledges that its service does not address demand actually on the street, and Council funds the system to actually run better service, this problem will continue across the network.
LikeLike
I’m glad for one that Jane is being looked at.
Steve: It will be looked at by me. I don’t know what the TTC’s plans for it are.
Jane is one of those oddities. It really needs an LRT along its corridor but such a thing hasn’t been finalized and even if it had we’d still be years out that at this point.
I hear the TTC is discussing plans to remove articulated vehicles from Keele. Would it not be worth to at the very least try running them on Jane for a while instead of simply returning them to Bathurst? I feel it would give the TTC more data. I personally at least want to see and experience how it would be for myself. No data is better than data from the customer, I’d say. Anyway, I hope some solution is conjured up because it’s frankly unacceptable the way Jane is treated presently.
LikeLike
The problem with using artics on Jane is Jane station isn’t fare paid, so they wouldn’t be able to use all door loading.
LikeLike
Neither are nearly all the streetcar stops, but they somehow manage…
Also, I seem to recall hearing that with the move to Presto, all buses would be all door loading all the time? They put Presto readers at the back doors that only ever get used as a backup when the front one craps out, or when they’re filling in for streetcars.
LikeLike
Why is bus-bunching departing from *terminals* tolerated?
I don’t know of any other system in the *world* who allows that. Every system I know of in the world EXCEPT the TTC, when a bus departs a terminal, the next bus flat out has to wait until the headway has passed (apart from overcrowding-relief specials where you deliberately send out two in lieu of one larger bus). This is the trivial form of headway management, and TTC isn’t bothering to do even that?
(BTW, this is why in almost all bus networks, every terminal has some layover space.)
It would be good to do something more sophisticated, but I’m flabbergasted that they aren’t even doing the basics. They need to learn how to run a bus before they can do anything fancier!
LikeLike