
In today’s Toronto Star, Tess Kalinowski writes about recently released Metrolinx reports concerning the Union Pearson Express (UPX).
The items of interest are down at the bottom of the Reports & Information page and they include ridership forecasts from December 2011 and May 2013. The latter report was cited as background to the Auditor General’s 2012 Report on Metrolinx [beginning on p. 6 of the pdf].
Given that the projection is almost two years old, one might be tempted to say “maybe things have improved”, but that’s a tad hard to believe in the absence of any newer studies from Metrolinx.
There are great hopes, and even greater hype, for the UPX, and getting some basic information on the table is certainly worthwhile.
Commercial Confidentiality
Sections of the forecasts have been redacted by Metrolinx “to protect economic and other interests”, and the missing data appear to be entirely concerned with revenue projections and fare levels. How exactly this is applicable is quite a mystery considering that Metrolinx is a public agency and we are not dealing here with a privately operated UPX or a 3P, the very model that was abandoned because the “private partner” didn’t think the line could make money.
Metrolinx and, through them, Queen’s Park are hiding behind confidentiality provisions to save themselves from criticism over fares and costs, but we can get at that by other ways, notably in the Provincial Auditor’s Report (discussed at the end of this article).
Metrolinx owes the public a clear statement of just what “economic and other interests” are being protected other than the threadbare reputation of politicians who have staked much on this project.
December 2011 Forecasts
The first step in estimating ridership is to look at the overall projected use of the airport. The chart below starts with projected demand in 2020 and then carves away travellers who are not in the potential market for UPX services.
Of the projected 40.8-million airport users, 10.9m are captive to the airport because they are changing between flights. A small number, 1.8m, will be arriving or leaving during hours the UPX is not running. The next large block, 14.9m (36.5%) originate from or travel to locations the UPX does not serve. Another small block, 1.3m, use private shuttles such as links to hotels. This leaves 11.8m (28.9%) of airport users as potential UPX passengers. Of these, the overwhelming majority now use taxis or drop offs/pick ups for transport to/from the airport. This is the market UPX seeks to tap in its aim of reducing road congestion and associated problems such as pollution.

Based on surveys of travellers in 2009, the passengers were reassigned by mode to show the effect of the UPX.

This chart considers all of 29.86m passengers who are not transferring at the airport, and predicts that the ARL would capture 3.08m trips. What the chart does not tell us is the distribution of trips within and outside of the potential scope for UPX riders (the 11.8m above). Note that the thickness of the bands in the first chart (in scope trips) is different from the bands in the “without ARL” column in the second chart (all trips). “Rental car” is a noticeably thinner slice for in scope riders than for airport trips in general. This probably reflects the comparative difficulty of reaching locations that are not downtown and the need for personal transportation once someone gets there.
In any event, UPX (labelled “ARL” above from its original name “Air Rail Link”) manages to pick up 3.08m trips which is 26% of its in scope market, or 10.3% of all trips to/from the airport. Most of these are to/from downtown, and so these can reasonably be assumed to be auto/taxi journeys diverted from the 427/QEW/Gardiner route.
The report estimates that the UPX riders have been diverted from other modes: 62% from taxis, 11% from an express bus and 27% from a car (rentals, drop-offs, parking).
Ridership on UPX is projected to begin at 1.35m for the 2015 partial year (April 5 to December 31), and ramp up to a “mature” level of 2.97m annually in 2018. Thereafter, growth at 1.4% per annum is projected (based on experience with other similar systems worldwide) to a 2031 value of 3.57m.
A much more generous view of ridership was assumed in the Neptis Foundation report authored by Michael Schabas. In that report, which included quite rosy projections for the financial health of UPX, Schabas begins with a presumed 2015 ridership of 3m (annualized basis) with ridership doubling by 2023 and doubling again by 2033. This is vastly more riders than projected by Steer Davies Gleave in the Metrolinx study.
Part of the black art of ridership estimates is a projection of the “capture rate” for airport trips from various parts of the city. If there would be 100 trips to the airport from an area, how many of these would likely be picked up by UPX?

A high capture rate is predicted for downtown at 68% (note that although the chart includes a legend for 80-100%, no zone actually achieves this level). In other words, for every 100 trips to the airport from to/downtown, 68 are expected to use UPX. The proportion at Bloor Station is high too:
… capture rates are high at 53% reflecting the highly competitive nature of the ARL compared to other competing modes for those travelling to or from this area. [p. 18]
This is certainly wishful thinking because unlike a businessman downtown who would probably walk to Union Station, riders along the Bloor subway corridor are far more likely to get on the subway and, having done so, simply continue west to Kipling and the TTC’s 192 Rocket service. A related problem here is that there is no direct connection from Dundas West Station to the UPX platform. Metrolinx has even proposed a scheme to rejig (one might say “gerrymander”) Dundas West Station simply to improve the surface link between the subway and the GO/UPX station. It is worth noting that SDG explicitly states:
The ARL station at Bloor will be easy to access and have a good interchange with other transit modes. [p. 20]
They presume that in the absence of a good connection at Bloor UPX station, riders would backtrack to Union rather than simply taking the subway plus the 192. This is a rather blinkered view and clearly does not allow for the substantially added access time just to reach Union. (The effect of a longer trip is clear in the sensitivity analysis later in the report.)
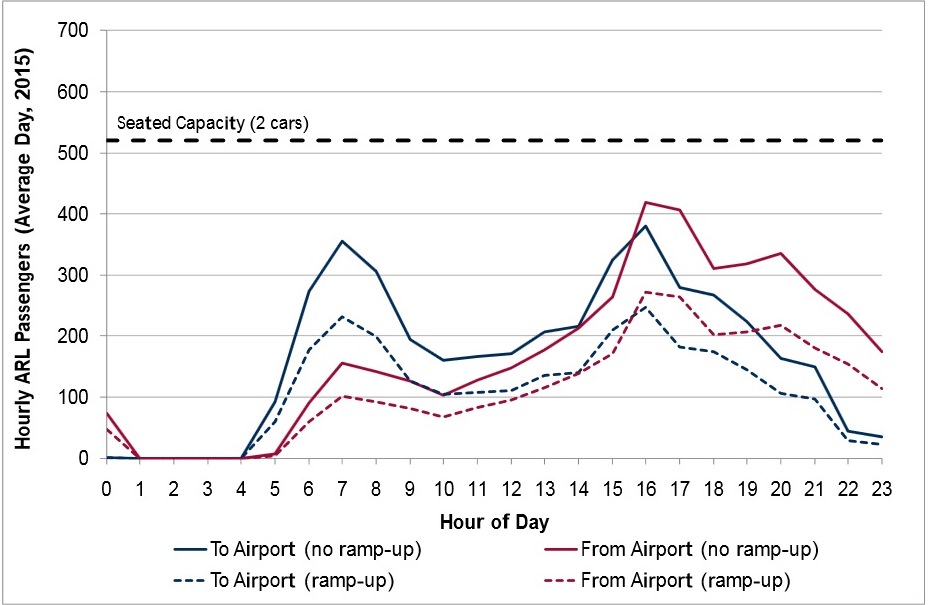
Hourly demands over the day are projected from the known travel patterns at the airport (hourly volumes, trip times adjusted relative to flight times to allow for security clearance and baggage handling, variation in proportion of trips types by time of day) to produce a projected demand level for UPX in its first year.
The first chart shows projected demand on a typical day for traffic to and from the airport. This is well within the capacity of two-car trains. (The “ramp-up” scenario below presumes that traffic does not build immediately to the full projected level. Given that much of the traffic will be to/from downtown, this chart is also a good indication of the number of trips that will be removed from the road network by time of day.
August is a heavy travel month, and the projected peak demand for it is shown below. This would take UPX either into standees (hardly a “premium” service) or a need for three-car trains.

Usage by station shows a very heavy skew to Union as the primary origin and destination.

Finally, the report considers the effect of altering assumptions in the model.

It is intriguing to note that the Greater Toronto Airport Authority (GTAA) who run Pearson Airport have different assumptions in their model of airport traffic compared to the Metrolinx study. Notably they have a higher assumed mode share for downtown and they project a higher growth in air travel.
Adopting the GTAA air traffic forecasts leads to a 14% increase in the forecast ridership of the ARL. This is directly related to the fact that the GTAA air traffic forecasts are greater than the ones that have been developed by us for this study.
Use of other GTAA data to change the demand composition of the in-scope market has a number of small impacts, the biggest being the impact of the GTAA mode shares for the downtown metro area of Toronto which increases ridership forecasts by 7%. [p. 24]
Increasing the travel time has a negative impact on projected ridership. This is worth noting in the context of a proposed connection at Bloor/Dundas West where the existing transfer route would add substantially to trip time and also endure the penalty that transferring and waiting rank far higher than on board time as a deterrent to ridership.
May 2013 Forecasts
By 2013, air travel had grown faster than predicted in the 2011 study, and so future passenger volumes were updated. However, the charts showing projected travel at the airport suggests that this effect is quite small, and for some years the projections are actually lower. [Compare p. 8 of 2011 report with p. 9 of 2013 report]
- 2015: 36.5m in both the 2011 and 2013 projections
- 2020: 40.8m in the 2011 projection, but only 40.6 in 2013
- 2025: 45.0m in the 2011 projection, 45.1m in 2013
- 2030: 48.6m in 2011, 48.9m in 2013
- 2035: 51.3m in 2011, 51.7m in 2013
Some of the change is attributed to the effect of the Island Airport diverting traffic from Pearson.
Some of the competing modes fell in price (allowing for inflation) and this made the proposed (and secret) UPX fares less competitive affecting projected demand. Express buses from downtown were still part of the mix, although these are no longer in the market in 2015.
The chart illustrating the “in scope” demand is almost unchanged in 2013 from 2011. Instead of 11.8m in scope passengers per year, the number is now 11.9m. However, the projected annual demand on the UPX has fallen by 2013 from 3.08m t0 2.46m. about 20%. Much of the UPX loss shows up in the auto categories:
- Drop offs were 9.55m in 2011, but are now 9.73m.
- Taxi trips were 5.77m in 2011, but are now 6.08m.

Because the revenue projections are redacted, we do not know how much of an effect the proposed UPX fares have on these numbers, or, indeed, what fare was included in the model, or whether a sensitivity test related to fares was included.
The forecast ridership in 2031 is lower in the 2013 report (2.94m) than the 2020 ridership projected in 2011 (3.08m).
The projected sources of UPX riding (taxis, express bus, auto) are estimated to make roughly the same proportionate contribution in the 2013 report as in 2011.
The projected reduction in car trips is 1.98m per year in 2020 rising to 2.36m in 2031. This may sound like a lot, but it is still under 10% of total traffic to the airport showing how important the provision of much-improve transit access via other routes will be.
In the 2013 study, the capture rate for the market for downtown has been reduced from 68% to 60%. Even so, 73% of demand is expected to come from this area.
Forecast annual ridership is expected to be split between the three stations with 79% at Union, 14% at Bloor and 7% at Weston. This is little changed from the 2011 report.

The hourly ridership numbers come nowhere near the seated capacity which is now based on a mix of 2 and 3-car trains.
We have been advised by Metrolinx that the hourly seated capacity will be between 576 and 672, depending on the mix of 2 and 3-car consists. Both are well above forecast hourly demand. [p. 24]
What is even more startling, however, is to compare this chart from the 2013 report with the one in 2011 that showed demand for the opening year, 2015. The projected demand in 2020 is now lower than the originally projected demand in 2015.
Finally, in a look at airports around the world, the 2013 report gives the following comparison for Toronto. In this chart 2020 Toronto projections are compared to recent data from other cities. In other words, Toronto’s numbers are goosed by the inclusion of at least 7 years of ridership and demand growth relative to other cities.

It is rather amusing that a combination of UPX with bus service is included here to show Toronto in a better light for overall transit access. The bus passengers (those who have not been poached away by UPX) were already on transit and do not represent any reduction in road demand or congestion.
This chart is described in unwarranted glowing terms:
With a forecast market share of 8.3% and passenger volumes of 2.5 million in 2020, the UPE in Toronto is comparable with other North American cities such as:
■ Vancouver, served by the Canada Line rapid transit service: 10% rail market share;
■ Chicago Midway, served by Chicago Transit Authority “L” trains: 6% rail and 9% transit overall;
■ Seattle, served by the Link light rail service: overall transit market share of 11%; and
■ Baltimore/Washington, served by a large number of rail services (Amtrak, MARC and a light rail system): 12% transit market share.
We will just ignore the fact that Toronto in 2020 with UPX will be well below Boston’s Logan airport served directly by the local transit system (the Blue Line), and the much better known (and used) Chicago O’Hare airport (also on the Chicago El).
In the conclusion, the report states:
The UPE is forecast to carry 8.3% of the surface access market. This is well within the range of other airports in the world, and in particular North American rail links such as Vancouver and Chicago. [p. 29]
The reader is not supposed to notice that the comparison is actually to Chicago’s minor airport, Midway, not to its primary airport, O’Hare, nor that many other North American airports already outdo the Pearson/UPX combination’s 2020 projections.
The Provincial Auditor’s Report
The Provincial Auditor reviewed, among other things, the question of cost recovery for the UPX operation and capital costs.
At the time of our audit, the province had not specifically required that Metrolinx recover the cost of operating the ARL from revenues that the service generates. The Ministry of Transportation (Ministry) informed us that Metrolinx would set the ARL’s fare in consultation with the province.
If operating the ARL on a break-even basis is indeed the objective, this may prove to be a challenge for Metrolinx. In 2003, Transport Canada announced a private-sector group as the successful Public–Private Partnership (P3) proponent that would design, build and operate the ARL. However, the group was unable to secure financing for the venture because its lenders did not feel that they had sufficient protection from “no market” risk (that is, from a situation where, despite all reasonable efforts to attract riders, the service does not generate enough revenues to be a viable business). They perceived this project to be riskier than other infrastructure projects because there was no “pre-existing demonstrated revenue stream.” The group proposed that the province assume the lenders’ risk by purchasing ARL assets if the “no market” scenario arose. The province rejected this proposal, so the group walked away from the project. In 2010, the government decided that the province, through Metrolinx, would build and operate the ARL itself. [pp. 210-211]
Yes, there are times when a partnership with the private sector just doesn’t work out, especially when the government won’t agree to bail out a losing proposition.
Metrolinx’s preliminary estimate of the ARL’s annual operating cost is approximately $30 million. However, according to Metrolinx, the cost could well be higher, because the service’s exact nature has not been finalized, so some relevant costs may not have been identified yet. For example, the estimate does not include the annual access fee of approximately $5 million that GO Transit was going to charge the private-sector group for using the GO-owned Georgetown South rail corridor. As well, if the fare was to recover the capital cost of the pro-ject over time, we estimate this would approximate $20 million annually over a period of 20 years. If that amount is included as part of the ARL’s operating cost, the total cost to be recovered from fares each year would rise to about $50 million. [p. 212]
Obviously, if UPX is part of Metrolinx, there would not be an internal charge of $5m for the use of GO Transit facilities unless UPX was treated as a cash cow by GO Transit. However, if there were any idea of farming UPX out to a private owner at some point, the question of track usage and other shared costs would be very much an issue.
If we take the annual ridership projections in 2020 of 2.46-3.08m, the cost per trip is on the order of $10 based on that starting cost of $30m. We do not know what additional costs Metrolinx might face that have led them to a standard fare of $27.50 and a Presto-based fare of $19. Metrolinx finances, especially at the detailed level of this one route, are a mystery. Will UPX riders actually be paying the full cost of their service? Will subsidy funds that might have gone to general improvements in GO Transit be diverted to prop up UPX?
The Auditor estimates that a fare of $28 would be required to break even on operations plus capital amortization, and qualifies even that number with concerns about UPX’s ability to achieve market share at a high ticket price.
This does not include the UPX’s share of electrification costs which are still unknown, at least to the public.
Conclusion
The Union Pearson Express was a vanity project for the former Chretien government in Ottawa together with their “partner” SNC Lavalin who were originally to build and operate the line. It then turned into a provincial project under Dalton McGuinty and is now in the hands of the Wynne government. There will be much hoopla, many photo ops, and possibly even some riders. Much effort has been spent over a very long time for a project that should have been delivered as a basic part of the transit system, at most as a branch offering within the GO Transit network.
Much more openness and transparency are required from Metrolinx about this and all of its projects so that informed decisions can be made, up front, about transit investments, subsidies, fares and services. The sham of “commercial confidentiality” must be stripped from these debates.
Part of me wants any transit project to succeed. The worst possible environment for a transit advocate is to spend time explaining that some new line, some new network won’t be like whatever recent debacle happens to preoccupy media and politicians. The projections for UPX are not encouraging.

I intentionally rounded high because I assume some cars would have more than 1 passenger, especially taxis and limousines. Also I did not want to be accused of low balling the use of the system.
Mssrs. Harper and Harris have turned me from being a card carrying member of the old Bill Davis Big Blue Machine to being a left of centre social democrat. Yes, I have an issue with subsidizing those who have instead of those who do not. I am also against the big increase in TFSA and income splitting which will mainly benefit the top fraction of society.
LikeLike
Of course the sad part is that their estimate of use, is probably the highest they could justify, and the sadder part, if we had assumed twice that, it still means a woefully underused system. I am hoping someone will apply some creativity so that it will really be a success in terms of pulling cars off the road. If you offered a standard GO fare, just going to Malton and a good ZUM and Mi-Way connection it might actually divert a substantial number of cars – say 5 million trips per year. It could actually then be a decent supplement to GO in the corridor, being the off peak train to sustain high frequency, with the large GO taking the major peak hour load. Would help in reducing the fear of missing your train later in the day, without requiring full on GO to continue at full operations (connecting to a GO bus at Malton).
LikeLike