
The City of Toronto began a series of public meetings yesterday (March 3) to advance the cause of a a new subway line that would relief capacity constraints into downtown. This round focuses on the question of station locations in the segment from the core area east and north to the Danforth Subway.
It is no secret that I have strongly supported the “Downtown Relief Line” (DRL) for a long time, and yet I could not help being disappointed by the structure of studies now underway and the public participation process. There is a sense of a process that is too low-key, that may give the impression of movement while failing to advance the cause.
In this article, I will review the presentation deck being used in these meetings, the questions being asked of participants, and the shortcomings in the advocacy for this new subway line.
Background
The City of Toronto has a project website containing materials related to the Relief Line including a page with project materials such as presentations at the current round of meetings. The existing conditions page includes links to material such as maps of key destinations and the density of population and employment in the study area.
Consultation on station locations breaks the study into three areas: downtown, the east end and The Danforth. There are many policy considerations that might apply to stations, but notable by their absence are two key factors:
- Which sites are “must haves” on any new transit route? These are sites where existing or planned developments are important enough either for the density will bring, or as major future transit nodes, that omitting them from any route would compromise the credibility of a proposed route.
- What are the likely options for DRL extensions to the west and north, and how will selection of a route for the first phase constrain or support future expansion?
The premise of the consultation is that the City wants to know which locations people might prefer as stations, and what criteria should be used to rank choices. However, the most important question — how does a site work as part of the transit network — is avoided because talk of a network would require someone to draw potential lines on a map. Such lines are dangerous — just putting pen to paper has far-reaching implications because the leap from a suggestion to a cast-in-stone “plan” is astoundingly short. However, it is not possible to discuss station locations without some idea of the more likely places a route might actually go, and especially the primary sites it must serve.
Talking only about stations sidesteps the delicate problem of the effect a new route would have on neighbourhoods not just at station sites, but for the connecting links in between. This discussion is supposed to be part of the next consultation round likely in early summer 2015, but its absence here leaves the station sites in limbo without a broader context. One could argue that station selection should be unfettered – where do people want stations without preconditions filtering out many sites – and yet the question ignores the real fact that some locations and the routes they imply simply will not work. Other locations are pretty much faits accomplis because of their importance. Such information would have allowed informed feedback provided that it did not come with the too-typical “public participation” that only asks for rubber stamp approval of a predetermined outcome.
Planning a DRL will be a politically difficult process not just for funding and regional rivalries, but for the complexity of threading a subway structure through a densely-built series of neighbourhoods. This is not the middle of an expressway or a wide arterial. The inevitable debates must be engaged, not avoided.
The Presentation
This section follows the presentation deck in sequence.

Slide 4: The network transit context map shows many routes that form part of the “Feeling Congested” review of transportation plans. A notional route for the DRL is shown here stretching from Dundas West Station southeast via the rail corridor, then east along Queen, northeast to Danforth and Pape and eventually north to Don Mills & Eglinton. The map shows two lines in the Danforth-to-Eglinton segment because another option here is the Don Mills LRT. Also shown is the Waterfront East line including an eventual extension east to Leslie Street.
Slide 5: Several parallel studies are related because their service territories and purposes overlap. These studies are supposed to “inform” each other leading to consolidated recommendations late in 2015. That process really depends on specifics – where exactly will each line run, which travel patterns will it serve – that require much better definition of project options than a list of would-be station sites.
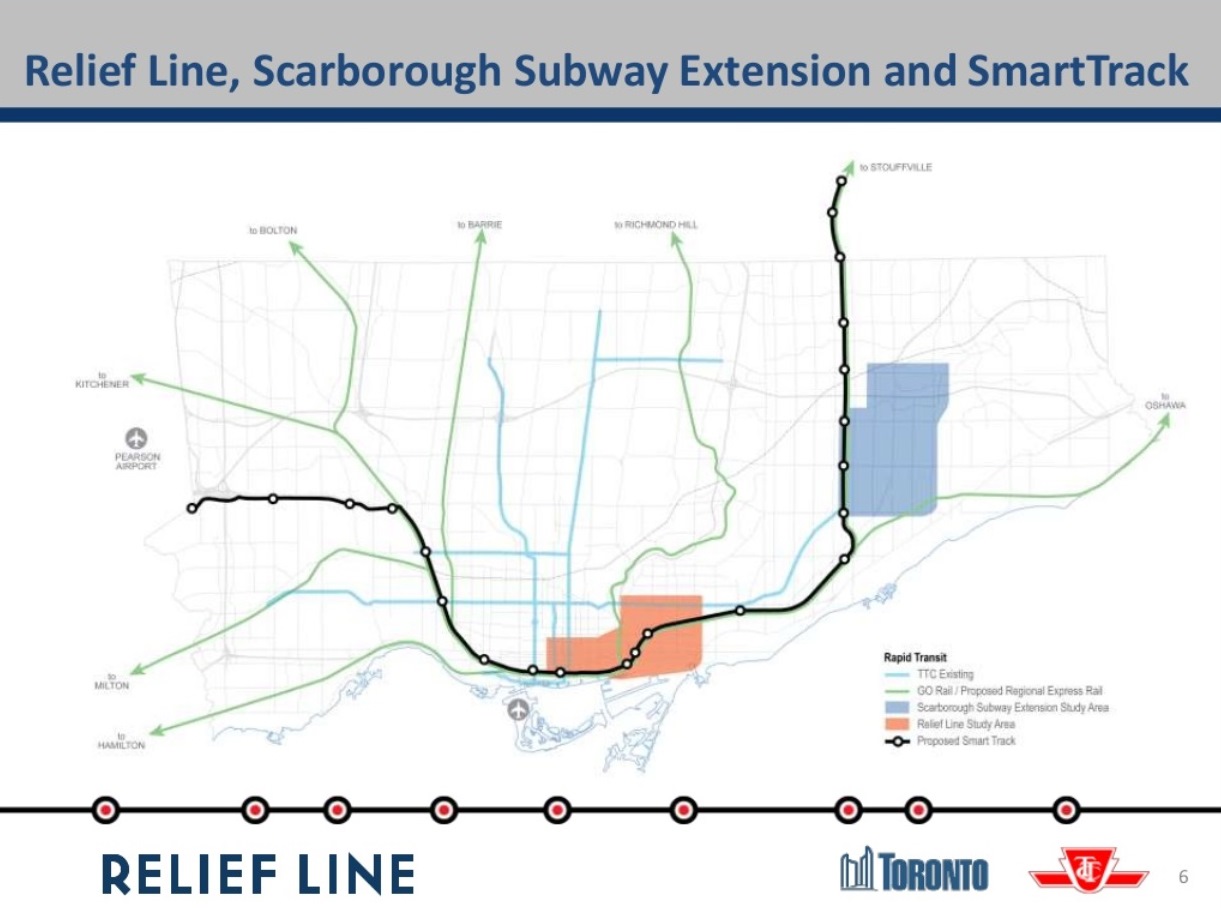
Slide 6: The context for the linked studies is the GO Regional Express Rail (RER) planning, the Scarborough Subway study, and the SmartTrack scheme plus, of course, the Relief Line. (Note the error on the map which includes GO service to Bolton as part of the RER.)
Slide 7: An important quote: “SmartTrack is expected to provide some relief to the Yonge Subway and may delay the need for the Relief Line. This needs to be assessed.” Yes, most definitely,and with a realistic view of the network function SmartTrack is likely to offer given constraints on its service level in the GO corridors. Too much hype from the mayoral campaign painted SmartTrack as a single project to solve all problems to the extent that the Relief line would not merely be deferred but wiped off of the map.
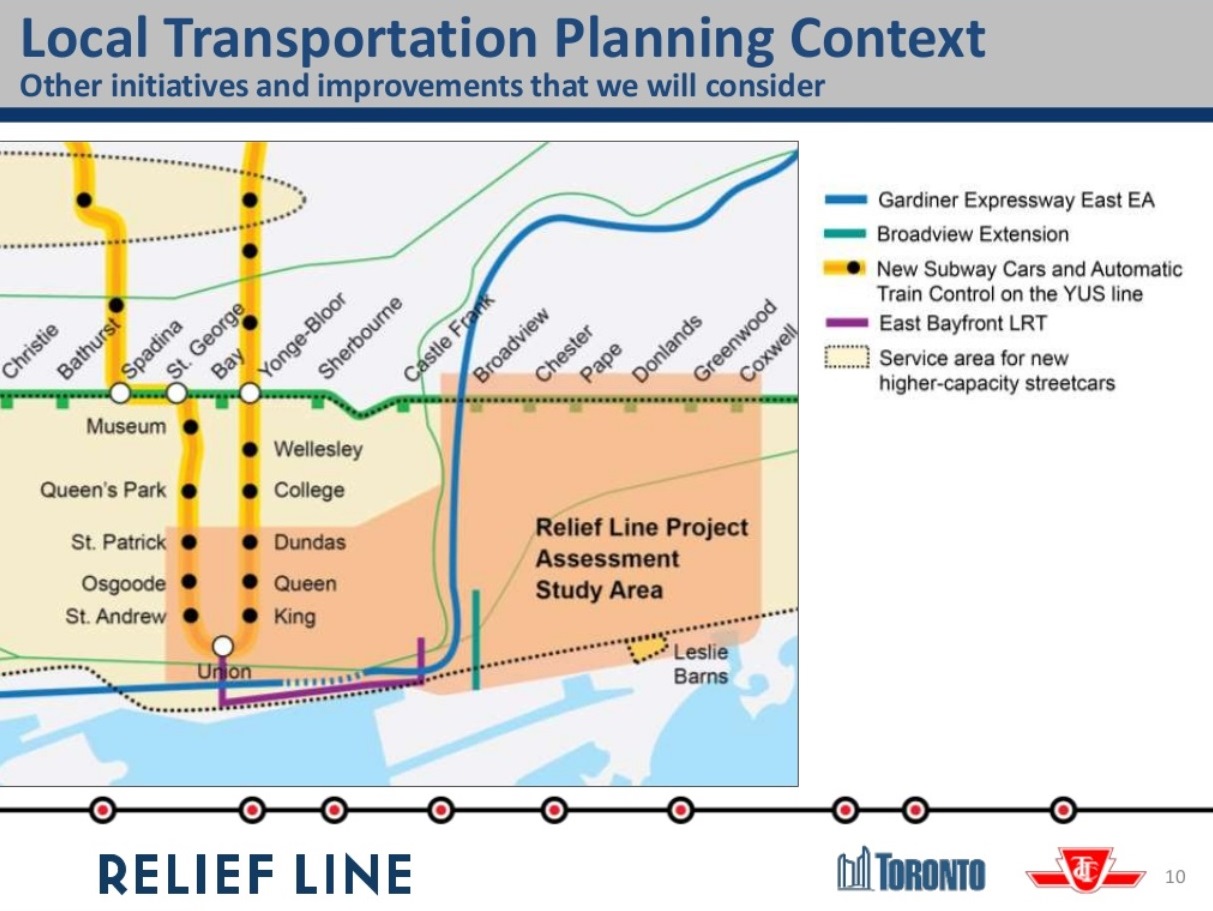
Slide 10: The local network context, the “study area”, embraces the core area from Dundas south to Union Station and a wide swath of the east end from the Don River to Coxwell. One part of the wider context is the question of the future role of the streetcar network with new, larger cars and with the demand effects of anticipated developments in new and existing residential areas. This has not received much attention in the larger context of the transit network, and it has only a small political constituency. Other related projects include the East Bayfront LRT (plus eventual extension into the Port Lands) and the Broadview Avenue extension. Because SmartTrack is very much “flavour of the day”, there are already attempts to downplay the role of the streetcar/LRT network with the false premise that the fine-grained service of a surface transit grid can somehow be replaced by a handful of rapid transit stations. This thinking has even infected the Relief Line study as we will see in a few slides.
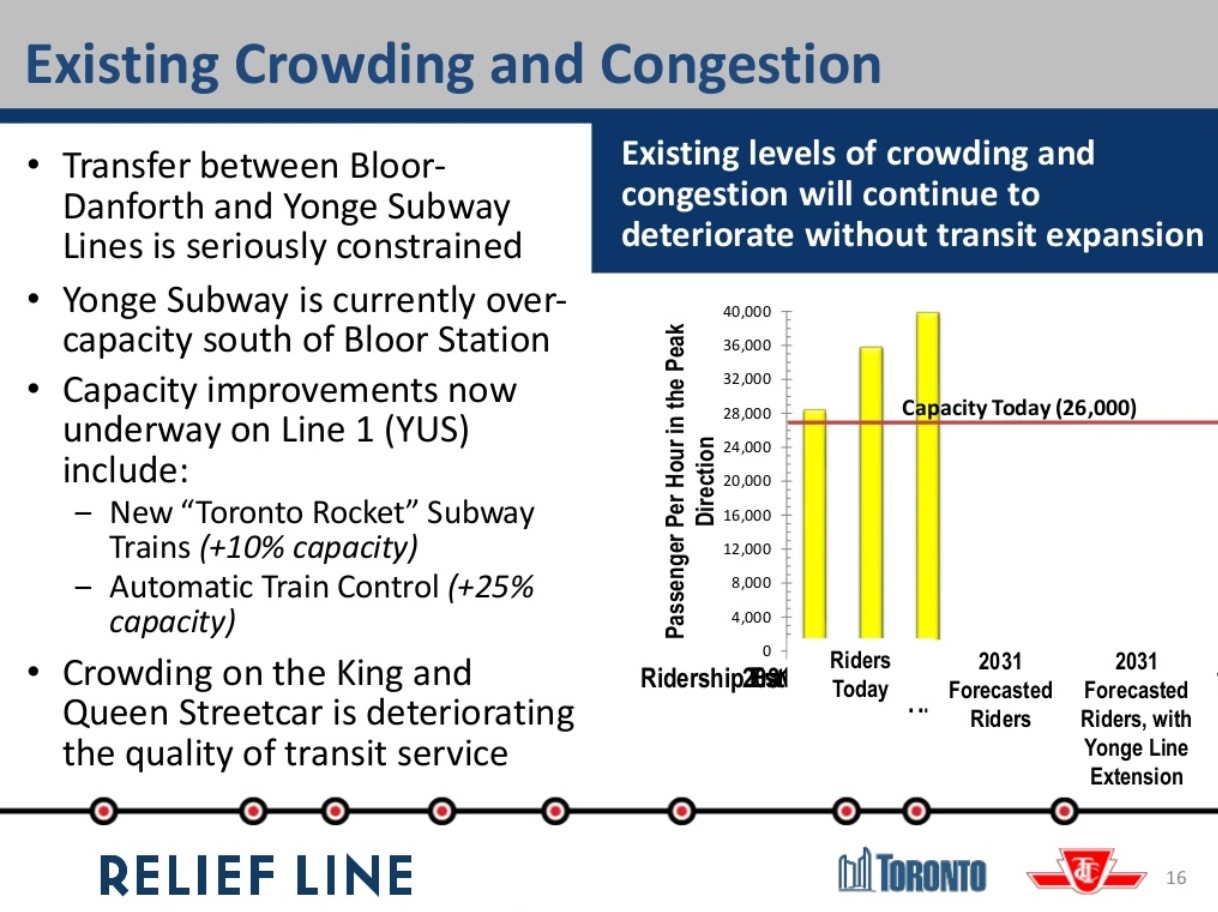
Slide 16: Both the City and TTC acknowledge that there are severe constraints at Bloor-Yonge Station. These arise not just from train capacity, but from the ability of the station platforms and circulation systems to handle the projected volume of passengers. The chart shows a current capacity of “26,000” although the line is actually drawn at the “27,000” mark. This reflects 26 trains at 1,000 riders each per hour, the line as it was when served by the T1 car fleet that has now shifted to the Bloor-Danforth line. The new Toronto Rocket (TR) trains and their 10% added capacity are already in place on Yonge, and the actual capacity of the line is just over 28,000 per hour (26 trains at 1,080 riders each). More can be stuffed in on a peak, crush load basis, but the line and stations cannot operate on a sustained basis at higher levels. Saying that there is a 10% future growth is misleading because the capacity is already in place.
Oddly, there is no reference to the expected 7-10% drop in Yonge line demand that will come when the Vaughan extension opens in 2016 or 2017.
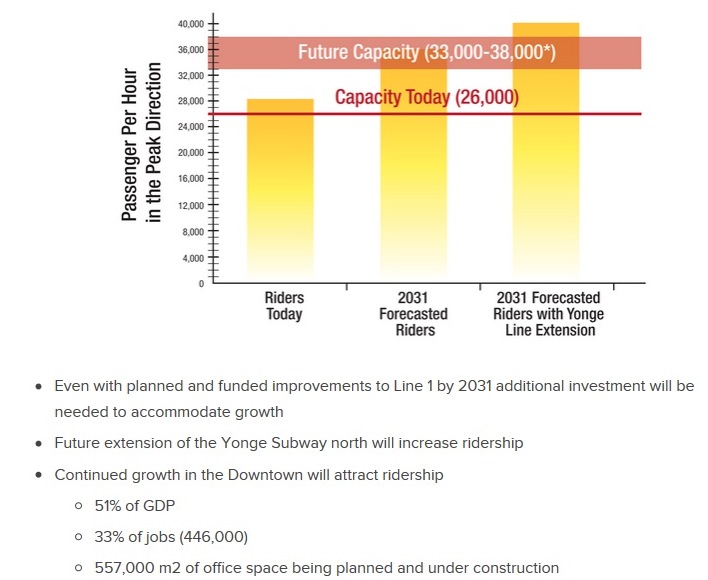
A better chart can be found in the “Challenges” section of the website where the formatting is not distorted, and the 26k screenline is placed correctly. The notes below the chart cannot be ignored. Half of the City’s GDP is generated downtown, and one third of all jobs are located there. The pool of office space is growing and at a rate that dwarfs anything happening in the suburbs.
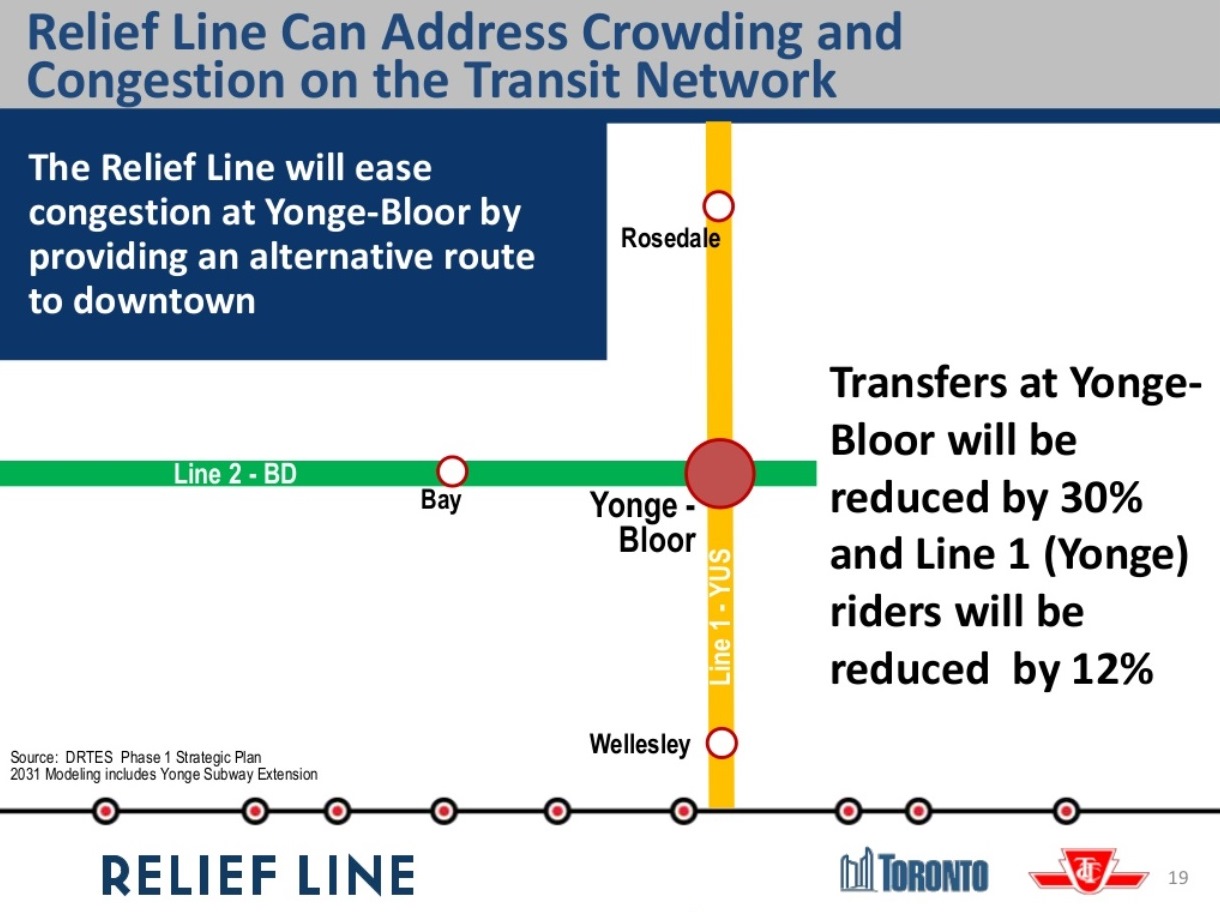
Slide 19 projects a 30% reduction in east to south transfer traffic at Bloor-Yonge and a 12% reduction in line demand south of Bloor
Automatic train control is expected to increase capacity by 25% with reduced headways, the time between trains, down from today’s 140 seconds to about 110 seconds (this is equivalent to a change from 26 to 32.5 trains/hour). That would take the route up to about 35,000 passengers per hour. The range cited in the presentation is 33-38K. Past TTC claims have shown capacities above 40K, but this would require heroic changes to the infrastructure and operations of the Yonge line that would be difficult and very expensive. Similarly, proposals for longer, 7-car trains, are a possibility when the next fleet is ordered in the mid 2020s, but there are physical constraints in many locations throughout the network based on the standard 75-foot x 6-car trainsets that have been used for decades. That would add a potential 10% to line capacity, provided that longer trains were technically and physically possible.
The DRL vs Yonge expansion debate has always been clouded by its focus on the high cost of any new downtown subway, but the cost of retrofitting the YUS to handle larger passenger volumes, and the exposure to greater effects from a single failure in the core area, are never mentioned. A proposed $1-billion expansion of platforms and circulation at Bloor-Yonge is never mentioned as an offset to the cost of the DRL, nor are the extra trains the YUS would need to operate at a higher capacity. To say that this skews the argument against a Relief Line is an understatement.
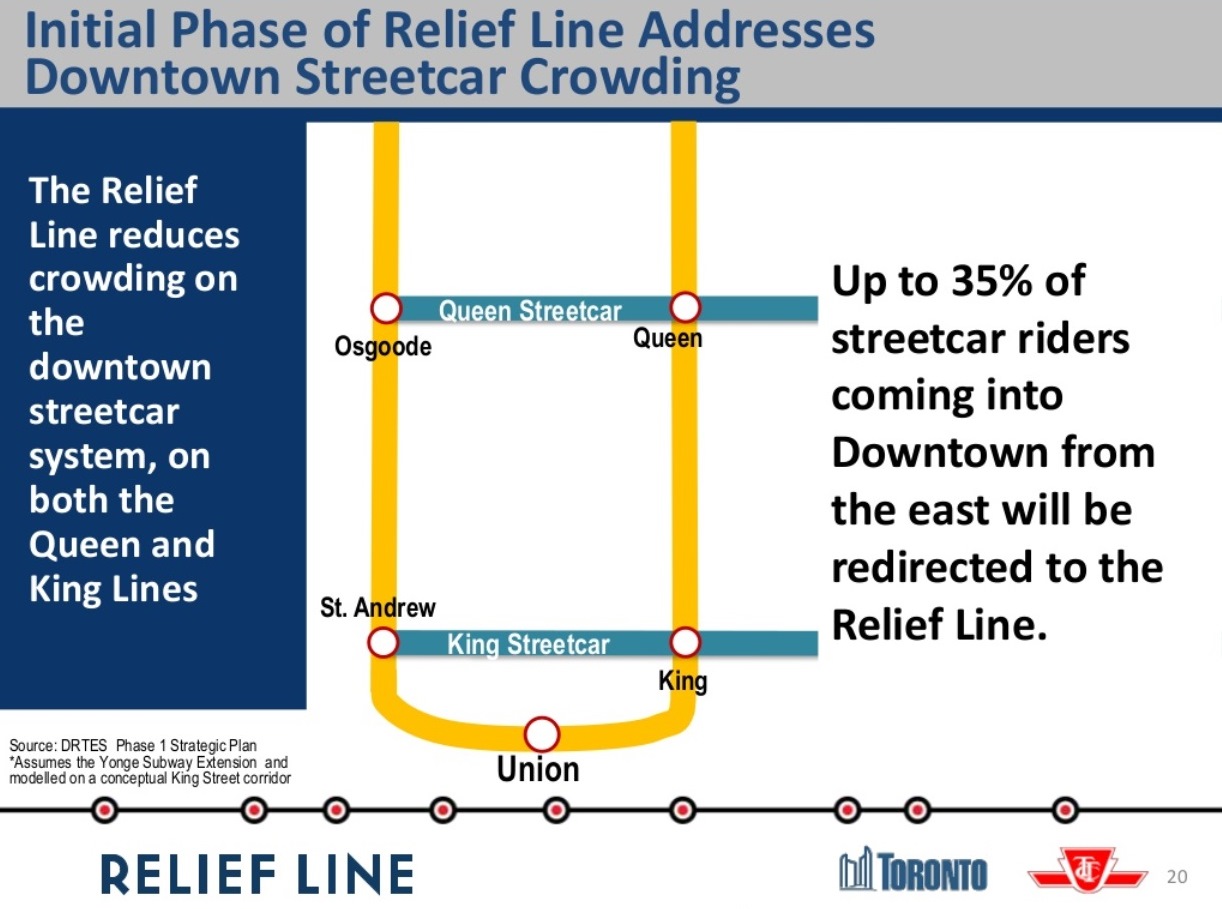
Slide 16 also claims that “crowding on the King and Queen streetcar [sic] is deteriorating [sic] the quality of transit service”. On Slide 20, we see a claim that a Relief Line could reduce streetcar demand by up to 35%. This is based on a King Street alignment for the Relief Line. This is nonsense on a few counts.
The Queen car to the Beach suffers from two basic problems:
First, there is not enough scheduled service – peak service runs every 5 minutes on a line that once had cars every 2 – and far too many of these cars never reach their destination at Neville Loop. The problem is not one of limited street capacity, but of service level and reliability. This can be fixed tomorrow, and a Relief subway is not required, only the will to operate more and better service.
Second, reduced demand implies that riders who have finally gotten on to a Queen car would choose to transfer to the Relief Line. If we we know anything from the Scarborough debates, it is that riders do not like to transfer, especially if this exposes them to the elements. The trip from south Riverdale to the core is relatively quick because there is little congestion on that part of the route. Any travel time saved on a DRL must be balanced against the extra transfer and wait time, plus access time from a downtown station.
As for the King car, it accumulates a substantial load at stops along its route down Broadview and west (eventually) along King. It does not leave Broadview Station packed with transfer trips from the subway. Moreover, if there is a capacity issue on King, it lies more to the west of the core, an area the Relief Line will not touch in its first stage, if ever.
What seems to be happening here is “mission creep” in an attempt to show how much the Relief Line could do. Such efforts might better be directed at talk of redevelopment on the DRL extensions, notably the benefit of heading north through Thorncliffe Park to Don Mills & Eglinton. Alas, that is outside of the study area and therefore ignored.
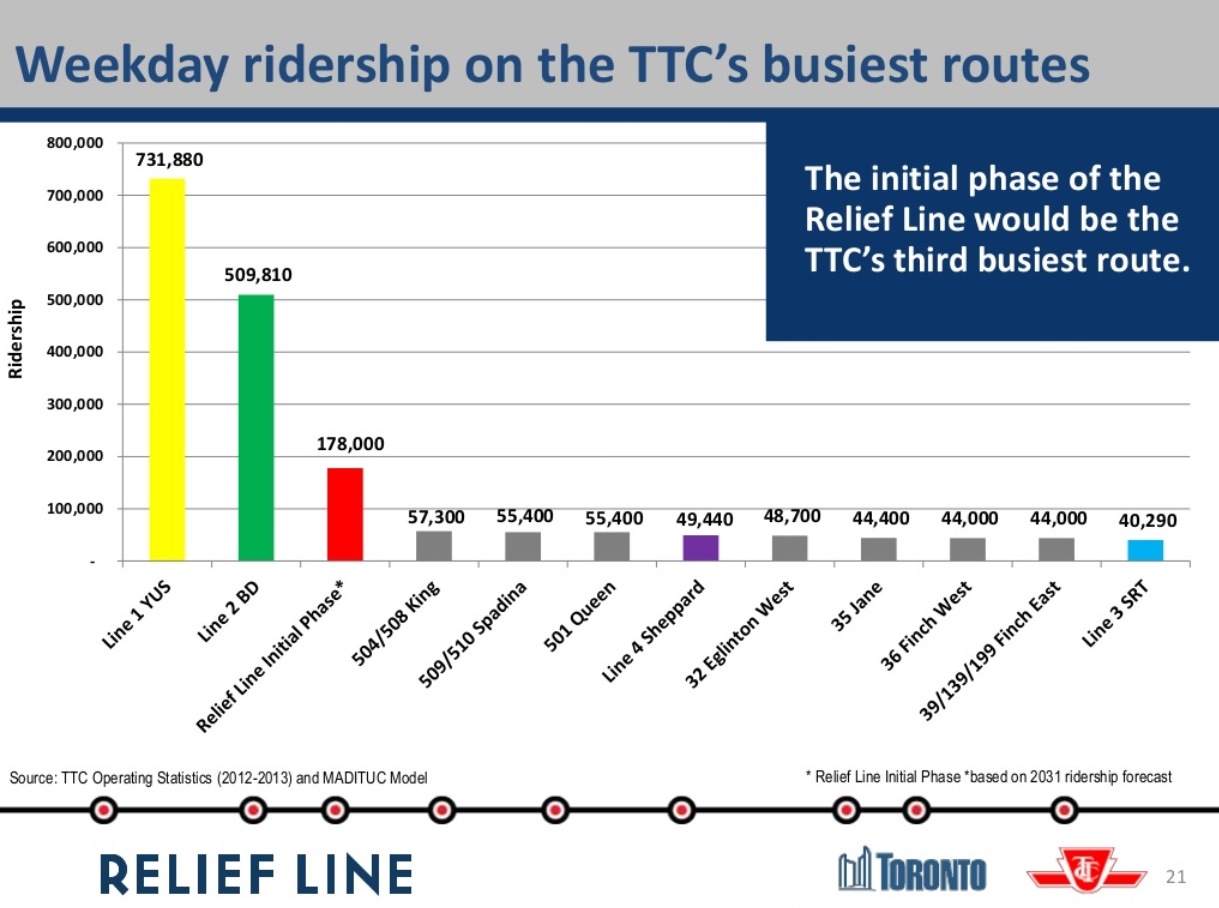
Slide 21 places the Relief Line in the context of other transit projects. With a daily 2031 ridership of 178,000, the line would outstrip by far all of the heavy surface routes, as well as the Sheppard Subway and Scarborough LRT. Although not shown here, I suspect that the Scarborough Subway and the eastern leg of SmartTrack would not fare as well as the DRL either.
The remainder of the presentation takes us into the station location issue I have already discussed above.
Advocacy for the Relief Line
The Relief Line has few friends and is beset by numerous accusations that it is somehow a sop to pampered downtowners rather than a much-needed network improvement so that there will actually be capacity for riders into the core from all over Toronto. [Note to commenters: don’t even think of trotting out those arguments again here. You have made your point in other threads, bogus though it is.]
“Relief” is always something for another day, or another proposal such as RER and SmartTrack. What we will almost certainly learn as the Metrolinx studies advance is that there is a limit to the demand the commuter rail network can handle, no matter what colour or logo one puts on the trains. There are physical limitations on individual corridors, and a combined limit on train and passenger volumes at Union Station. The rail corridors can divert traffic particularly from the outer 416 and inner 905 away from the subway lines, but the fundamental problem is that there will be more demand into the core than capacity. The Relief Line cannot be wished away by election rhetoric, and ignoring the eventual need for a new central subway route is folly. Sadly, Toronto Council and Queen’s Park are very good at “folly”.
What is badly needed is real advocacy for the DRL for its potential role in opening up capacity to the core and to areas beyond the core an expanded route can serve. This is an economic development issue that will benefit much of the City, not just a few blocks near King and Bay.
Picking ideal station locations on the first, truly “downtown” stage of the project perpetuates the idea that this is somehow a route to take folks from Riverdale to the business district when the Relief Line’s role should be much greater. Toronto needs to talk about that wider context and build a constituency for the Relief Line beyond Danforth and University Avenues.

corrected
Steve, how do you feel about good usable buildings in Downtown Toronto being torn down to be all replaced by almost identical looking glass buildings which rain down glass onto pedestrians every now and then? A Downtown Relief Line will make the problem much worse. Countless historic buildings continue to be torn down in spite of heavy opposition from locals and local history geeks as there is just too much money at stake for developers. While I recognize the need for some sort of a Downtown Relief Line, I don’t want it to change neighbourhoods important to me beyond recognition. Even if developers want to build skyscrapers, why can’t they build something like the Sun Life Building or even the skyscrapers we have from the sixties and seventies which don’t rain down glass and are more fire resistant, structurally stronger, and visually more appealing than the glass boxes that are going around all over Downtown?
Steve: Two separate points here. First, new buildings will be erected downtown whether there is a DRL or not. We can see this already in what’s a-building, approved and in the application pipeline. Glass buildings do not have to be safety hazards, but that’s up to good engineering and quality materials.
As for tearing down old buildings, that will happen in the absence of a strong protocol to prevent it. It is not the transit line that is the threat, but the spinelessness of Council in dealing with pressures from developers and the absence of strong enabling legislation from Queen’s Park.
LikeLike
Did Steve or anyone comment on Marcus Gee’s column?
Steve: I have not commented. Generally unless there is something really outrageous in an opinion piece that needs correction, I don’t get into a tit-for-tat with other writers. I have enough of that with people who leave comments on this site.
LikeLike
The OMB is the major problem here, combined with the City not adequately funding heritage – Berardinetti tried to cut some of the new planners they were hiring to deal with the heritage backlog that lead to the demolition of Stollery’s and other buildings.
The real problem as I see it is that the City’s priority HAS to be to get new development in Scarborough to pay for the Crosstown, and then the subway… there is only so much housing demand each year (16,000-20,000 units) and the market for where people want to buy and developers make the most profit is actually in the Core and in places like The Beach, Bloor West Village etc. where inappropriate condo towers are approved, often with the support (or lack of opposition) from City Planners and Council.
We cannot afford more Sheppard subways where development doesn’t happen until 20 years after transit is built – it is a waste and the operating costs on all those new lines will kill us – plus the TTC is at capacity Downtown and what we need is for people in the suburbs to take transit to jobs in the 905 and elsewhere outside the core.
Too often we are stuck in the idea that everybody lives in the suburbs and commutes downtown – the “monocentric city” – not true, and some of the worst congestion is in the suburbs. Oddly enough, we are going to spend a fortune on SmartTrack GO and a DRL (???) but what has happened is that so much of the land Downtown is now condo and there are not many sites left for office towers – once the South Core is built up, where will the Financial district expand to? The Kings were the obvious choice but have not been protected. The Mirvish/Gehry site really should have been an office building as it is on the PATH.
LikeLike
But they don’t have to be built east of the Don and ruin whatever little heritage and green space that remain in Toronto. A DRL east of the Don will do precisely that and so much the better if it is pushed to the west side of the Don.
Steve: You are saying there is nothing worth protecting west of the Don? Sorry, but the routes to the west bring many difficulties, including heritage. The DRL belongs east of the Don. The real issue is to identify buildings/neighbourhoods that must be kept and work around them.
LikeLike
Mathew N wrote: “Let’s look at your points of cost savings…”
1. Hmmm… Subways cars are cheaper per passenger than LRTs streetcars – only true if the vehicles are full. A minivan or school bus is cheaper per seat than a Honda Civic – but if the seats are empty you are paying more… and of course you need 6 subway cars and they run all the time – you might need more than one LRT T1 during peak hours, but in the off hours. Based on this argument we would never build another LRT or the Crosstown was a big mistake.
2. With the DRL you have to cross the Don River twice – once at King, once at Millwood. At King, it makes no sense to go above ground and now the area is built up on both side of the River unless the DRL runs well south of Queen. At Millwood, given the difference in elevation between the table lands (Street level on Overlea and Pape) versus the valley bottom, it is unlikely the whole thing would be tunneled under the Don Valley – and going up and down uses more energy than keeping it close to level. Bridges are cheaper so I think it should be considered a near certainty UNLESS there is a desire for a station to connect with the railways lines.in the valley.
3. This bridge is free – so in that sense it is a saving or a freebie. The real saving is that from the Bloor Bayview ramps to well north of Pottery Road. Some of this would be elevated like the current SRT so this uses up some of the savings from not having to build another Millwood bridge.
4. and 5. Until there is a destination, ridership will be minimal (the DRL to Eglinton, I assume)? Then why build it? Opening sooner means faster relief of Bloor Yonge – which is the whole point. I still see little point for going north to Don Mills and Eglinton for decades – the ridership just isn’t there and there are too many other projects already prioritised in the queue.
6. Reusing Lower Queen is one option – it could go under King or Wellington etc. and connect to the eventual west leg of the DRL if it is ever built. Now, one advantage the subway has is you do not need to build a loop at the end point of the line – so a Subway/Heavy Rail DRL can go to King to University and end awaiting future expansion – for the DRL to also use LRTs T1s etc. means a loop also has to be built.
Personally, I would love to see the return of streetcars to Richmond and Adelaide, or even to bury the streetcars from Moss Park to just east of Spadina.
Maybe Steve can answer this, but has the TTC ever studied the entire streetcar network to see how it could be expanded or new routes added in the Core? I would guess not because of course they wanted to get rid of them entirely in the 60s.
Steve: Actually the TTC did look at this issue years ago, but came up with only minor additions. Actually I happen to agree with them. If there are to be new lines, they need to be in new territory such as the waterfront. We need to deal with the amount and reliability of service on existing lines.
LikeLike
Which bridge is free? Are you proposing to put streetcars/LRT on the Millwood Bridge? I thought that the ability to carry streetcars, built into this bridge in the 20s was used to put in the extra lanes. Does it still have the strength to carry the extra lanes and the LRT?
Steve: This was discussed during the Don Mills LRT EA, and the answer is “no”. They even looked at whether some sort of light-weight trackbed could be fabricated to reduce the load. In any event, there are problems with curve radii at both ends of the bridge.
Yonge is getting very difficult to board from Eglinton south in the a.m. rush. Diverting some of the Eglinton Crosstown traffic will reduce the load on Yonge. Also if there is a station at Don Mills and Eglinton some of the load into Kennedy, Warden and Vic Park might choose Eglinton and DRL into the downtown depending on the latter’s route through the core.
I do not believe the claims that the TTC makes about the ability of Yonge to handle all the extra traffic they say it can. The DRL will be like the University Subway was when it started — mainly peak but as ridership grows it has become more heavily loaded. Going to Don Mills and Eglinton will generate a lot of traffic at Flemingdon Park, Thorncliffe Park and Don Mills and Eglinton and improve those areas.
Is it? I thought that the ability to use lower Queen was removed by the parking ramp from the south side of Queen to the city hall underground parking. Perhaps Steve knows. I also think that Queen St. is too far north for the office demand which seems to be moving south.
Steve: Reusing lower Queen is difficult because part of the space has been consumed by other structures, and because it has nowhere near the physical capacity an interchange with the Yonge line at this point would require. Any new Queen Street subway would have to get under both the Yonge and University lines. It will also have to avoid the parking ramp and the PATH walkway under Queen, but I don’t think this is impossible. The real issue is that Queen is the wrong route for a DRL.
LikeLike
@Brian Graff
I think the real discussion surrounding the DRL, needs to focus on its short, medium and long goals for transit in the area, and across the city.
Short Term:
Additional capacity into the core – using existing space on Bloor/Danforth so DRL connect the Danforth to the core directly.
Medium and Long term and in my mind just as critical as connecting the Danforth.
Transit needs to improve access across a larger chunk of the city and the DRL needs to facilitate that by connecting a broad network of solid surface transit
1 – does not need to fight its way to the Yonge line,
2 – Provide capacity to support continued growth
To meet the longer term goal, means that we need a DRL to get someplace where there are roads wide enough to allow it to meet either LRT or BRT routes that provide the wider access.
Yonge is pushing its capacity now well north of Bloor, and if you accept that transit ridership should be allowed to grow and that rate will be about 2.5% – natural ridership growth would be 41% in the next 14 years. An alternate path needs to be found that will facilitate the growth, and ideally actually draw ridership, and increased density and population above it, as the alternative is sprawl occupying even more of the 905 or worse stagnation.
LikeLike
It’s a bit confused over topics, but it isn’t wrong in that ST is the political priority and the DRL is playing second fiddle until ST gets knocked down to size. Assuming Toronto can secure upper government funding, an 3.8% increase in property taxes would be needed to increase the debt ceiling an equal amount as used for a $5B price tag.
Incorrect. As a subway car and an LRV have the same capacity (within 1 person), it doesn’t matter if there is one person or 250 people in the vehicle.
Another fallacy. If desired you could have subway consists of 2 cars or 1 car if driverless. Likewise, frequency of service on either subway or LRT is based on demand, and vehicles can be added to and taken out of service as required up to the line capacity.
Steve: A caveat here. If subway cars are to run in shorter trains, then the minimum unit (pairs for T1 cars) must have all equipment on board to operate independently. The TR unit trains share equipment over the six car set. A simple example is that an ATC control is needed for every “train”, and the longer the train, the less the per car cost.
A non-sequitur. The argument is about vehicle costs, not system costs. Your initial point was that LRV offer a cost-savings over subway cars, which I dispute. I do not dispute that LRT can be cost competitive and efficient to capacity needs in some circumstances.
This is only a problem with your west of the Don alignment.
So you have a free bridge in comparison to no bridge, net savings zero dollars.
The general premise of the DRL is network relief and connectivity. Just like the Sheppard Subway that doesn’t really go anywhere (I live within 1km of each of the stations on the line over the last six years), unless it’s a convenient alternative, ridership will be minimal.
I am now confused, this was a discussion of a LRT eastside/subway west alignment for the DRL, no? If your suggestions are all for a Don Mills LRT, then that’s another kettle of fish that serves a different purpose with different constraints and would be a welcome addition to the system.
LikeLike
Although I agree with most of your comment, I would add that the primary deficiency of the methodology is that it does not adequately address the primary objective of economic competitiveness and equality of opportunity with respect to the underlying dynamics of the labour market and exogenous macroeconomic forces.
Let us look at the $13.52/hour figure the existing methodology uses to price the average person’s time when traveling. Now aside from the fact that $13.52 is not going to allow the system to be competitive with the automobile it will create a litany of unpriced externality costs. Since the downtown is likely to remain an important driver of growth, a system that undervalues time will negatively skew the perception of communities the further away they are from the downtown. Doing so will only exacerbate the already existing political polarization, while at the same time underutilizing a large portion of the human capital available in the region.
LikeLike
I would argue that there is a strong correlation between the cause of the political polarization and the dynamics that emerged as a result of post NAFTA economic transformations. Transparency would help identify that the existing valuation of a person’s time used by the existing methodology is not in line with the market and is negatively skewing the way transit projects are being evaluated.
LikeLike
Surely someone must have developed or retrofitted a double-headed streetcar/LRV for this very purpose.
Steve: I avoided mentioning this as anyone familiar with the Metrolinx cars would know that they are double-ended.
LikeLike
Go to my powerpoint.
Drive down Rosedale valley Road and you will note 2 massive bridges go over it. One bridge is all concrete and looks very modernistic – built in the 1960s, this is what the subway runs through. Beside it is a bridge that looks exactly like a short version of the Prince Edward Viaduct (The Bloor bridge over the Don Valley with the subway in a lower deck) … this bridge over Rosedale Valley also carries Bloor on top, and also had a lower deck built into it, but when the Subway was built in the 60s, they didn’t use it for the subway … because to have a subway station at Castle Frank with straight platforms meant the alignment of the subway was too far north to use this bridge.
For years I would drive on Rosedale Valley – both bridges are wonderful structures but I was puzzled.
So this second bridge with Bloor on top and the unused deck was built to carry a subway, but can’t and so the TTC, as far as I know, has just ignored the potential of the unused deck. Because LRTs can turn using a much tighter radius, it is possible to built an underground LRT line and have a station just south of Castle Frank…. nothing like this can be done at Sherbourne, or Jarvis.
At the very least, the TTC should investigate using this bridge with the decks already in it and finally linking the streetcars (or LRT) into the subway… much as the streetcars on Spadina never ran as far north as Bloor prior to 1966, when the Spadina LRT was built, for the first time streetcars could go north of University circle.
Steve: The TTC did not use the Rosedale Valley Road bridge because the curve radius for the subway at Parliament Street would have been too tight. When both bridges were designed, the target technology was what we would now call LRT, but was then to be suburban railways coming into a never-built downtown streetcar subway tunnel.
Also, streetcars on Spadina ran to Bloor Street until the Spadina carline was converted to buses in 1948. The track remained in use until 1966 when the Bloor car became the BD subway.
Your proposed alignment requires a level crossing between your LRT line (which would be at the level of the bridge deck just beside Castle Frank Station) and the subway just to the north. I don’t think TDSB would be too happy about your digging up their lawn in front of the school to build a loop. Also, I am not sure how far out from the building subsurface structures may protrude into the space you plan to use.
Next you follow the side of the hill north of the station, and this will require a bridge to get over the valley that runs off west from where the DVP ramps connect to Bayview. Further north, you will intrude on the Don Valley Brickworks including the open pit once used to mine clay. This is a geological site of considerable interest. Finally, you follow a hydro corridor (a no-no) to get over to Don Mills Road.
Your route is fouled up in so many ways, I am not even going to bother with the issue of taking it downtown via Parliament.
Please consider this topic closed. I will delete any future comments on this matter.
LikeLike
You posit that political polarization correlates to NAFTA? As such, we should have seen minimal polarization prior to the 1990s, and not say Western Canada being firmly Conservative after the NEB of the 1960s? I would posit that political polarization tracks more closely to income inequality, and that NAFTA economic transformations co-correlate to the underlying factor.
I’m all for transparency, but it is neither a cure-all for planning problems nor palatable for our current crop of political parties.
LikeLike
I did and I am not impressed. Steve has pointed out the same problems that I would have. I would be careful about placing all my degrees on something like this. Having a degree does not make one an expert in the field just as not having one does not make one incompetent in any field. The important thing is the wisdom of one’s arguments. I have two degrees, one of which I consider a joke, and enough credits for a third from courses I took out of interest. I never applied for it because it would prove nothing. One of the best IT persons that I know has no degrees.
LikeLike
There is publicly available data at the University of Toronto’s Centre of Urban and Community Studies that will illustrate the relationship between NAFTA, income inequality, and political polarization. Although you are right to imply that the relationship is not perfectly causal, I would say that the relationship is strong enough to demand attention, and a reasonable solution.
You are right to compare the transformations in the inner suburbs to the NEB in Western Canada. They both represent public policy that was intended to promote the greater good that consequently had localized negative consequences. For public policy to be effective it must take measures to mitigate the negative externalities of its primary policies.
LikeLike
I would fully agree that $13.52 is a complete artifice. I have no idea how this number was derived, as the average per hour wage is higher, and one cannot perforce simply imply that people would choose to work the next hour. Further we should not be using after tax earnings, but rather include the full value of that time (which could potentially include contribution to margin) for a least the gross earnings amount. The rate essentially implies that we are dealing only with relatively new entrants to the labor force, which might make sense for the transit system in Sarnia, Windsor, or even London and perhaps Cambridge, or even Whitby or Ajax, but not the city of Toronto, and especially not for those core bound.
A peak at the general national wage table would verify that.
I suspect that this number ($13.52) in Toronto would be closer to the foregone income tax number. (That is they care not about our value of our time only the taxes we might have paid).
However, as I have said before, I think that this is the least of its issues. I do not have the impression (although it is not clear to me) that the level of granularity information for origin and destination are not fine enough, nor is enough done to compare networks of potential routes as opposed to individual lines, or what could/should be done with regards to bus route realignment. I strongly suspect this based on the results they get from things like the increase in ridership at peak point from extending a DRL north of Danforth and like things.
Yes they do not value time enough, nor do they do enough to actually do evaluate trip selection or how people would alter their trips based on their own valuing of their time.
Steve: It is extremely important to distinguish between the trips actually taken by current riders, and those that might be taken if there were a significant change to the network and/or service quality. O-D info already exists in the regular surveys done by the UofT for the Ministry of Transportation and other sponsoring agencies. This covers all modes, not just transit.
Yes, with smart cards we can track a higher proportion of transit users at a finer granularity, but I must return to the basic operational question: if doing so interferes with the ability of riders to move freely through the system and negates the supposed benefits of PoP, then we have let technology and “research” get in the way of providing transit service.
LikeLike
I have seen the summary of this information, and in my perfect world – I would like to see a highly resolved version where origin and destinations were being used in a computer model right down to the postal code level (section and side of street). This would perforce have to be collected in some way other than by transit as it would need to include drivers and of course people walk farther than this at either end of their trip. My own thought for modelling purposes would be it would need to be employer or institution based data and it would need to be used in a manner that would not likely see public release (so I would never see it, and I do not have the impression they have it, but perhaps they do), however, it could be collected from ADP type sources (I do not know whether you could get enough privacy built in to allow Revenue Canada to share this type of data).
I can certainly see 2 problems here – 1 could be resolved with RFID chips that had a longer range used in the actual doorways as they would detect the passengers passage – however this issue could likely be proxied using the matching return trip. The other – more critical would of course be those who chose to drive.
P.S. I would not see collecting the data for origin and destination of a frequent basis like the current survey – but only infrequently – like a census – every 5 or 10 years.
LikeLike
As for the Millwood bridge, I have wondered if it could be reduced to 5 lanes (1 reversing lane), assuming that traffic is generally one-directional at peak. Then build segregated bike lanes to keep vehicle traffic closer to the centre of the bridge. The main trusses on bridges are often stronger, and easier to strengthen. Traffic loads out on the cantilever of the bridge are usually the critical case. This may free up some capacity to carry the weight of transit underneath. As for the turn radius, I assume that the DRL will have to make a number of curves so maybe a smaller metro or SkyTrain would work (to be compatible with Eglinton – haha).
That being said, a new bridge would probably be about $300M to $400M – a large but not insurmountable amount.
Steve: If a route is not constrained to use the Millwood Bridge, it could swing east sooner and aim directly at Thorncliffe Park. The total route mileage could be smaller, and could offset the cost of a new bridge east of the existing one. Any subway bridge would be at a lower level than the road bridge.
LikeLike
The other question would be the relative costs of forcing a route via this Bridge, vs tunneling, and the longer term costs of using yet another vehicle in the TTC fleet, unless you ended up using LRT vehicles already proposed for other areas. I suspect there is a great deal to be said to try and keep the commonality and flexibility of fleet to a maximum. So please can we either select something that can run in mixed traffic – and use the same vehicle – or something that at least could be used on the BDL and Yonge lines. While I have no problem with the Skytrain vehicles per say, the only place there is similar application is on the SRT, and it would need a major refit.
LikeLike
Raw data or only the studies? If you have any specific links, it would be helpful, but from the bit I’ve seen, it appears that they conflate NAFTA and globalization.
Australia makes for a good comparison as it’s outside a significant FTA until recently, primary is a resource economy with a side order in finance, knowledge, and manufacturing, and is a large low-density developed nation. There too, in the absence of NAFTA we have seen political polarization and income inequality rising over the last two decades.
LikeLike
Matthew – I would argue you are spot on. Wages – and their gap are partially a matter of supply and demand. The world market for labour in the lowest paid categories in Canadian manufacturing is very over supplied, and the labour market for areas in which Canada has a relative shortage – the world market is even more under supplied. Thus one would expect opening the market to the world by increasing the degree of trading would increase the wage gap. The issue is, I believe that the reduction in prices for those traded goods is greater than the loss in wages, hence everybody is very (very) marginally better off, but those in the greatest shortage are massively better off. This leaves those who gain only very marginally in a position where they are in effect left behind.
The issue in terms of transit must therefore be to make the highest earning jobs available to people – and that means reducing barriers as much as possible.
LikeLike
What is common in both cases is that the local economies are adjusting to significant exogenous macroeconomic forces in a way that creates serious negative social externalities. The presence or absence of a trade agreement merely changes the dynamics of the economic shift.
My original premise remains, for the selection of an optimal project the methodology used must accurately reflect underlying market dynamics, and use a full cost accounting model to accurately assess all costs including externalities.
LikeLike
You are absolutely right. I would add that we should not underestimate the value of having an accurate figure for time value. Let us consider the statement below.
If the projects are designed in a way that do not meet the individual’s perceived time value the project will fail to meet its goals, and fail to provide society with utility. An accurate time value will have a significant effect on everything from alignment to station placement.
LikeLike
Is there any talk of the alignment through Thorncliffe Park and Flemingdon Park yet, from the city or Metrolinx? Didn’t see any on the website. I imagine they will still have to run buses along Thorncliffe park drive just to ferry people to the new station.
Steve: There is nothing definitive in recent plans, but some of those from past decades clearly showed a line entering Thorncliffe Park from the south. The line would not venture east of Don Mills, and Flemingdon Park would be served from the west with one or two stations depending on the alignment between Thorncliffe Park and Eglinton.
LikeLike
I do agree – however, to begin to even approach this issue – they also need to be close in terms of being able to estimate the amount of time being wasted. I believe without having a decent resolution of origins, and being prepared to look at the impact of surface route changes, they have no way to properly calculate time wasted, hence no multiplier to use on the rate. The variance in the wage in my mind is the easiest data to address, or at least greatly improve the proxy. However, fixing the $13.52 would be ridiculously easy to at least get much closer. If all we did was use the national average wage rate we would jump dramatically closer, and it would be an easier number to start to justify ($24.96). However, it does not address the fundamental question of how to basic amount of time lost is gathered, and the network permutations that are examined in terms of comparative time saved. However, yes it is kind of a gimme.
LikeLike
This is completely different from your initial position, which lay the blame at the feet of NAFTA without talk of larger externalities. In addition, if you take a longer look at the Great Depression and surrounding times, you’ll see a similar pattern among inequality and polarization, but with the opposite trade effect. As such, my position remains that the correlation between NAFTA and these issues, while real, is a red herring.
While an inaccurate time value is one manner in which projections can miss the mark, an accurate time value doesn’t necessarily improve the project. To continue the Sheppard example, it doesn’t matter if time is at $3, $13, $30, or $1300, because the supposed adjacent development never occurred. As such, the average time savings is lower because people walk or bus to the stations, rather than living nearly on top of them.
Steve: I have a big problem with the whole “time saving” calculation that shows up in so many “Business Case Analyses”. The Sheppard Subway may in fact save some people some time, but if this is not considered in the wider context of comparison with other ways to spend the capital investment, then the “saving” is simply a soft money “justification” for building whatever you wanted to build in the first place.
Also, the value of time argument starts to come unglued when part of the comparison is a would-be transit rider who chooses to drive. They save lots of time, probably justifying their investment in a private vehicle. So much depends on which scenarios are compared or excluded that I find most (probably all) such calculations I have seen to be highly suspect.
One final point, should I assign a value to my time that is not work related? Many transit riders do not earn money, but certainly don’t value their time at zero.
LikeLike
PS. However, if they can justify a line using $13.52, and otherwise reasonable assumptions, it does make it much harder to argue against.
LikeLike
Well from a pure economic theory perspective, you would value it based on the alternative wage. However, I personally think you have to be very careful using the time savings except in valuing alternatives, otherwise you would likely create a situation where you would massively overbuild. There is a reasonable point where the disincentive effect of the required taxes would swamp the time savings in terms of social benefit.
LikeLike
For the sake of brevity I try to simplify my position to accommodate the medium through which we are communicating.
My original comment used NAFTA as a time marker to indicate the onset of a precipitous decline in income equality between the regions. In line with my comment on methodology the main point I was hoping to make was that public policy must take a progressive approach to mitigating negative externalities associated with major policy initiatives such as NAFTA for the purpose of reducing long term systemic risk.
LikeLike
I agree. Proper data is essential. My position on time value is intended to complement your position on trip origins and destinations. My suspicion is that perhaps a dual rate for time value would work better, that is one for surface routes that need to be more granular, and another for higher order transit.
LikeLike
I expect time value to be used in the calculation of the Net Present Value of a given project option. The goal is to determine the relative attractiveness of a given option by attempting to accurately value the underlying utility of the option to the individual. To use your example the development did not occur because there was a mismatch between the perceived value given to the site by the policy maker, and the real market value. The goal should be to eliminate as much as possible the difference between the two to ensure optimal utilization.
LikeLike
Is your idea for people to use your Parliament “DRL” as a replacement to get around south of Bloor Street if the southern Yonge line is shut down? What then? They’ll make their way to/from Castle Frank and Bloor-Yonge?
Those people would be better off either using the University line, Bay bus, or just walking to points in between Union and Bloor.
You bring up the R-word (redundancy) but you’re too blinded by your own pet project and completely miss the point I brought up regarding network redundancy on the Bloor-Danforth line.
The crossovers in the central portion of line 2 are 4km apart at St. George and Chester. This is the second biggest gap in the system behind St. Clair West and Lawrence West. In such an event as an emergency or interruption TODAY, the entire eastern half of the rapid transit system is cut off from the core of the system, and would continue to be cut off if your harebrained scheme were implemented.
Taking the DRL past the Don and past the Chester crossover ensures that there is an alternative path to the eastern half of the rapid transit system if the middle of line 2 is shut down for any reason. There’s the redundancy you’re craving.
LikeLiked by 1 person
Well, FTA was 1990 under Mulroney, and NAFTA was a few years later under Chretien.
About the same time Mulroney doubled the immigration rate and it no longer varied (inversely) with the unemployment rate – see this Ont Gov’t graph with projection.
The Ontario government was predicting that the immigration rate would increase from 0.7% to 0.9% in future based purely on speculation about federal policy
The idea that immigration would solve labour shortage has instead created problems related to growth and congestion, and if anything made labour shortages worse … but I think it also played a huge role in increased inequality – a surplus of labour benefits the wealthy and drives down wages creating a job market that favours employers … simple supply and demand here.
Thomas Piketty’s excellent book Capital in the 21st Century also has a lot to say on this, dating back to the 1970s if not earlier.
LikeLike
The medium through which we are communicating, requires neither brevity nor simplicity. The only constraint is the time that we wish to devote to elucidating our thoughts. If you only use NAFTA as a time marker, then an actual time marker has less associations. I agree, public policy needs to avoid the downside as much as possible, whether for long-term or short-term risk.
Steve: Another constraint, albeit a fairly generous one, is my patience.
In theory, I agree with you. In practice, the goal becomes justification of the desired project. Faulty assumptions used to generate faulty values used to justify faulty political maneuvering. Transparency can make it easier to find the initial faults, but it doesn’t improve that final step.
Your premise is lacking in both a global view and international comparisons. If immigration and a surplus of labour is the driving factor in wage inequality, then countries such as Japan and Germany, with negative population growth, should be seeing the inverse effect. However, this is not the case. The governing issue is globalization of industry and the resulting governmental inability to regulate effectively.
I’ll definitely have a read of Piketty, when I have time to pick it up, but from the data available online of his figures, it seems typical in so far as that he presents the data in such a fashion as to support his thesis. For example, he speaks of the minimum wage for the bottom and percent of income and ‘wealth’ of the top, but neither takes a global view of rising developing world wealth and income, nor the local view of direct comparison of the top earners and bottom earners, which is the actual definition of inequality.
LikeLike
Matthew – Piketty goes back through data prior to WW1 to show how inequality existed, it was largely reduced after WW1 and WW2 by government policies, taxation, etc., and then a reversal of those policies started around the 1970s – with the US being particularly interesting in that it used to have far less inequality than Europe (where the gentry and rich largely owned the land and often lived off of rents, including government bonds) – it is driven by data that others had not looked into – an impressive book.
Immigration is hardly the only factor – which was why I mentioned Piketty. Each country is different – for example, Japan and South Korea had amazing economic growth (1950s on to say 1997) with nearly zero immigration, same has been true of many European countries and certainly government policies in terms of fiscal and monetary policy – if you read Paul Krugman he is usually scathing about how irrational most government policies have been – rejecting Keynesian policies and favouring austerity when it was inappropriate.
There have been periods in our own history when we had even higher rates of immigration than we do today – like 1900-1914 when immigrants settled in the western provinces, and in the mid-1950s but under those specific circumstances the population growth was absorbed easily because of either people were homesteading in the West or in the 50s the world was recovering from WW2, huge parts of it had gone communist, and we had a baby boom. Meanwhile, the US had very little immigration from the mid-1920s until after 1965, when they opened the door much wider – so possibly immigration is a factor in the US as well, particularly post 1994 Mexican crisis when a lot of illegal immigration occurred – which has now ended.
But look at the US unemployment rate over the last 10 -15 years – it was lower than ours before the crisis, then was far higher, now it is lower again despite their lingering impacts on people and the housing market etc.
Immigration into Canada mainly goes into 3 areas – Toronto Montreal and Vancouver – though it has been shifting more to Alberta and other provinces the feds have allowed provinces a greater role.
Up until the early 90s (when immigration was permanently increased) Toronto always has much lower unemployment than the Canadian average – and it was a magnet for people from Manitoba and the provinces to the east (instead they have been heading farther west for at least the last decade given the lack of jobs in Toronto and the high wages in the West due to the resource boom). It also used to be that immigrants who had been in Canada for 10 years had both lower unemployment than the Canadian average, and higher incomes – this is no longer true – some immigrants do extremely well while an increasing number struggle or end up in the suburban apartment blocks where you find both the poorest people in Toronto and the high east levels of recent immigrants – because these things go hand in hand.
The issue is not so much government being “ineffective” as much as it is choices that have been intentionally made – like policies that gave us a high dollar and resource exports, choices like immigration, and choices that made it a religion that we have inflation of exactly 2% and to otherwise favour the interests of the few or certain elites or interests over the general welfare of Canadians.
LikeLike
Exactly – using wealth to compare to earnings is a false comparison. Someone who is young earnings is clearly more appropriate – retired wealth. Also you need to be conscious of how earnings are and will evolve over their lifetime (similarly for wealth). A retired former business owner – who saved millions – earnings cannot be used for any sort of comparison, nor can the wealth of a recent graduate.
Similarly, you cannot compare the transit spending (in isolation) of a very dense area with a very low number of lane miles per resident/employee to the transit spending of a very low density area with many 6 lane roadways. Areas that have a very high modal split for transit and few maintained roads will clearly need more transit, and more road use where there is a very low modal split for transit and lots of lane miles.
There is currently a clear issue with capacity into the core from the east side of the city. There will clearly be one as far north as at least Eglinton shortly after that LRT has been completed. Failing to address this issue will result in lower growth, lower wages, more unemployment, and a reduced tax base with which to address other issues.
Frankly the best data to use would be a reasonable forecast of ridership, and a proper understanding of the additional transit and connectivity any given project would enable. This is the core basis on which a DRL (or any other multi-billion dollar transit project) should be based. Equity is a false comparison, as it rarely takes into account anything but the narrowest of measures, and will not reflect many other factors that would balance the equation, and were critical in the personal choices that drove the location of residence. If I want a 60×120+ lot with a backyard and a park and soccer field nearby, clearly I am either prepared to pay millions, or subway is not a priority. If I am prepared to ride an elevator, and will settle for a 20×40 flat, perhaps I am doing so because being close to transit is really important to me.
LikeLike
If the line is to be opened in stages, would that necessitate a carhouse or yard “downtown,” or could existing yards handle demand? Where is the preferred location for a new yard anyhow? I suppose land would be cheapest in the industrial part of Leaside. Or perhaps someone may make a move on Obico yard.
Steve: A new yard, preferably in the west end to balance requirements at both ends of the line, would be ideal. I have not heard anything further about interest from Metrolinx and/or the TTC in Obico Yard.
LikeLike
Brian – Yes, Piketty does go back to 1910, and it does show the 1920s and 1930s had similar levels of income inequality. His basic premise is that wealth grows faster than productivity, except in cases of technological transformation and war economies. The 1970s didn’t mark a global shift in tax policies, but similar levels of stagflation were seen around the developed world (Japan and South Korea being major exceptions, but fall under Piketty’s first exception for tech).
I would argue if immigration is a limiting factor at all, but as you say it’s hardly the main factor. US immigration between 1882 and 1965 was limited more in source than quantity. During the Great Depression and WWII there was a significant lack of normal immigration levels, but those are historical anomalies, hopefully. As for the Mexican immigration ‘crisis’, I am expecting news that it has revived by this time next year, due to the strong dollar that has added 30% back to the peso exchange rate (it set a historical high on Wednesday for the new peso).
You cannot compare US and Canadian employment rates directly as they are calculated differently. The largest issue is the US exclusion of non-participatory workers, i.e. those that want to work, but have given up looking.
Canada’s population is mainly in 3 areas – Toronto, Montreal, and Vancouver. These three metropolitan areas represent over a third of the Canadian population. Over the past 10 years, the national share of the three has fallen from 72.3% to 59.9%, with Montreal rising 1%. In the same time Alberta’s share of immigrants has doubled from 7% to 14.1%.
The problem of immigrant unemployment could be positioned as a failure/barriers to recognize foreign credentials, which place highly educated immigrants into the same poll as those without advanced degrees, which on average have higher unemployment levels. The connection to the 1990s ties into the Canadian economy shifting westward with resources, manufacturing taking a nosedive, and the rise of the knowledge/construction economy in its place.
I agree that government policy has some effect on the economy and composition of the nation, but equally there are many factors beyond their control that makes many policy decisions irrelevant, counter-productive, or worse. High oil prices would have come with or without Canada gaining from the boom. Foreign purchases of our resource deposits would have continued without a mortarandum [??] by both the Liberals and Conservatives. We like to think the government runs the economy, but really the national and global economy dictates the choices available to our government.
LikeLike
Matthew – yes, you are right that the US unemployment rate normally quoted excludes more than the Canadian one – both Canadian and US governments collect more than one set of numbers, same as the money supply has different variations… Canada starts at age 15 while the US is at 16.
Certainly immigration was low to both Canada and the US in the 1930s yet unemployment persisted, while at other times too rapid labour force growth can be a problem – like in the 70s the high unemployment rates were partly due to greater participation from women and the baby boom coming of age.
Illegal immigration from Mexico has declined since 2008 – a variety of reasons including rules making it harder to hire illegals, lack of jobs, and the improvements to the Mexican economy. A large part of the surge in illegal immigration was the impact on farmers of NAFTA which flooded Mexico with subsidized US corn (the US also subsidizes sugar, etc. and is highly protectionist in some respects even with all these trade agreements).
The issue of credentials not being recognized is over-estimated – true of doctors who cannot find an internship or practice, but in many cases, employers don’t value foreign experience, language skills are inadequate or the skills/education are just not in demand. The points system failed in that it counted years of schooling and work, without regard to if it is needed in Canada. The Express Entry system just introduced favours people with an actual job offer or who can show that they have a labour market assessment indicating a need.
The point is that immigration only makes the economy bigger, it does not make the existing inhabitants/workers better off off on a per capita basis – in the early 90s the 3 big parties were competing to show who was most pro-immigrant and they all decided to support a target of 1% immigration per year (which would be 340,000 people) – the NDP still has this in their platform – and this 1% is not a maximum under perfect conditions but was irregardless of short term labour market conditions, like in 2008-2009.
Globalisation has had an impact – it used to be that there were lots of unskilled unionised jobs that immigrants from Italy or Portugal could fill, and the wives would work in the garment factories – no longer true of Toronto, or Ontario/Quebec.
This place is not really for economics discussion so I won’t continue much – government does play a major role, particularly in the long term in terms of what we import and export – in the 60s and 70s governments (including Alberta) chose to “diversify” the economy away from resources and reduce foreign ownership, then post-PE Trudeau, both of these have been reversed.
I suggest people read Ha Joon Chang’s books on economics like “Kicking Away the Ladder”, and on Immigration, download “How Many is too many?”.
Steve: Yes, although this debate is interesting, it is straying far from the topic of this site. There have also been a few comments that strayed close to the line seeing immigration (and by extension immigrants) as a source of a problem rather than the result of policies by a government we all elected.
LikeLike
No, they can’t. An accurate value for time is essential if they are to create accurate models. If they get it right without an accurate value for time it would be by pure luck.
LikeLike