
The TTC’s Audit & Risk Management Committee met on June 5, 2024 with a lengthy agenda. This article includes comments on:
- 2023 Financial Results
For the financial statements, I have attempted to explain the difference in presentation under the Public Sector Accounting Standards the TTC uses and the more familiar annual budget. The standards require the capital and operating streams to be consolidated including showing assets such as vehicles and infrastructure on the balance sheet. This arrangement swamps the operating results with the much larger capital values even though TTC’s assets are almost entirely funded by subsidies, and they do not represent a value which can be used offset operating costs.
There is a new provision in the capital accounts this year for the disposal cost of assets. This recognizes the future cost of removal and remediation including environmental exposures.
Covid relief has been shown in the statements to distinguish revenues and costs specific to the pandemic, but future budgets and financial reports will no longer do this because the special provincial and federal subsidies ended in 2022.
There was a $38 million operating surplus in 2023 due to unused provision for opening of Lines 5 and 6, offset by extra costs to operate the SRT replacement service sooner than planned.
I have included tables from the financial statement notes showing the breakdown of various subsidies as this area is poorly understood. Provincial gas tax comes to the City and portion of this is allocated to TTC operations with the remainder going to capital. Federal gas tax, now renamed the Canada Community-Based Fund, goes entirely to the capital program.
The TTC accounts do not include provincial projects such as the Ontario Line, nor the City’s SmartTrack program which is implemented by Metrolinx with funding from various sources notably Toronto’s City Building Fund.
The Draft Annual Report does not contain much at this point, but will eventually include the approved financial statements. It is the usual collection of pretty pictures and good news stories sure to warm the hearts of TTC Board members who don’t look beyond the surface.
The report contains a 10-year summary of key system statistics which I have included in the article as well as percentage changes in various factors over time. One item of note is the growth in staffing over ten years to operate roughly the same amount of service. Part of this due to changes in system scope (a larger subway system) and the pandemic-era problem that the staff needed to support fleet and infrastructure does not decline even though there are fewer riders.
The bus fleet today is also larger than in 2014. This does not reflect increased service, but rather a higher proportion of buses idle as maintenance spares. The Annual report includes different claims about the fleet size and overstates the number of green buses the TTC actually owns. I have asked the TTC for clarification of these numbers, but they have not replied.
The TTC is taking delivery of hundreds of new buses through 2024-25 that will replace older inactive vehicles, but there is no budget plan to fund operation of more service. The report crows about the greening of the fleet while neglecting to address how it will be operated.
2023 Draft Financial Results
Financial statements can be rather dry reading, and unless one is really keen for this type of detail, it is easy to get lost in the numbers and notes quickly. For those who dive in, a few key pointers.
Thanks to public sector accounting standards, the statements roll the capital and operating sides of the TTC together. This produces numbers that bear little resemblance to the commonly discussed budgets and deficits.
The large collection of capital assets together with subsidies are included at acquisition cost less depreciation, not at replacement cost. The capital subsidy to buy, for example, a subway train is carried on the books as revenue when it is received, but the money goes out the door again to actually purchase the train which becomes a capital asset that is depreciated over its lifetime. This can be confusing because a casual reader sees the TTC with billions in assets, but none of this can be “spent” for current operations.
The acquisition value of all capital assets on the TTC’s books is $23 billion at the end of 2023, offset by accumulated depreciation of $9.9 billion. Replacement value would be much higher.
The table below shows the consolidated results for 2023. There is a substantial difference between the budgeted total expenses of $2.392 billion and the actual value shown of $3.102 billion. The difference is largely from the inclusion of asset depreciation in the latter figure. This is not a cash expense. Although there is a $454 million “surplus” for the year, and a nearly $13 billion accumulated surplus, this is almost entirely due to changes in capital assets.
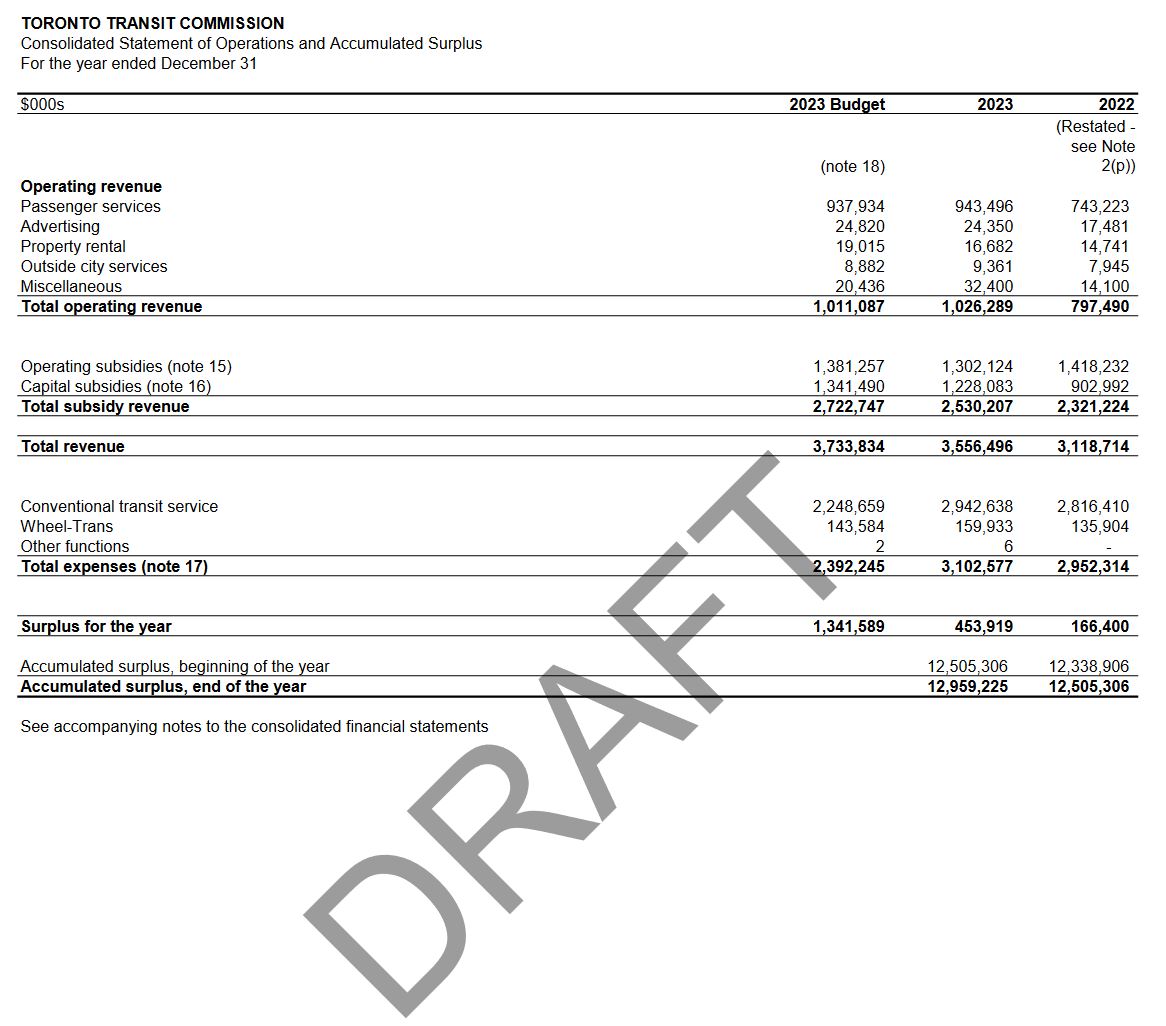
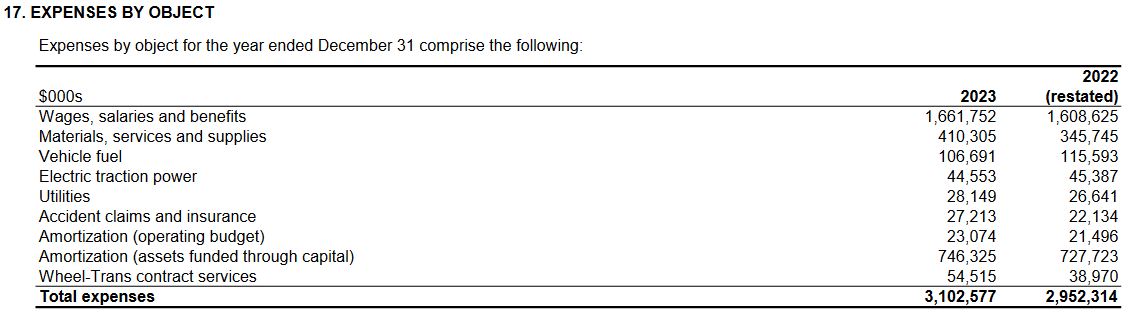
Note 17 shown below breaks out the expense components. Wages, salaries and benefits of $1.661 billion account for 69% of the Operating budget of $2.392 billion.
The combination of capital and operating accounts within the financial statement makes direct comparison to operating budgets tricky, and this is reconciled within Table 3. The true operating “surplus” (actually an under-expenditure versus budget) was $38 million. Some of this is due to budget provisions for opening of Line 5 Crosstown that did not occur, partly offset by additional service operated late in the year including the SRT bus replacement.

COVID relief funding is shown separately, but with the end of special subsidies on this account in 2022, future financial statements will not distinguish between “base” operating costs and the extra cost of service at a higher level relative to ridership than in pre-pandemic times. The change in 2023 is shown in the table below taken from Note 15 of the financial statement.
Note that $91.6 million is portion of the provincial gas tax paid to Toronto that is used for operating costs. The remainder goes against the capital budget. The decision on how to split this revenue is made by the City as part of its budget.

The capital subsidies come from all three levels of government under a variety of programs. The tables below are excerpted from Note 16 of the Financial Statements. The capital program is largely on the back of the City of Toronto. Except for the gas tax revenue, capital funding comes from streams with specific designations and sunset provisions. (Note that the CCBF shown below is the renamed federal gas tax program. See the full version of the notes for details.)

A new item in the 2023 statements is a provision for post-retirement asset obligations. In past years, if there was a cost associated with decommissioning an asset, this was treated as an expense in the year it occurred. Now, this will be shown as a liability and becomes part of the initial acquisition cost even though no money is spent at the time. The value could also change over time due to modified disposal requirements. The intent is to show the TTC’s exposure to future costs as assets age.
The most significant legal or obligatory asset retirement costs pertain to the removal and disposal of asbestos and other designated substances from TTC buildings and structures. A portion of this asbestos obligation was previously included and recognized as an environmental liability, and included segments of the Scarborough Rapid Transit (SRT) guideway no longer in use, fuel/combustible tanks, retired electrical trolley coach poles, decommissioned surface tracks and restoration costs related to leasehold commitments. [p. 4]
(Yes, there are still old trolley coach overhead poles scattered around the city over three decades after that mode was retired in one of the TTC’s less-than-well-informed environmental moves.)
This change also creates a long-term subsidy receivable from the City on TTC books.
Not shown here are the substantial capital investments by Ontario in various rapid transit projects that will be on their books, but mostly operated by the TTC as extensions to their network. Although the City originally agreed to carry the operating cost for Lines 5 Crosstown and 6 Finch West, a recent agreement provides a provincial subsidy whenever those lines open. There will be two components to the operating cost for these lines: direct TTC costs as operator, and payments to Metrolinx for the “non-lifecycle” maintenance costs (running maintenance as opposed to capital repairs).
In 2023, TTC entered into the Train Operating and Funding Agreement (TOFA) with City and Metrolinx associated with the new Eglinton Crosstown LRT (Line 5) operations. The agreement specifies the TTC’s/ City’s obligations for the operations and non-lifecycle maintenance expenses of Line 5. The estimated non-lifecycle maintenance costs payable to Metrolinx over the effective contract duration of 10 years is expected to be $376.9 million. The actual annual payable amounts over the term of the agreement may fluctuate based on inflation, service level in effect for the period, and other factors in accordance with the agreement. The non-lifecycle maintenance costs amount will be payable upon service commencement of Line 5, which is pending as of financial statement date. [Note 22.l of the Financial Statements]
Future operating cost arrangements for the Scarborough, Yonge North and Ontario Lines have not yet been determined, nor for the additional service required on Line 1 to accommodate expected demand from the Yonge North extension.
Depending on future capital and funding allocations, the degree of overall provincial contribution to transit costs within Toronto will be considerably higher than that shown in TTC accounts. Corresponding information for Metrolinx will be difficult to obtain because of their well-known secrecy and the structure of their contracts for building and operating projects.
There is a separate $1.689 billion Smart Track stations program carried on the City’s books and implemented by Metrolinx. Of this, $585 million comes from the federal government, $226 million from Ontario, and the rest, $878 million, from the City, notably from the “City Building Fund” implemented by Mayor Tory. This is not included in the TTC’s accounts, but does represent a substantial call on overall City funding resources.
The Draft Annual Report
The draft annual report has many blank pages where the financial statements will be added. The remainder of the report has the same sort of “good news” we see each month in the CEO’s Report, but with little forward view about challenges in the evolving travel market and financial situation.
10-Year Summary
At the very end is a 10-year consolidation of various statistics. Please refer to the full report for the extensive notes accompanying this table. Various items of note here:
- Revenue passenger trips fell from 534.8 million to 396.3m, or about 26%.
- The vehicle kilometres operated are almost unchanged from 2014 to 2023.
- The basic adult fare rose from $2.70 to $3.30, or 22.2%.
- The hourly wages and benefits for operators rose from $49.01 to $61.67, or 25.8%.
- The employee count rose from 13,209 to 15,772, or 19.4%.
- The operating revenue per passenger trip rose from $2.16 to $2.57, or 19.0%.
- The operating expense per trip rose from $2.97 to $5.51, or 85.5%.
- The operating subsidy per trip rose from $0.81 to $2.94, or 263%.
- The vehicle kilometres per employee fell from 17,291 to 14,551, or 16%.
Several of these values reflect the pandemic change in ridership and the preservation of service, particularly on the bus network.
Stats are reported in vehicle kilometres rather than hours, the number commonly used when talking about system recovery. With the increase in traffic congestion and provision for recovery time, a vehicle in-service kilometre requires more hours (and hence higher staff cost) to operate.
It is not clear which employee groups saw the greatest growth and how much was due to legal changes such as maximum work hours under labour standards.
Some costs and associated staffing such as infrastructure maintenance, station operations and system administration are mostly unaffected by service reductions.

Counting TTC’s Bus Fleet
One page caught my eye where the TTC summarizes its assets.

The bus counts are incorrect and overstate the actual fleet size by about 250 vehicles. This is concentrated in the hybrid bus category. The tables below are adapted from information in the TTC Scheduled Service Summaries which include details of the bus fleet.
The actual total number of buses in service is 2078 as of May 2024 of which 1557 are required at peak.
The 10-year summary of system statistics gives the bus fleet size as 2,063 for year end 2023.
The TTC seems to be incapable of counting its own buses.
The numbers do not compare favourably with January 2013 when the peak fleet requirements were similar, but the fleet itself was 200 buses smaller. The number of buses scheduled on bus routes was 1,505 in both cases, although in 2024, the fleet included 163 artics (18m buses) which slightly increased the capacity of the active fleet. (Note that the Spadina Subway Extension to Vaughan opened in late 2017 changing bus requirements in the area it serves.)
Even with corrected numbers, the spare ratio (defined as the proportion of the fleet that is not used for peak service) is high by industry standards. A normal value used to be 20% although this is creeping up thanks to increased technical complexity of buses. The actual value for the TTC fleet was 22% in 2013 and it is now 33%. This allows some elderly buses close to retirement to be sidelined without affecting service.
However, those older buses are being replaced and the TTC will soon have a younger fleet and many buses sitting idle. On the basis of a 25% spare ratio, the TTC has about 100 more buses than it requires for scheduled service. If they could achieve 20%, that number grows to 175.
(If the fleet size were actually what the Annual Report claims, the problem would be even greater.)
The proportion of the fleet that is hybrid or electric sits at about the same level today as it did in 2013. The reason for this is that thanks to reliability problems, some early hybrids retired early and many diesel buses were ordered in the 2015-2018 period.
The TTC still shows all 60 battery buses as active, but it is well known that many of them rarely if ever leave the garage. The Annual Report claims that there are “60 Zero-emission buses on the road and 360 on order Largest active fleet in North America” [p 22]. This is a flat out lie unless Toronto has a new definition of “active”.
One effect of the high spare ratio is that the TTC will be able to hide reliability problems, should they develop, with the new battery bus fleet just as they have with much of the trial eBus fleet.


See also: How Many Buses Does The TTC Use? (2024 Update)
I have asked the TTC to reconcile the varying counts of buses, but they have not replied.

4 streetcar carhouses? Leslie, Roncesvalles, Russell, and… Hillcrest?
Hillcrest was expected to start construction as a “new” carhouse for 2 streetcars as early as Q4 2024 and last approximately five years (subject to weather and unforeseen events). Already including it as a carhouse?
Are they already storing streetcars (one or two?) at Hillcrest?
Steve: It has been used occasionally when Bathurst is closed for construction, but yes, they are counting it early.
LikeLike