
For many years, the TTC reported bus reliability as a mean distance before failure (MDBF) as shown in the charts below.
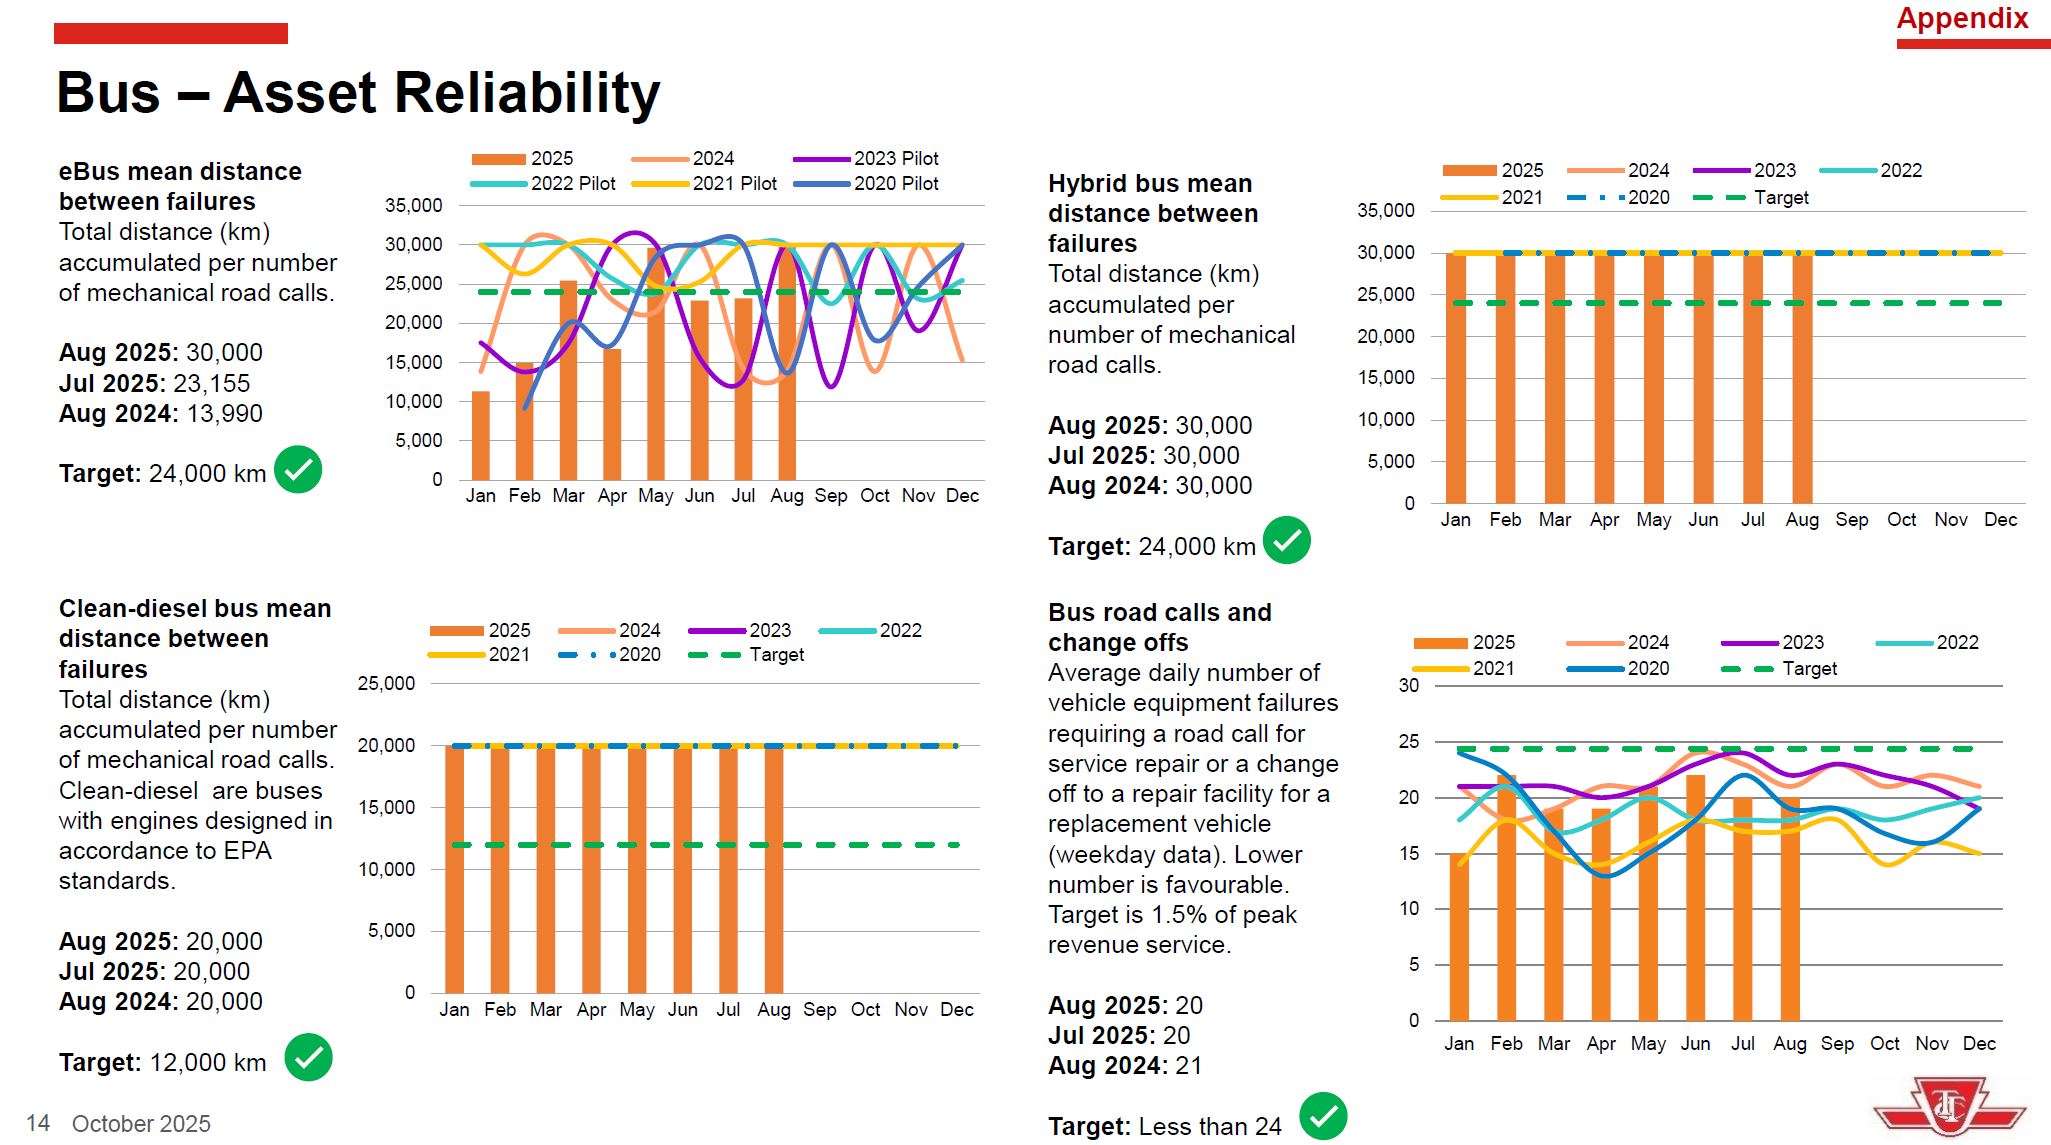
A fundamental problem with these charts is that the values for Hybrid and Clean Diesel buses are capped at 30,000km and 20,000km respectively, although the actual values could be higher. This makes the values shown for eBuses which lie in the 15,000-30,000km range look similar by comparison.
In the October 2025 CEO’s Report, on the agenda for the TTC Board Meeting of October 6, 2025, the values are not capped. Indeed, the CEO comments on the particularly good results for diesel buses.
Industry-Leading Asset Performance
When it comes to vehicle reliability, our fleet continues to outperform expectations. Across all vehicle types, our buses are achieving Mean Distance Between Failures (MDBF) well above North-American standards. Clean Diesel, in particular, is showing exceptional results, demonstrating industry-leading reliability across our entire bus portfolio. [CEO’s Report at p. 2]
The numbers cited by the CEO for September 2024 to August 2025 are:
Mean Distance Between Failures
Ebus 117 buses 24,554km (12m rolling avg) Target 24,000
Diesel 1165 buses 46,336 km(12m rolling avg) Target 12,000
Hybrid 766 buses 36,218km (12m rolling avg) Target 24,000[CEO’s Report at p. 5]
The MDBF values affect key aspects of service provision including the number of vehicles required for spares and the probability of a failure affecting service.
Not included in the stats is the mean time to repair which can have as severe an effect as MDBF. If the failures for one type of equipment are more complex putting a bus out of service for a longer period, this can compound the MDBF rate because each failure represents a longer outage. The TTC is somewhat insulated from this effect because it maintains a larger spare ratio than the industry average (see below).
I will review the new format of reported stats (only bus and subway are available so far, with streetcar to come in November) as part of my general write-up of the Board agenda.
The TTC appears to have been under-reporting the reliability of diesel and hybrid buses for many years, and this suggests that they wanted to make their eBus program appear as successful as possible. The historical stats should be restated with the caps removed so that the public can see just what the comparison over past years actually looked like.
Recently, operational issues regarding the deployment and charging for an eBus fleet have come to light, and it is clear that conversion to battery buses is not going to be as straightforward as thought when this program began.
Different fleet counts are cited in the August 31 Scheduled Service Summary and the CEO’s Report.
| CEO’s Report September 2025 | Scheduled Service Summary August 31, 2025 | |
| Diesel | 1,165 (56.9%) | 1,165 (55.3%) |
| Hybrid | 766 (37.4%) | 766 (36.3%) |
| eBus | 117 (5.7%) | 177 (8.4%) |
| Total | 2,048 | 2,108 |
| Peak Scheduled | 1,588 | 1,588 |
| Spare Ratio | 29% | 33% |
Only 1,588 of these buses are scheduled in peak service [effective August 31, 2025] giving the TTC roughly a 29% spare ratio (three buses spare for every 10 scheduled), still above industry standards if the pilot eBus fleet is excluded. If they are included, the spare count is even higher, but that could be misleading depending on how many of the pilot buses actually remain in service.
How much of this is due to budget limits on service growth, and how much is due to keeping a high number of spares to offset poor reliability?
233 eBuses remain to be delivered on current orders, and the TTC proposes a further 200 hybrid buses to continue replacement of older vehicles while eBus technology matures. The portion of the fleet now being retired is not the diesels, but the earlier hybrids acquired in 2006-2008. [Source: TTC Scheduled Service Summary effective August 31, 2025 at p. 58]
A through review of the eBus program is needed to understand its effect on future operating and capital budgets without the rose-coloured lenses applied to “green” projects. Emission reductions are a key goal for Toronto, but they should not come at the expense of higher cost and reduced reliability for the transit fleet.

Also not included in the stats is that the average TTC bus shakes and rattles like a bag of bolts, making for a noisy, rough, and unpleasant ride. I know little about bus design, but I’m surprised that the design and/or manufacturing standards are this low. Or is it just the TTC?
Perhaps daily bus riders tune this out, but as someone who usually takes subways or streetcars it’s very noticeable, and it does not make bus transit attractive.
Steve: Bus manufacturing standards combined with Toronto’s fine road maintenance.
LikeLike
The planet is burning up – so while I deeply respect your work – I think we need to prioritize reducing carbon emissions. Nothing rose coloured about saving our home, we live here. Here’s an idea – Ottawa spend money on transit instead of US made fighter jets. Politics is about making hard choices.
Steve: Getting people out of cars and onto transit saves more carbon emissions than converting buses to battery power, especially if the point of comparison is hybrids, not old dirty diesels that the TTC continued to use as a comparison even after the worst of those buses were retired. Spending more on expensive, less reliable, buses while leaving service, at best, the same does nothing to attract more riders to transit.
But, hey, it’s easier for politicians to look like they are addressing the problem with green buses than to tell people that the real answer is to get out of their cars, and to build and operate transit attractive enough they won’t be laughed off the stage for making such a ludicrous suggestion.
LikeLike
They left out the reliability of the Nova Articulated bus fleet which seems to often get changed off throughout the day. There must be issues as dispatching standard buses is a regular daily occurrence on McNicoll routes and mostly Malvern routes 904, 985.
LikeLike
Would battery buses being used on shorter and slower routes depress their mean distance between failures? Maybe because some failures are correlated to time in use rather than distance operated?
The new New Flyer hybrids (that turn the diesel engine off automatically and can drive purely on electric motor) are quite nice. When did the TTC start getting them? Are they the only ones included in “hybrid” stats or are other kinds as well? I remember some level of hybrid buses back in 2008 or so, but I don’t think those had as much electric power?
Steve: Although slower routes will reduce the mileage operated per vehicle, the difference in reliability is much greater than the difference in scheduled speed. As for the types of vehicles included in the stats, this will range across several groups of buses. You can see the full fleet breakdown on the last page of the current Scheduled Service Summary.
LikeLike
Adding up the diesel buses in the service summary, I get 1165. That number includes the artics. The MTBF for diesel buses specifies 1165. So it seems that the Nova artics are included.
LikeLike
They should run the numbers as to whether it still makes sense to buy hybrids over plain diesel buses. Given that we now have EV buses to reduce overall emissions, the minor emission improvements of hybrids might not be worth the extra cost and worse reliability. It might make more sense to go with a diesel/EV mix of buses instead of a hybrid/EV mix. We can use any cost savings of using plain diesel buses to buy more EVs.
And if the TTC has extra buses, they should really be looking into renting them out to other transit agencies. I know Ottawa is putting in new orders for diesel buses because their new EV buses didn’t arrive on time, leading to a temporary bus shortage for them. They could have just rented them from the TTC instead.
LikeLike
There might be other reliability stats that we won’t know about still, like the overall running costs and the salvage costs at end of life. Do the hybrids have fewer complicated diesel engine problems because they use electric power for some of their propulsion? Is that outweighed by the cost of battery replacements? What are the cost savings of using electrical power over diesel fuel? Do hybrid buses have more residual value when they are retired or are they just sold for scrap just like diesel buses? Is the reliability of newer hybrid and EV buses improving with newer models or has it plateaued? If it has plateaued, then maybe we should wait for the bus manufacturers to start selling buses that use the newer cold weather sodium-ion batteries that the Chinese are starting to come out with. If waiting a year or two could result in substantially better EV buses, then maybe it’s worth the wait.
Steve: The problem with estimating salvage costs is that hybrids being retired now are from an early generation of buses and not necessarily representative of what a new hybrid fleet might bring. Both hybrids and electrics are a moving target in that regard. From the figures cited in the CEO’s report, we know that the diesels have the highest MTBF followed by hybrids, then eBuses a distant third. Another issue facing eBuses, and to a lesser extent hybrids, is the cost of mid-life battery replacements. Energy costs are not simply the raw cost of diesel or electric power, but also the ancillary costs such as extra dead-head time and mileage to deal with the distance an eBus can travel on one charge, and the cost of on-route charging facilities as an alternative to garage-based charging. The TTC has not yet settled on a charging strategy, and so we do not know the comparative cost of “fuelling”. From an accounting point of view there is a problem of counting some costs as capital and some as operating, and the different subsidy arrangements for each type.
I will be very surprised if we ever see a full comparative accounting of the three modes without a major effort to make eBuses look as good as possible. Careers depend on them remaining a key and growing part of the fleet.
LikeLike