
This article is an update from a previous review of travel times on the Jane corridor which is currently under study in the RapidTO program. Red lanes are proposed between Eglinton and Steeles both ways. The southern limit is defined both by the change in roadway cross section in the older part of the city, and by the future split in bus service at Eglinton to feed into Line 5 Crosstown.
Scheduled Service and Ridership
A common claim by the TTC and City is that service on the bus network is restored to or better than pre-pandemic levels. This is not true.
The measurement used is bus hours, but actual frequency of service is the metric riders experience. Total bus hours might be “back to normal”, but these are distributed differently now than in 2019 with some of the restoration going to longer travel and recovery times. These might contribute to service reliability, but with lower scheduled capacity (buses/hour).
Service in November 2019 compared to February 2025 (the schedule in effect in August 2025) was generally better than it is today.
| Buses / Hour L Local X Express | 2019.11 M-F | 2025.08 M-F | 2019.11 Sat | 2025.08 Sat | 2019.11 Sun | 2025.08 Sun |
|---|---|---|---|---|---|---|
| AM Pk M-F | 12.9L 8.0X | 10.0L 5.0X | ||||
| Midday MF | 8.6L 6.3X | 8.0L 4.0X | ||||
| PM Pk M-F | 12.0L 6.2X | 10.0L 5.0X | ||||
| Early AM S-S | 7.1L 6.0X | 6.0L | 2.0L | 3.0L | ||
| Late AM S-S | 6.0L 6.7X | 6.0L 6.0X | 6.0L 6.7X | 6.0L 6.0X | ||
| Afternoon S-S | 8.0L 6.7X | 8.6L 8.6X | 6.0L 7.1X | 7.5L 7.5X | ||
| Early Eve | 6.9L 6.7X | 8.0L 4.0X | 8.6L 6.7X | 7.5L | 8.6L | 7.5L |
| Late Eve | 6.7L | 6.0L | 7.1L | 6.0L | 6.3L | 6.0L |
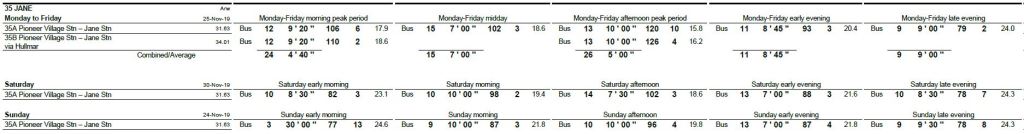
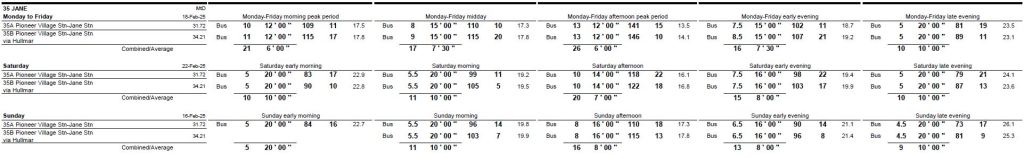
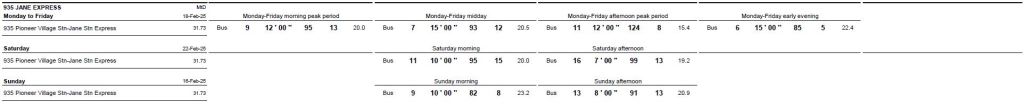
The tables below are taken from the November 2019 and July 2025 TTC Scheduled Service Summaries show the corresponding service designs. Within each group, the fields are:
- Number of assigned vehicles
- Frequency of service
- Travel time
- Terminal recovery time
- Scheduled speed (km/h)
Changes in service levels are affected by scheduled speed, frequency and recovery time. Note that recovery times in 2025 are more generous than in 2019, and travel times have also increased with a corresponding drop in scheduled speeds. In some cases, the number of buses (and hence bus hours) goes up, but the level of service goes down because of slower operation.

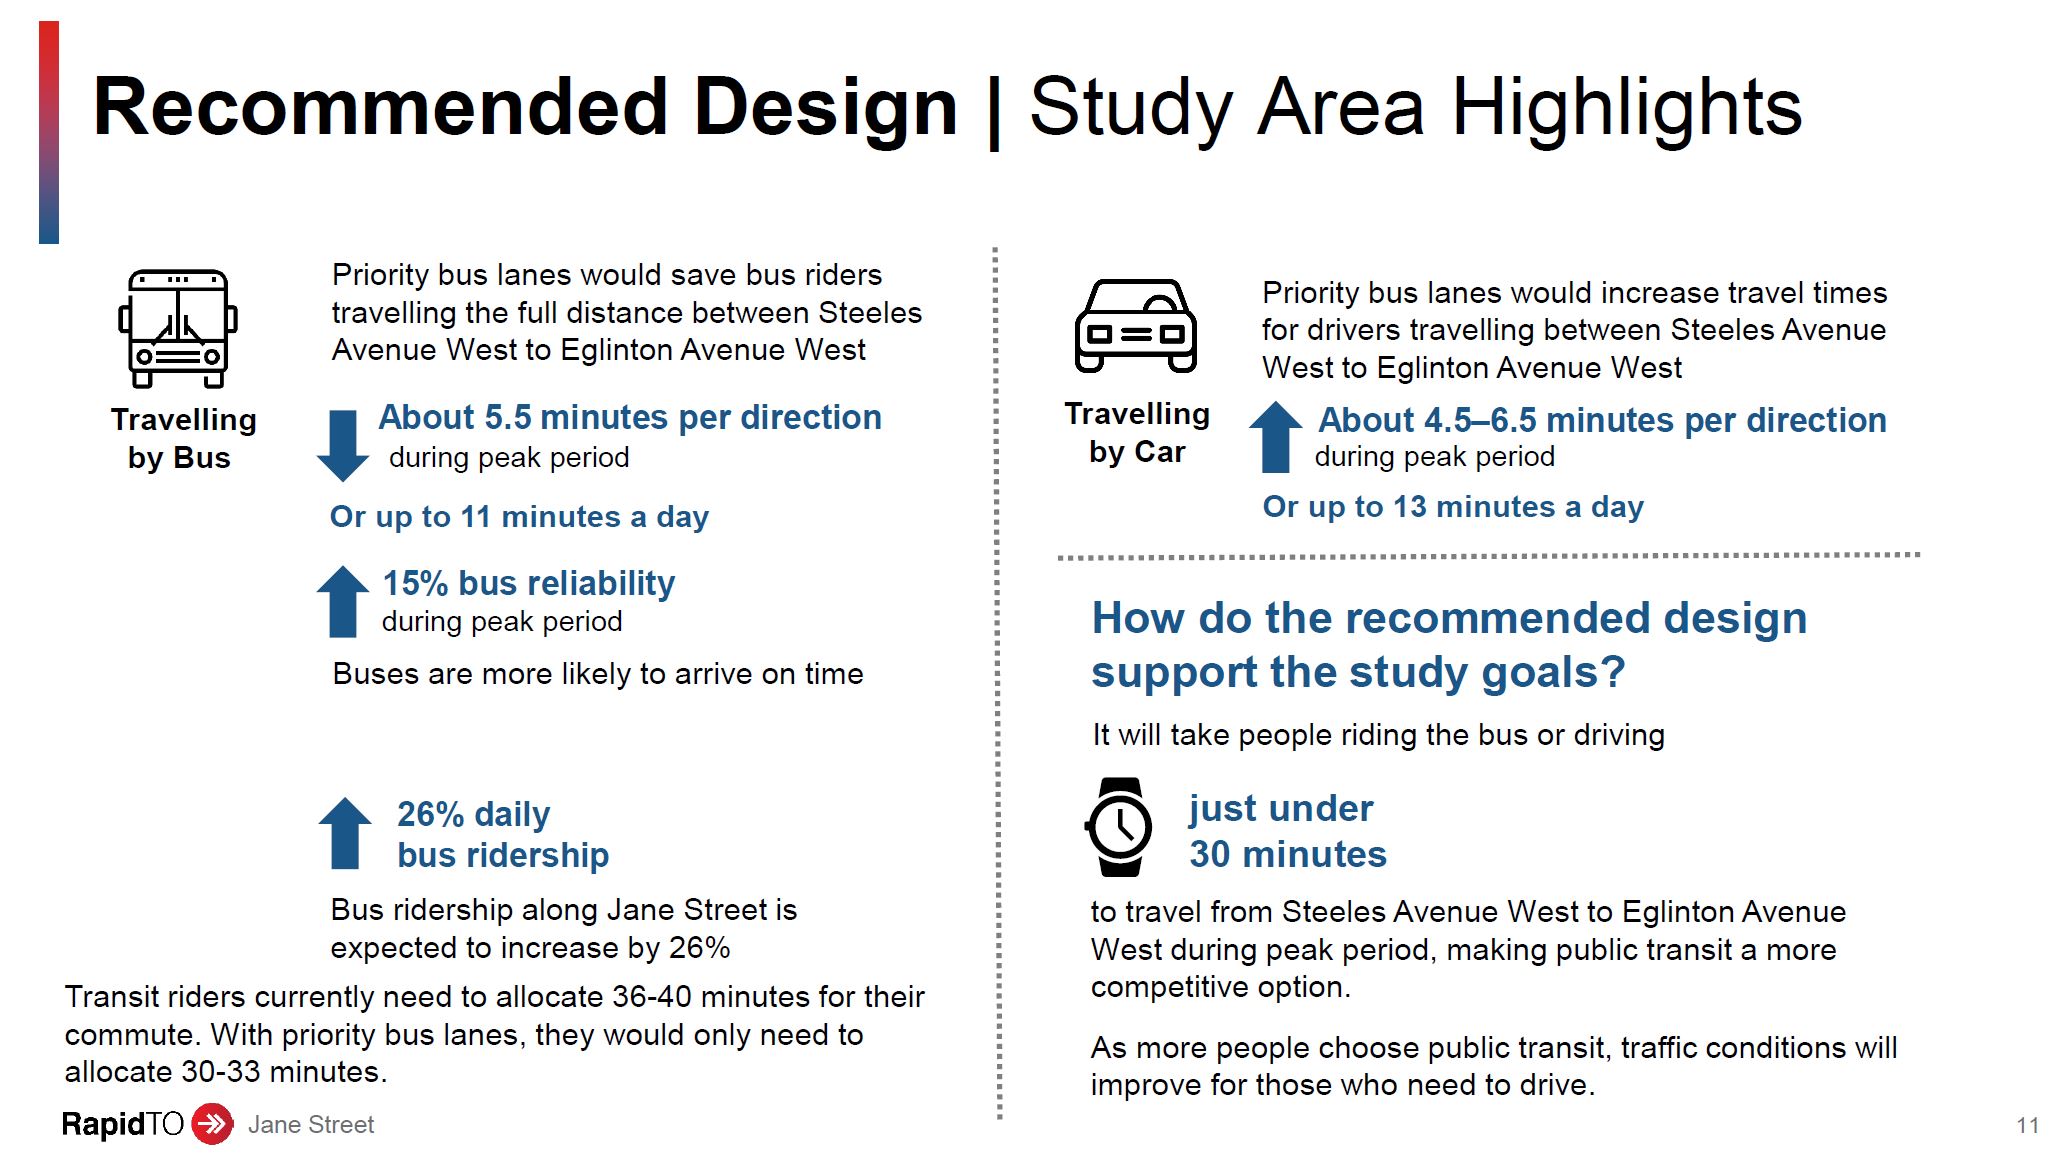
RapidTO plans for Jane seek to shorten travel times between Steeles and Eglinton, but the benefit varies. Terminal departures are irregular, although much of that variation is permitted under the Service Standards. RapdTO’s supposed contribution to regularity is that buses will be able to stay more or less “on time”, but unless departures at terminals are better managed, service will still begin trips irregularly. On the current 6′ peak headway, the standards allow a 50% fluctuation from 3-to-9 minutes, and this can make a huge difference in wait times and vehicle crowding.
All-day ridership reported in past years is summarized below. As of Fall 2024, ridership was still well below the 2019 level.
| All-day Riders | 2019 | 2020 | 2021 | 2022 | 2023 | 2024 |
|---|---|---|---|---|---|---|
| 35 Jane | 31,085 | 26,082 | 20,334 | 24,840 | 28,808 | 25,820 |
| 935 Jane Express | 13,749 | 7,965 | 10,645 | 10,034 | 11,644 | |
| Total | 44,834 | 26,082 | 28,299 | 35,485 | 38,842 | 37,464 |
We do not know how much ridership growth might be constrained by service capacity and reliability, as opposed to changes in actual demand. The TTC projects large growth from improvements in travel time and reliability with RapidTO, but with no commitment to increased capacity. This claim is difficult to believe.
I asked the TTC for the methodology behind its calculation of RapidTO ridership growth on July 28, but have received no details as of August 11. (The request was for Dufferin and Bathurst corridors where the TTC makes similarly optimistic projections, but the same issue applies to Jane.)
The remainder of this article updates previously published data about travel times on Jane starting just before the pandemic in November 2019 up to July 2025.
35 Jane Local Bus Travel Times
The data here include November 2019 when I happened to pull information on this route, little knowing what would occur a few months later. From May 2020 onward, I collected the vehicle tracking data (with thanks to the TTC who supplied it) to monitor how the route behaved during what was then expected to be a brief lockdown period. Things turned out differently, but this gave a chance to see how the bus service behaved in the absence of road traffic and much of the passenger demand.
Travel times dropped a lot in 2020 through a combination of faster driving speed and shorter stop service time. There is a strong dip at the beginning of 2022 when the second lockdown hit, but since then travel times rose gradually with mainly seasonal variations.
The values shown in mid-2020 represent the route under likely the best conditions for fast trips and set a lower bound for what might be expected from RapidTO. Some improvements might also come from stop elimination and signal timing changes, but these are separate from provision of exclusive transit lanes.
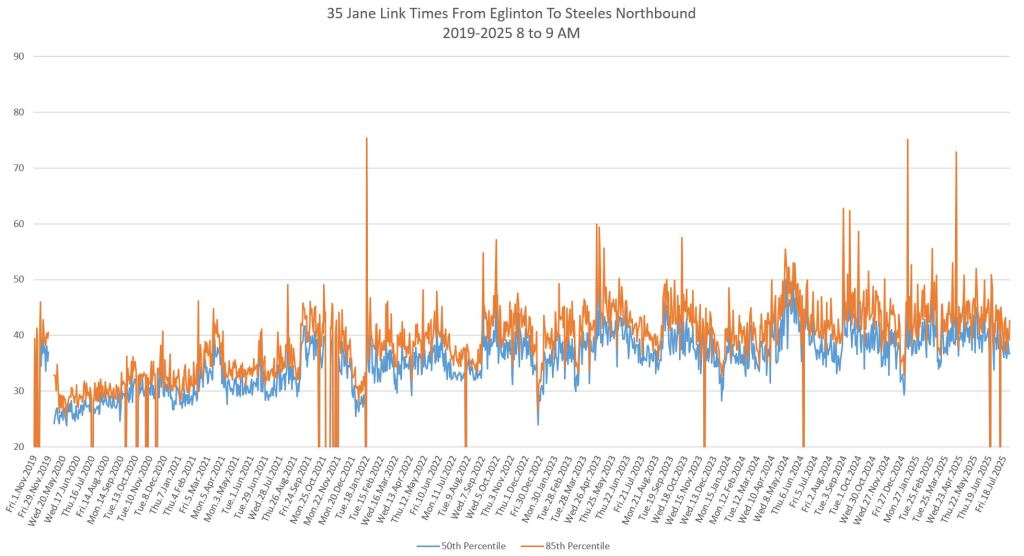
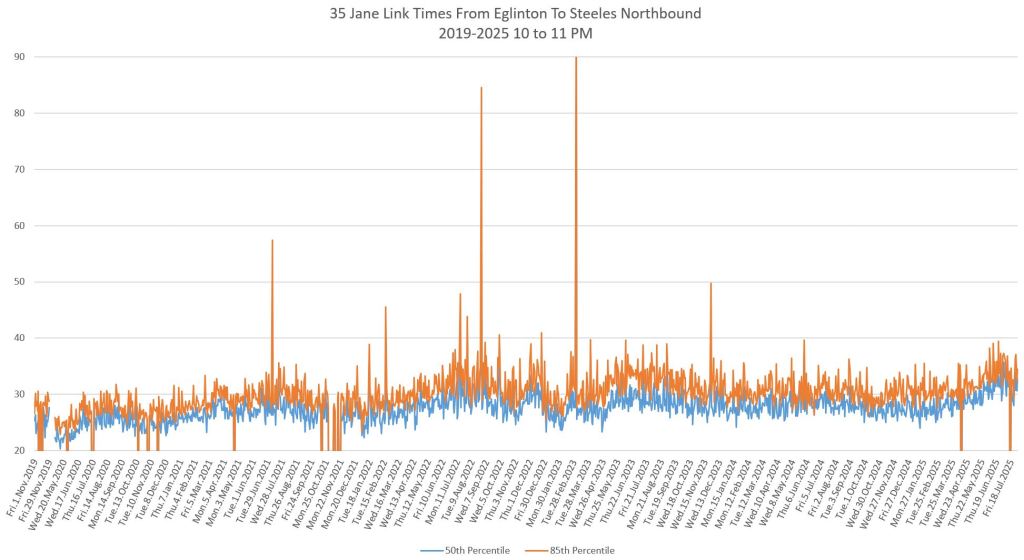
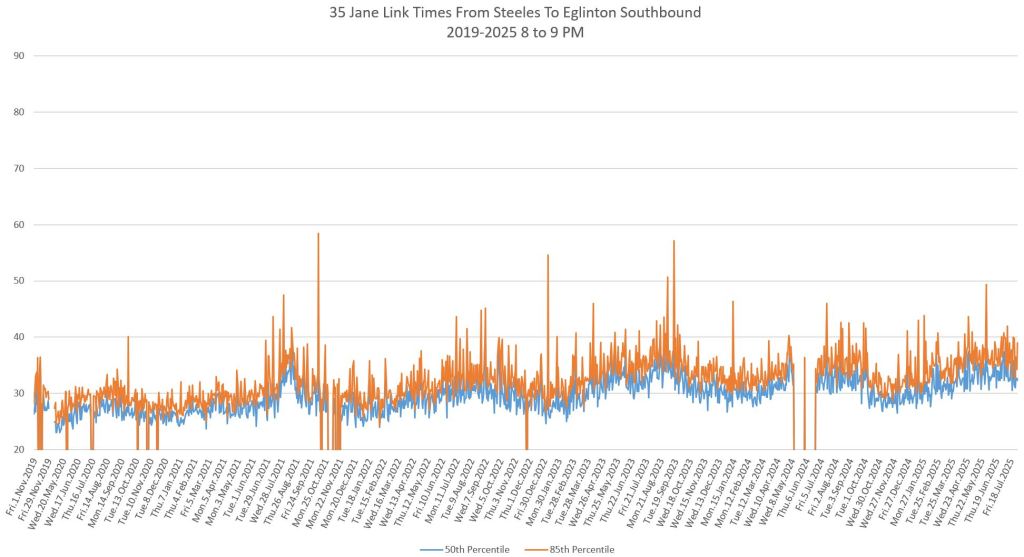
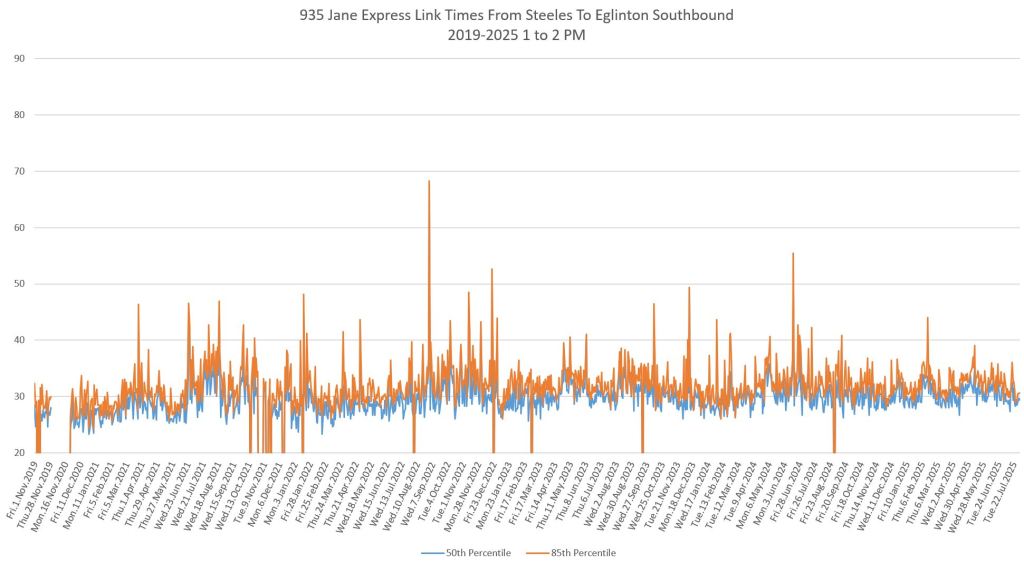
Each chart consolidates the data for one hour of operation (e.g. 8-9am) for every weekday. The blue line in the charts tracks the median values where 50% of trips were longer and 50% were shorter. The orange line tracks the 85th percentile which encompasses most trips except outliers. These lines are generally close together indicating that the values stay close to the median, except in the pm peak. Where the lines drop to the x-axis, there was no data. Note that the x-axis is set at 20 minutes to give the charts more y-axis headroom.
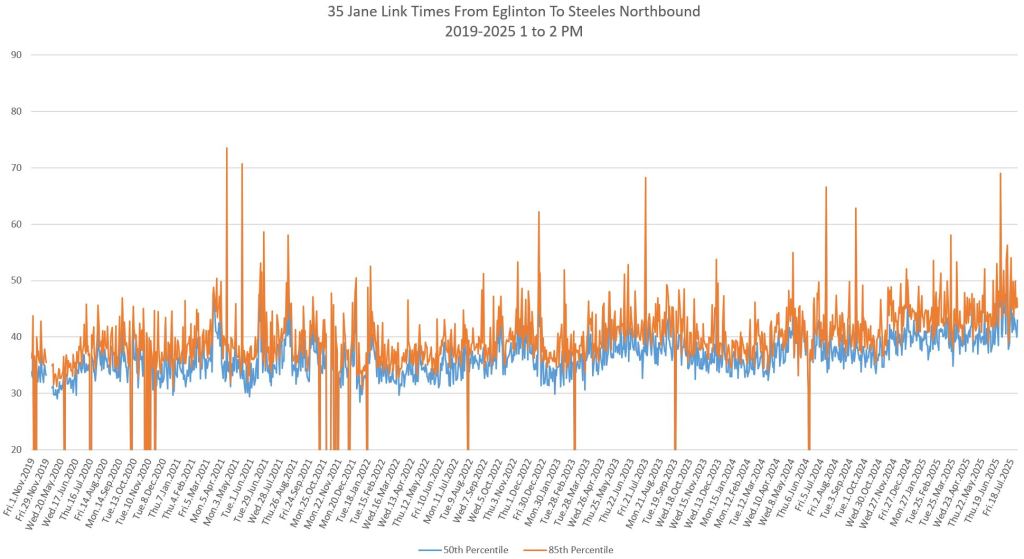
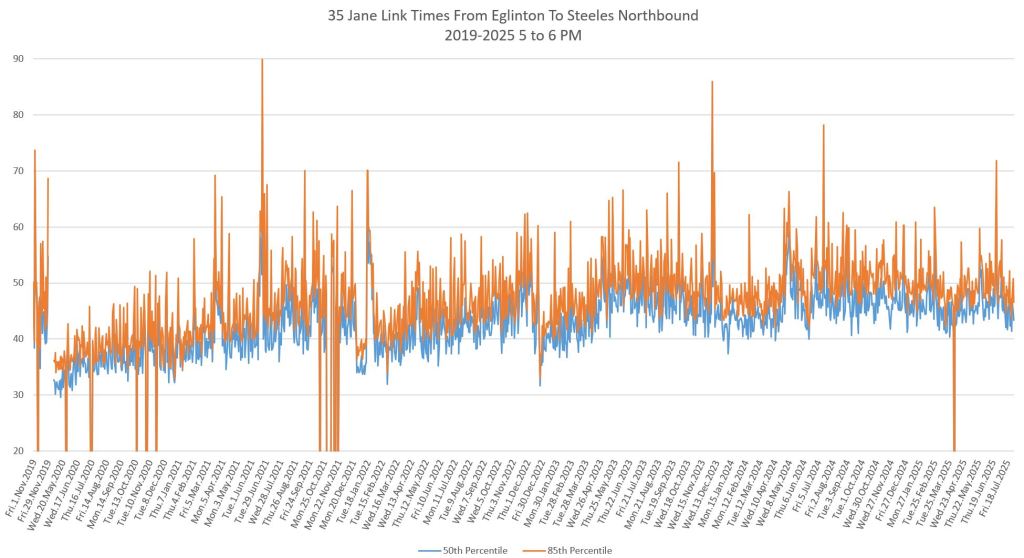
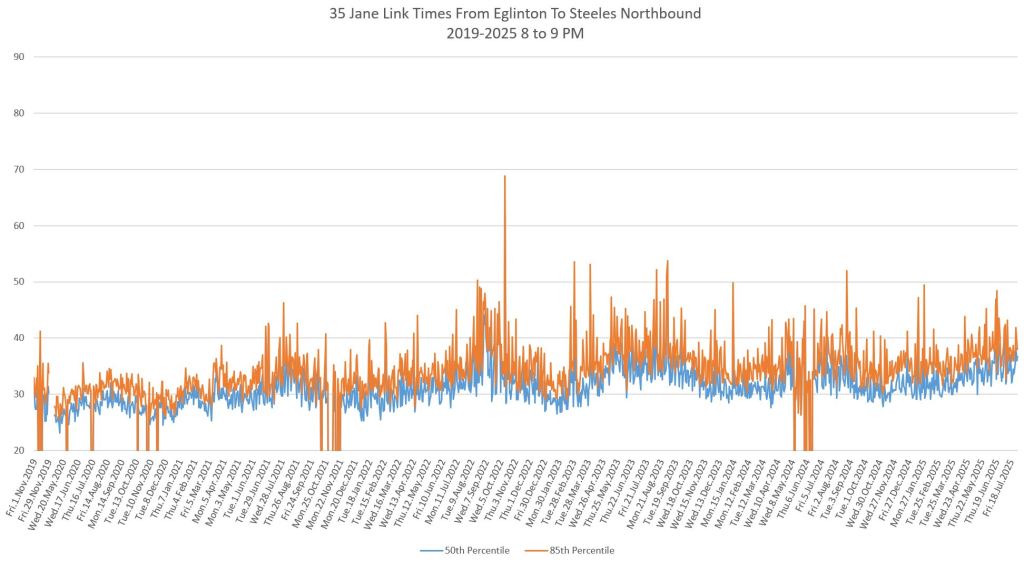
Northbound
The gradual growth in travel times is quite clear in the 8am counterpeak data starting at about 25 minutes in May 2020 and rising to nearly 40 minutes by Fall 2022.
The 1pm data show much less of a drop in travel times in 2020 with a long gradual rise, particularly since late 2024.
The 5pm data show a 2020 drop, but rise to a higher level as would be expected for the pm peak direction. Note also that the spread in values is wider in these data versus the am peak values showing larger range in travel times.
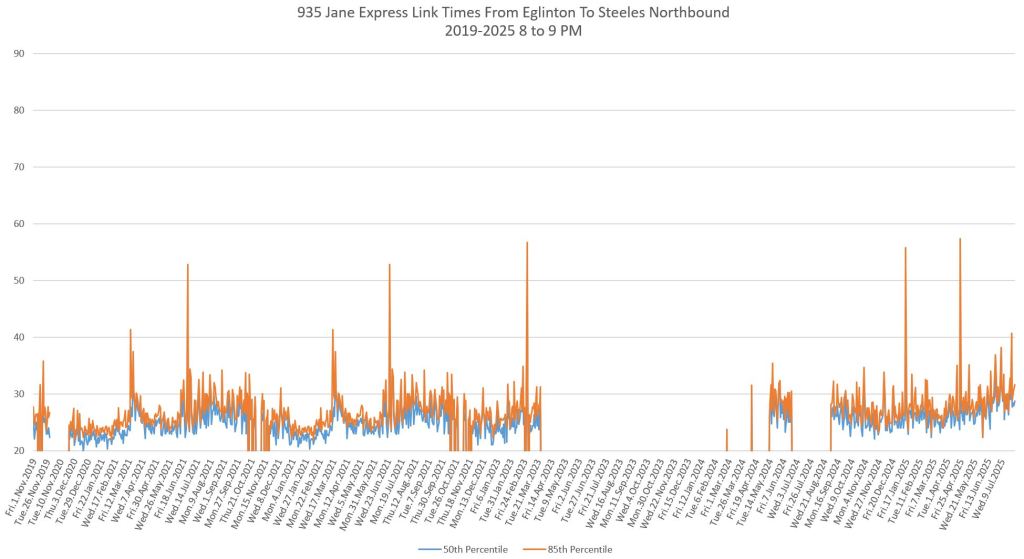
By 8pm and particularly by 10pm the travel times drop again and show less growth over the period than the daytime values. Travel times rise in 2025, and this change is also seen in the southbound data.
Southbound
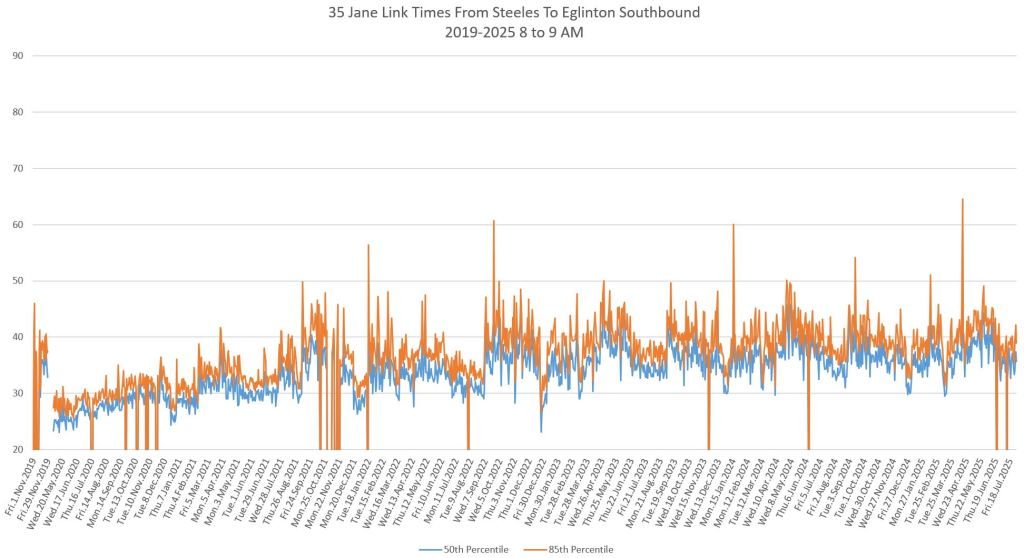
AM peak travel times show a drop in 2020 followed by a long recovery to late 2022 when the values were roughly back to Fall 2019 levels.
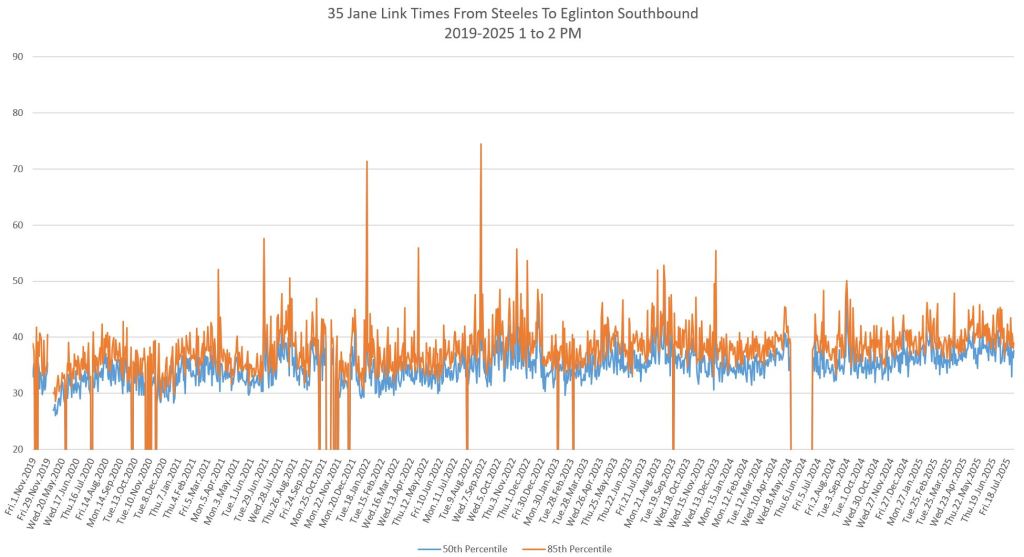
The 1pm data show a smaller drop in travel time in 2020, and an almost immediate return to the 2019 level with gradual growth to 2025.
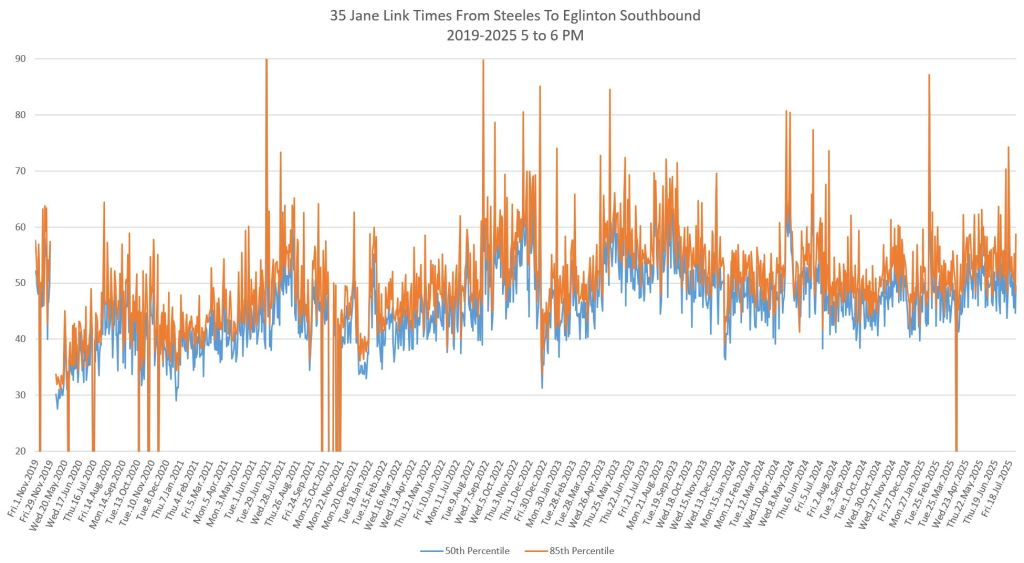
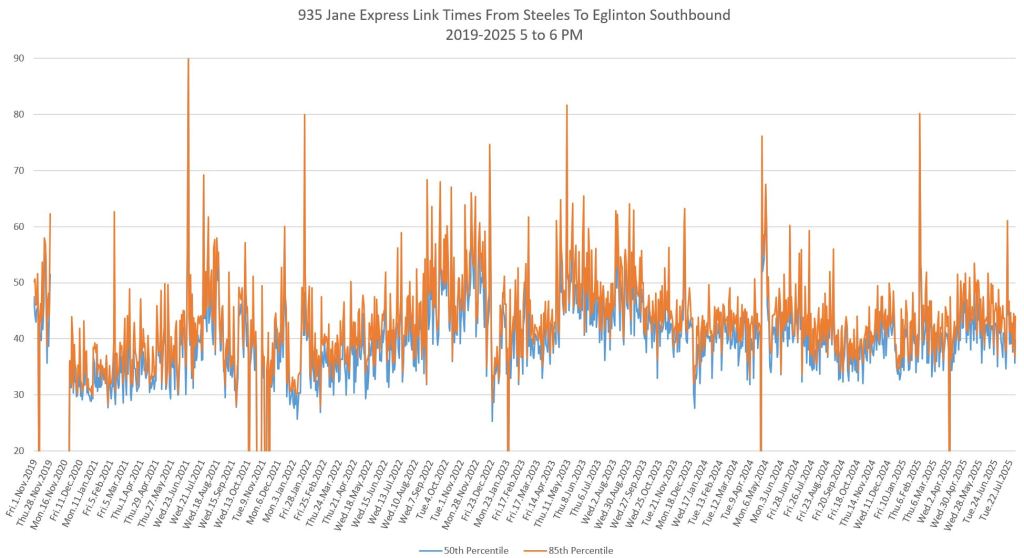
The 5pm data show a large drop in 2020 with a return to the 2019 level by mid 2021. This climbed even higher in 2022 (and higher than the “peak” northbound values), but dropped again from late 2023 onward.
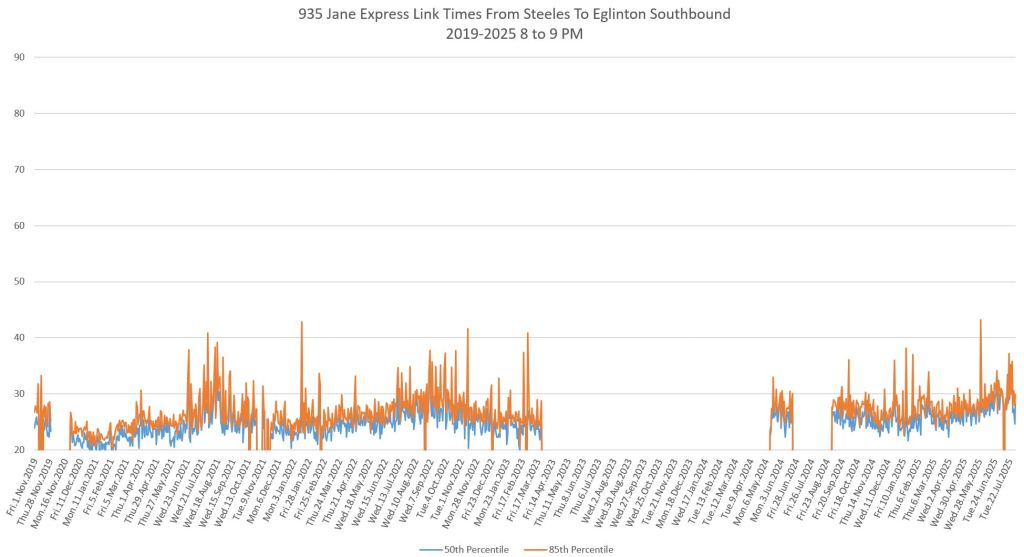
The evening data show the same pattern as northbound service with little change over the period, but a gradual rise from late 2024 onward.

935 Jane Express Bus Travel Times
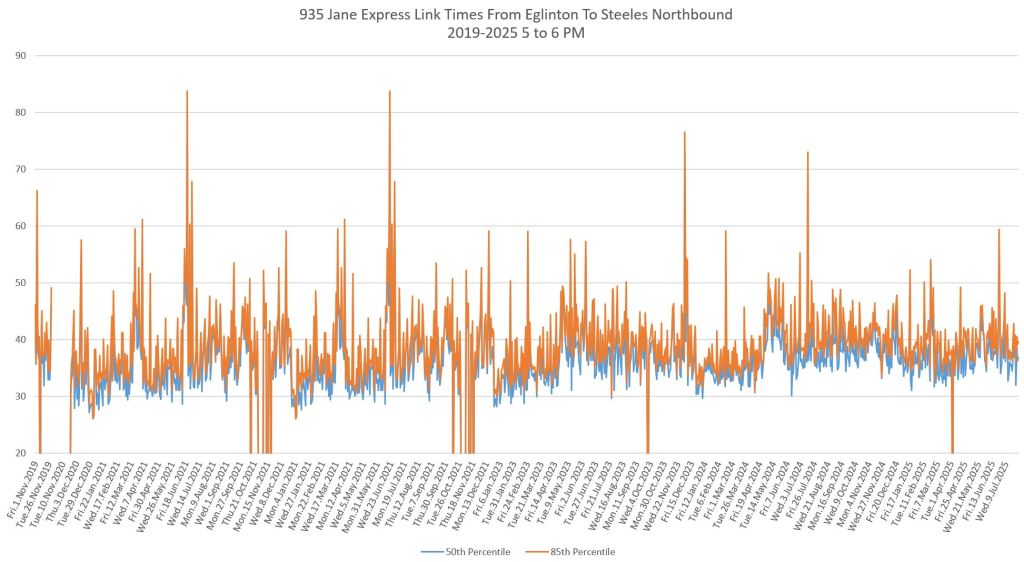
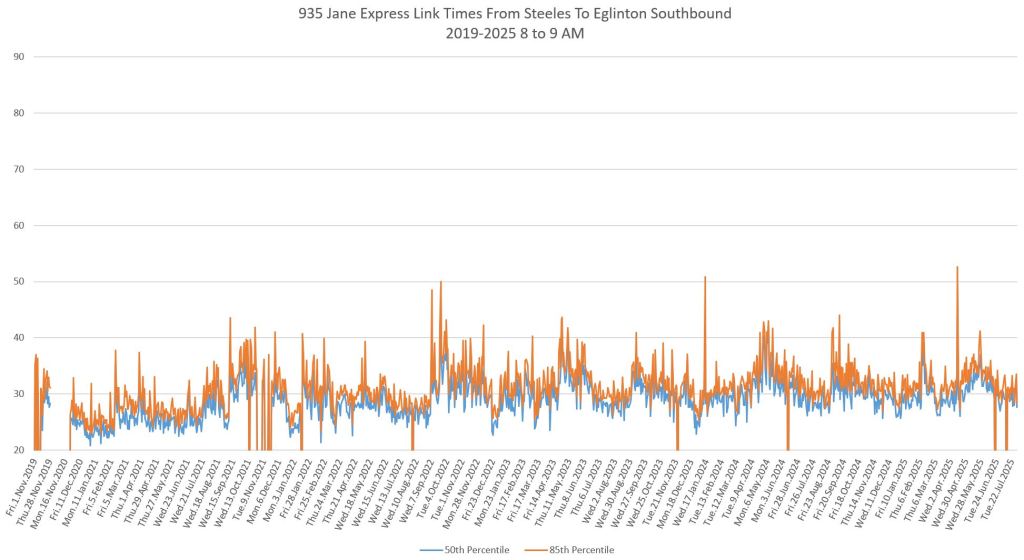
Express travel times have a pattern similar to the local times with a drop in 2020 and a gradual recovery to 2025. However, the drop if any is not as steep except for pm peak southbound travel. Like the local service, this has the greatest range of values of any period.
An important distinction for the express service is that it has fewer stops and should be less affected by stop service time than by general traffic.
Note that express service was suspended on weekday evenings in 2023-2024, and all express service ceased for much of 2020.
Northbound


Southbound
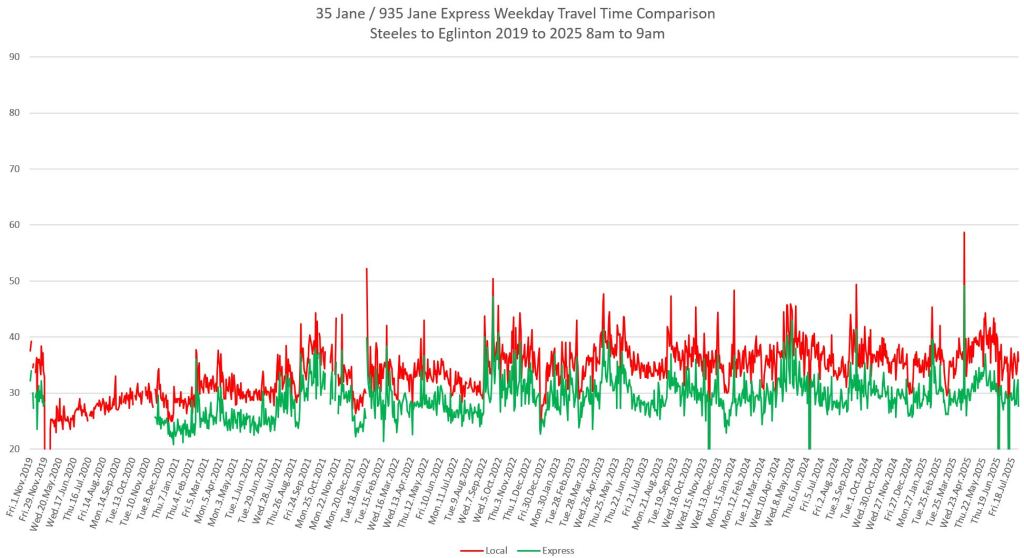
Comparison of Local and Express Travel Times on 35/935 Jane
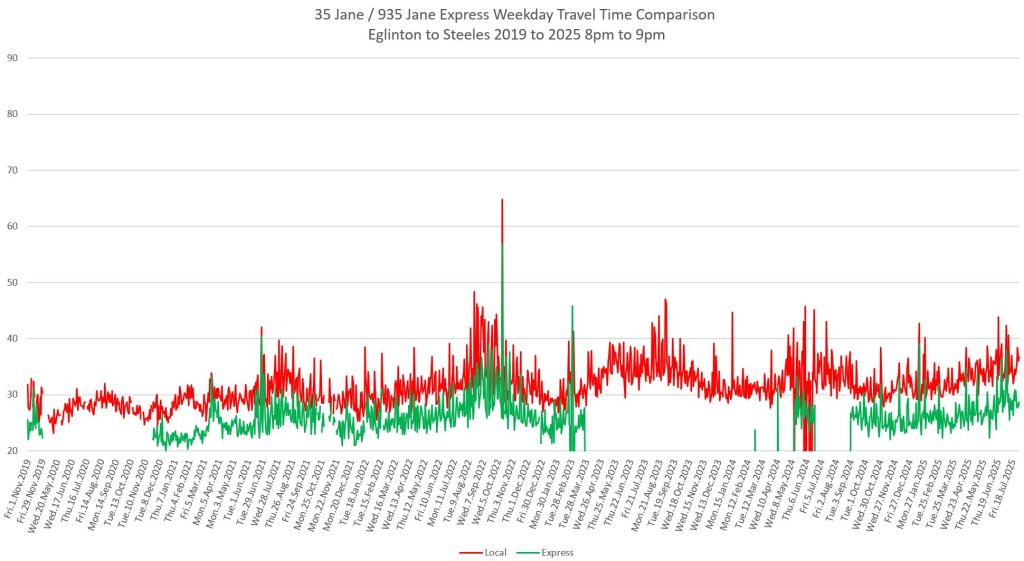
In the following charts, the upper red line shows the median travel time for the local service, and the lower green line shows the express service. The gap between them is the travel time saving for a trip over the full distance between Steeles and Eglinton. Short trips will have shorter savings.
The width of the gap varies by time of day, and over the period from 2019-2025. The swing in values from one day to the next is widest in the PM peak where the value ranges overlap more than at other times.
An important question in any review of express services generally is whether the time saving for an express trip justifies a separate limited stop service. With the 935 peak headways wider in 2025 than in 2019, the time potentially lost waiting for an express bus could be longer than the time saved on a faster trip. This would be compounded by less regular service and wider gaps.
If reserved lanes are implemented on Jane, will the effect be to make express buses even faster than locals, or will the times be more alike especially if express buses are constrained in overtaking local ones.
The charts show how the changes in median travel times for express and local trips have roughly tracked each other through past years.
Northbound


Southbound


With the alleged opening of Line 5, they will split the 35 JANE bus into two routes, the 35 JANE serving Jane Street from Pioneer Village Station to Mt. Dennis Station, and the 27 JANE SOUTH serving Jane Street from Mt. Dennis Station to Jane Station.
The TTC could be using articulated buses on the 35 JANE and regular length buses on the 27 JANE SOUTH. However, with the articulated buses, while they can carry more people, the headway between the articulated buses could widen. Likely, they will start using the current headways and would then decide on widening or narrowing the headway after a few months.
LikeLike
Do you plan to make a ridership chart of all subway and surface routes for 2024 compared with 2023 and 2019? The 2024 stats are now available on the TTC transit planning website.
Steve: See my just-published article.
LikeLike
I see thanks for the link.
LikeLike