
This article reviews the behaviour of service on 512 St. Clair during the first two months of 2025. This period was marked by an intense snow storm in mid-February that left many transit routes in disarray thanks to poor snow clearing.
Updated Mar. 21, 2025 at 10:30pm: The service chart for February 12, 2025, the first of the two major snow storms, has been added to this article.
Updated Mar. 22, 2025 at 1:00pm: Detailed charts of headways and travel times for February 12, 2025, have been added showing the consistency of travel times along the route even though headway quality deteriorated through the evening due to bunching.
The typical problem on four-lane roads was that snow was not removed to the curb causing parked cars to foul the streetcar tracks. Despite streetcar lines being “Snow Routes”, the signs were little more than decorations. The oft threatened but rarely practiced removal of cars for proper clearing did not occur, and some snow/ice banks remained until they eventually melted. Delays for blocked service occurred repeatedly well after the storms.
Another common problem was the absence of breaks in windrows (ploughed snow banks) at stops that lasted weeks after the snowfall. A few special cases had problems that were not addressed:
- Where a street had permanent curb lane installations such as bump-outs for loading zones at stops, a windrow would be ploughed separating the streetcar lane from the waiting area making entry and exit from cars difficult, dangerous and in some cases impossible.
- Where a bike lane occupied the curb lane, there would be a windrow between the streetcar and bike lanes blocking transit access.
While the City is officially responsible for snow clearing, the TTC was noticeably silent on a critical issue of operational reliability and passenger safety. They talk a good line about “safety”, but here, in a real crunch, the TTC did nothing beyond pleading by press release with motorists to not block the tracks.
The 512 St. Clair cars run in reserved lanes on a wider-than-usual Toronto street, and snow clearing was much less of an issue for them. Looking over the two-month period, we can see the benefit of a clear, protected right-of-way when many other routes were snarled or inoperative thanks to parked cars.
St. Clair is a relatively short route running between Yonge Street (St. Clair Station) and Keele Street (Gunn’s Loop). It loops through St. Clair West Station underground. In theory, this should provide four points — the two termini and the midpoint at St. Clair West both ways — where service could be regulated easily. Actual headway data show highly erratic service even during the pre-snow period.
By contrast, travel times along the route were consistent, with only small variations thanks to the storm, indicating that the snow was not a major problem. Of course, with a reserved lane, the TTC’s favourite chestnut about “congestion” could not be blamed for headway problems.
The charts in this article show both the travel times and headways (spacing between vehicles) for 512 St. Clair in January and February 2025, as well as detailed charts for specific days.
Weather
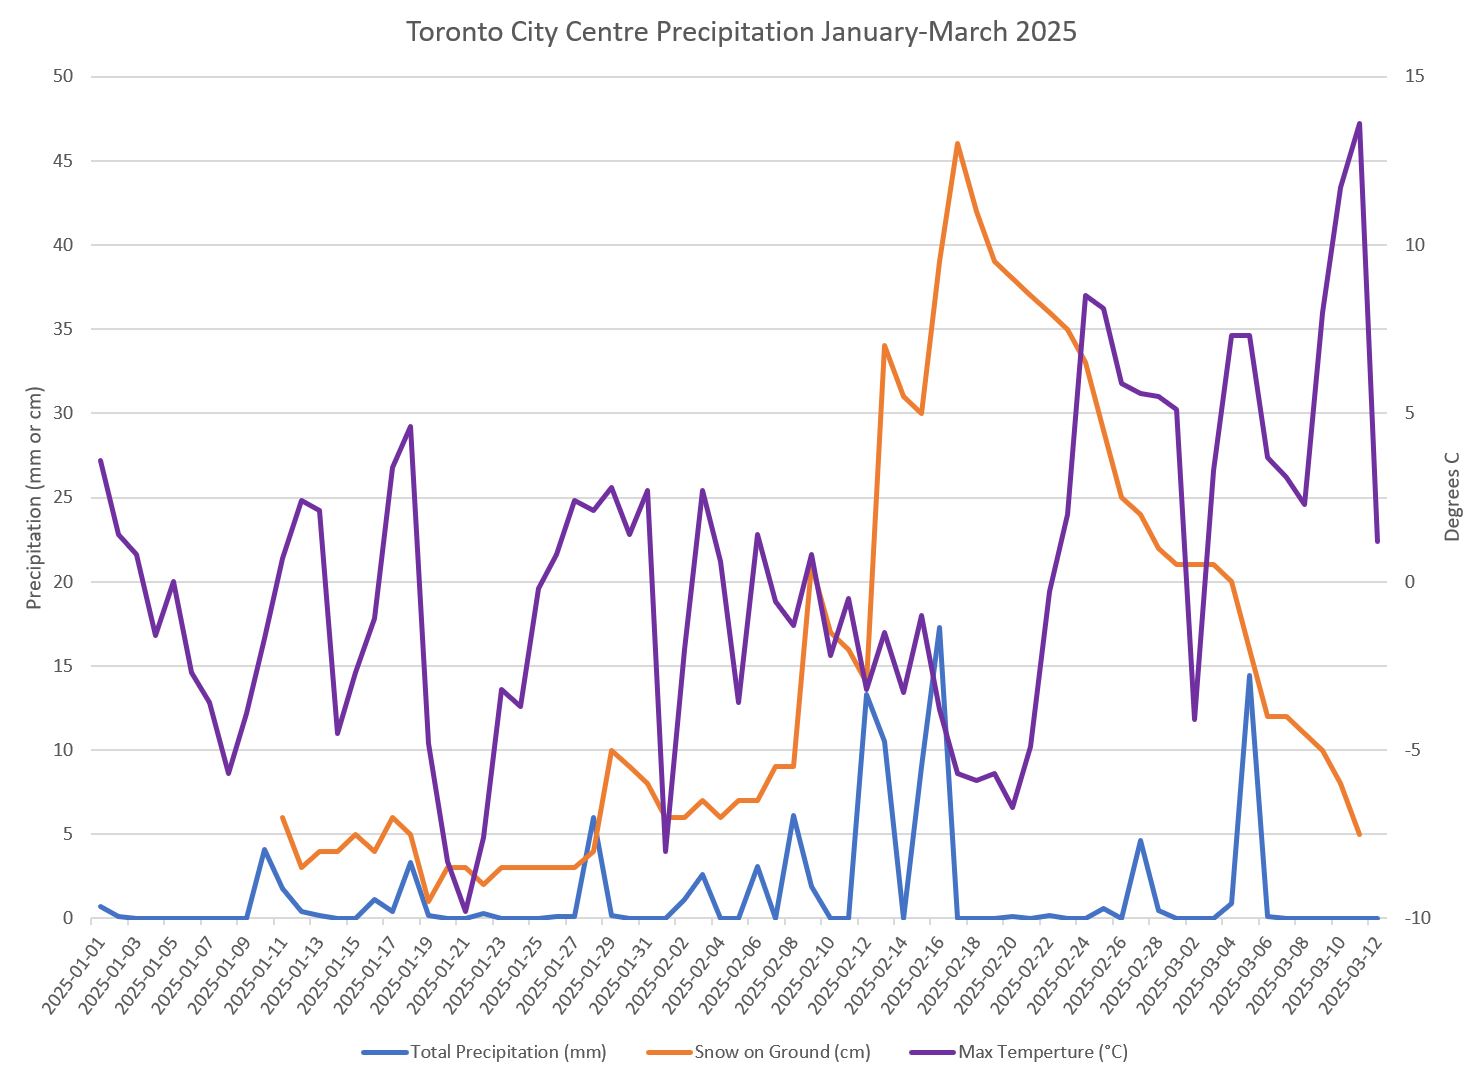
The chart below shows the amount of precipitation (blue), accumulated snow on the ground (orange) and daily maximum temperature (purple) for January through early March when with warmer weather the snow finally disappeared.
Although there were some very cold days in January, the precipitation and snow accumulation did not begin until mid-February. Two storms on February 12 and 16, coupled with below-zero temperature caused a snow build-up to 46 cm (18 inches) by February 17.
Service Interruptions
The table below shows the delays to 512 St. Clair as reported in eAlerts. There are only two “blocked track” delays late on February 17-18. A general delay due to weather was reported on February 27. This is completely unlike other streetcar routes where blockages were common due to the lack of snow clearing, even in early March.
Where extremely long delays are reported via eAlerts, the all-clear is sometimes not issued until many hours after the event. There can be a flurry of notices in the middle of the night presumably when the still-open events of the past day are marked “resolved”. Reconciling the delay reports with actual operations can be done with tracking data.
- Jan 10: The medical emergency only held one car at St. Clair West Station. No other service was affected.
- Feb 10: The general delay notice at 13:19 was not cleared until 22:56 although tracking data show that the problem actually ended after 13:30 with residual effects due to bunching until 14:30.
- Feb 16: The long delay due to a collision at 13:06 is correctly reported as ending after 18:00.
- Feb 19: The medical emergency beginning at 21:08 actually cleared before 22:00, not at 3:37 as shown.

Travel Times
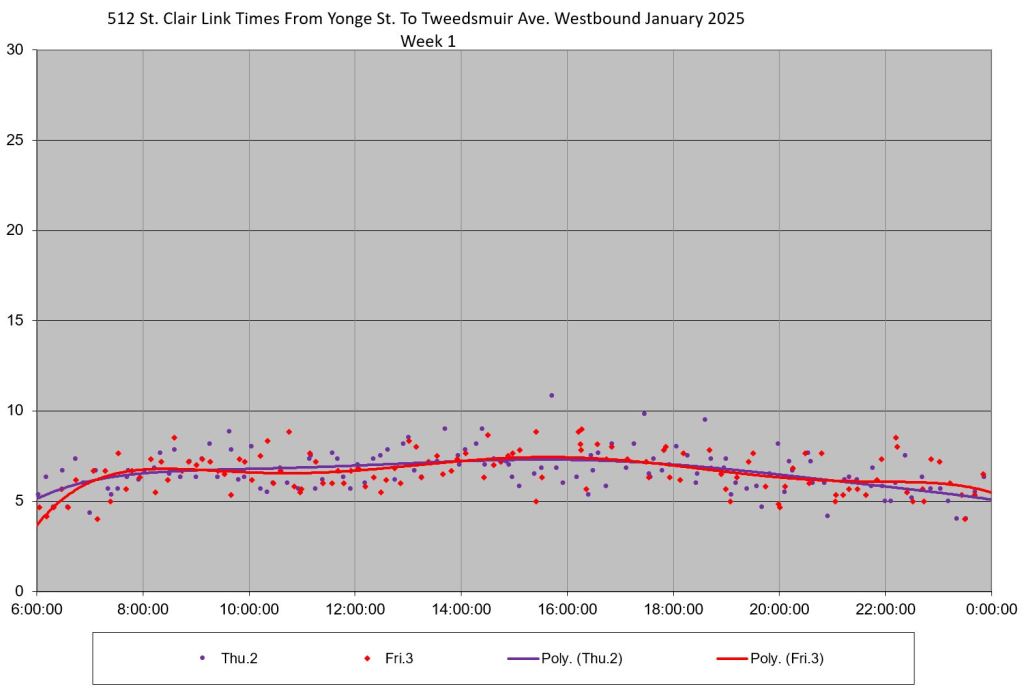
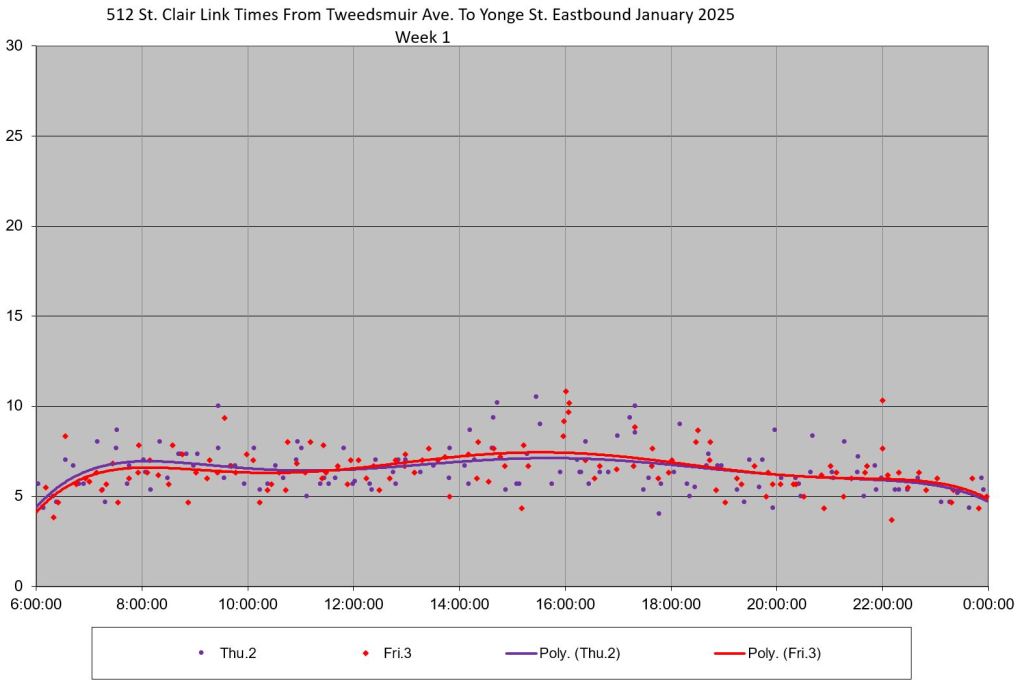
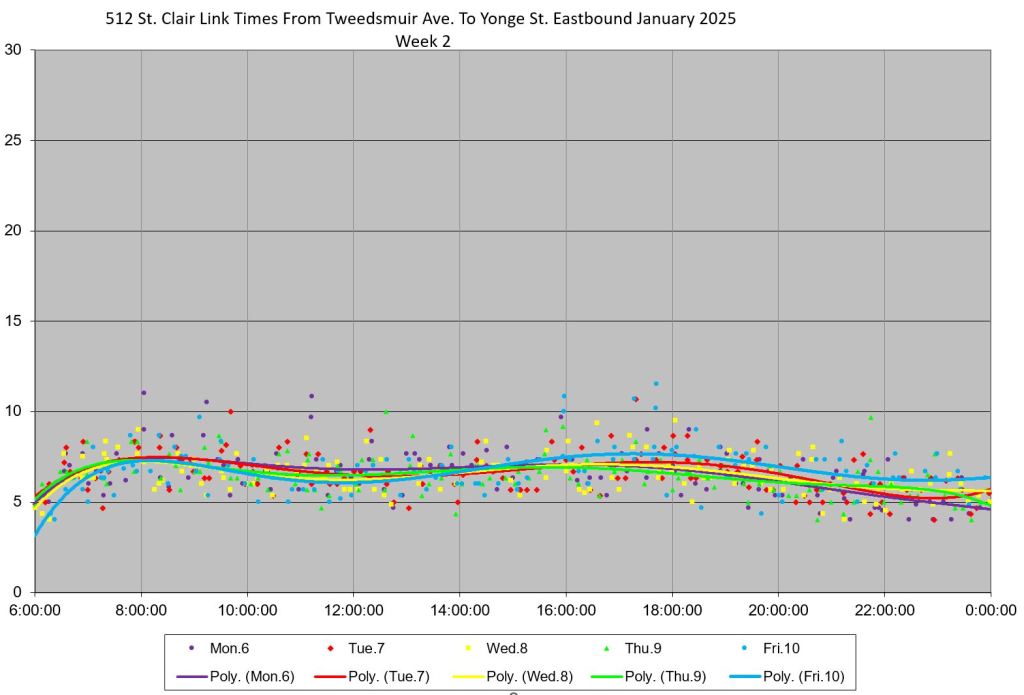
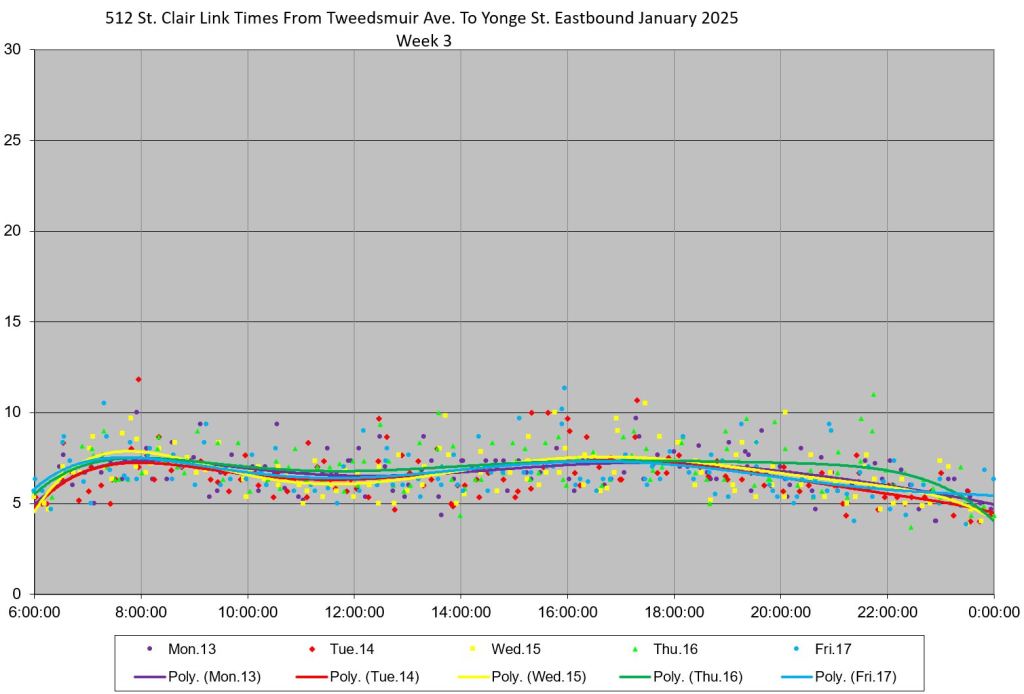
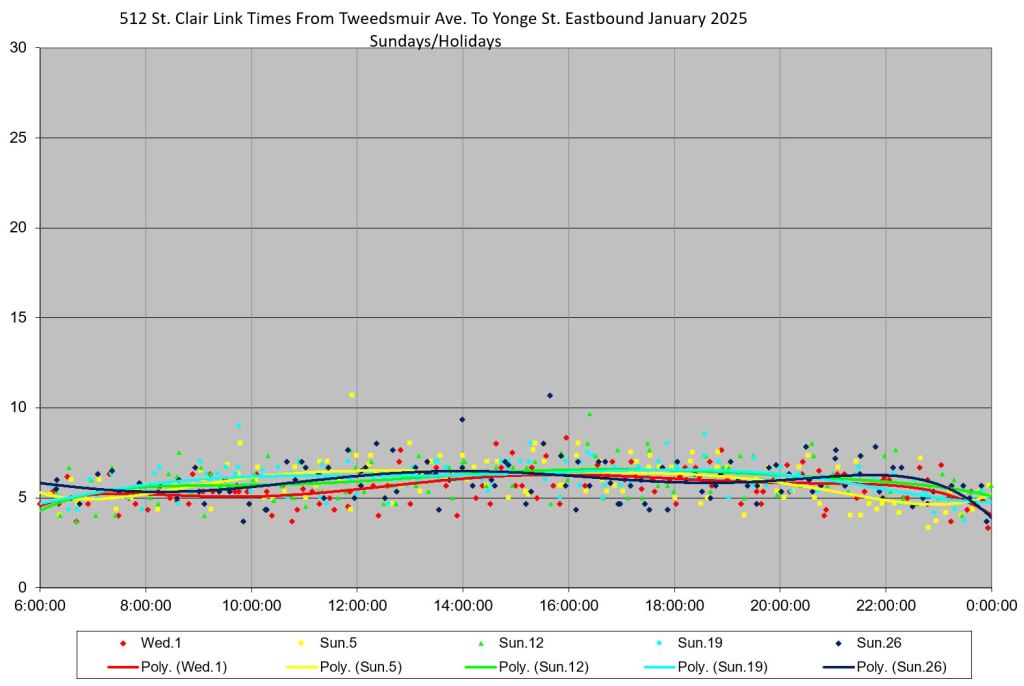
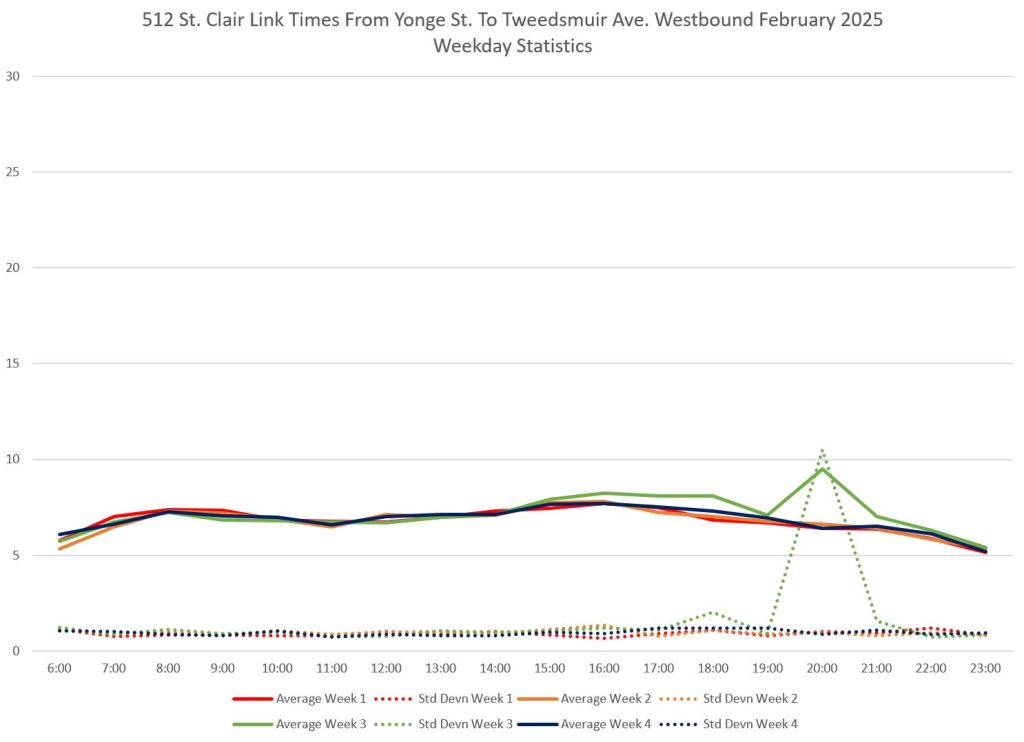
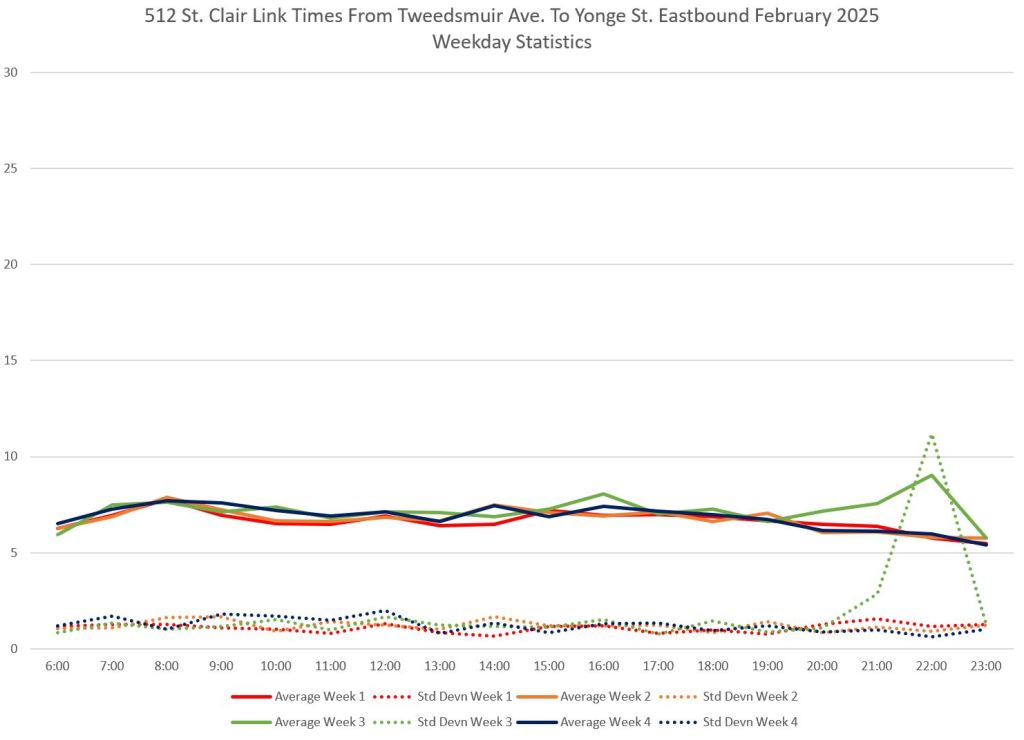
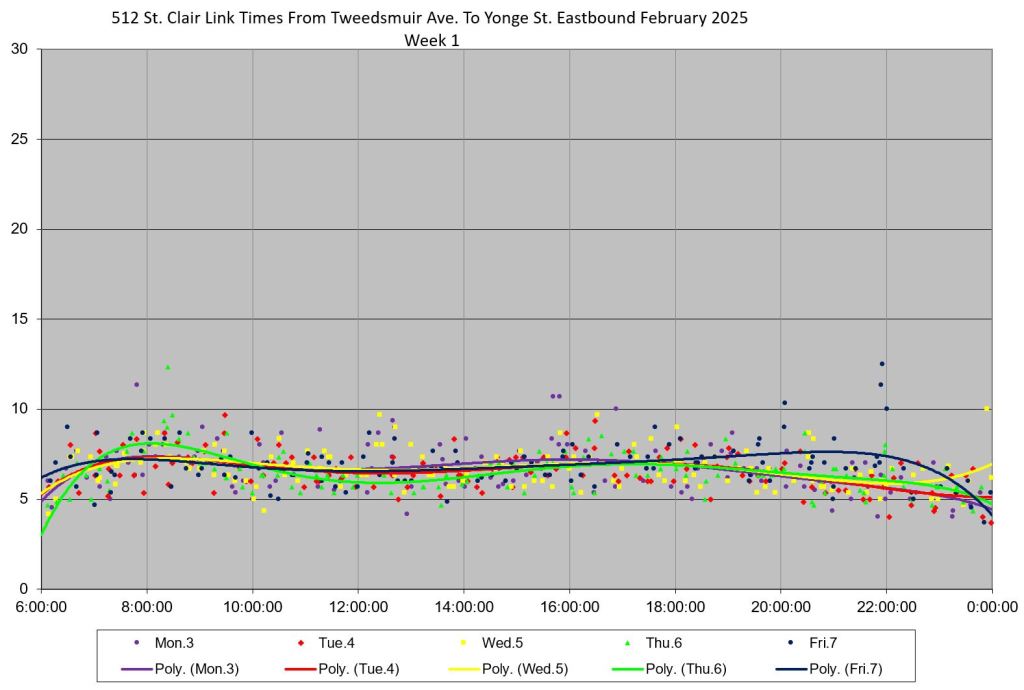
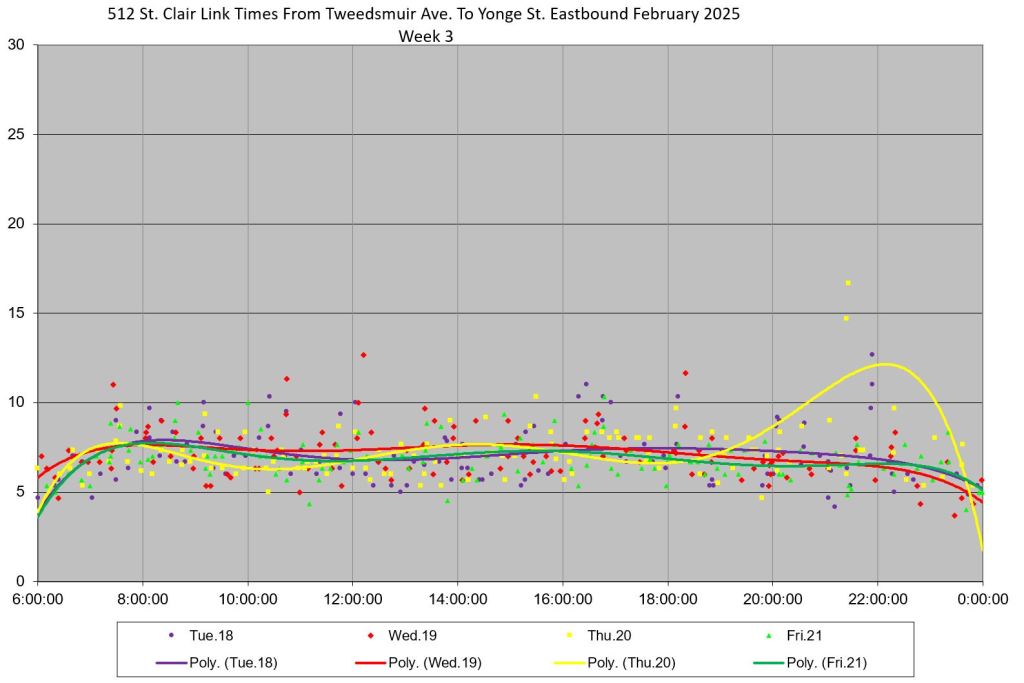
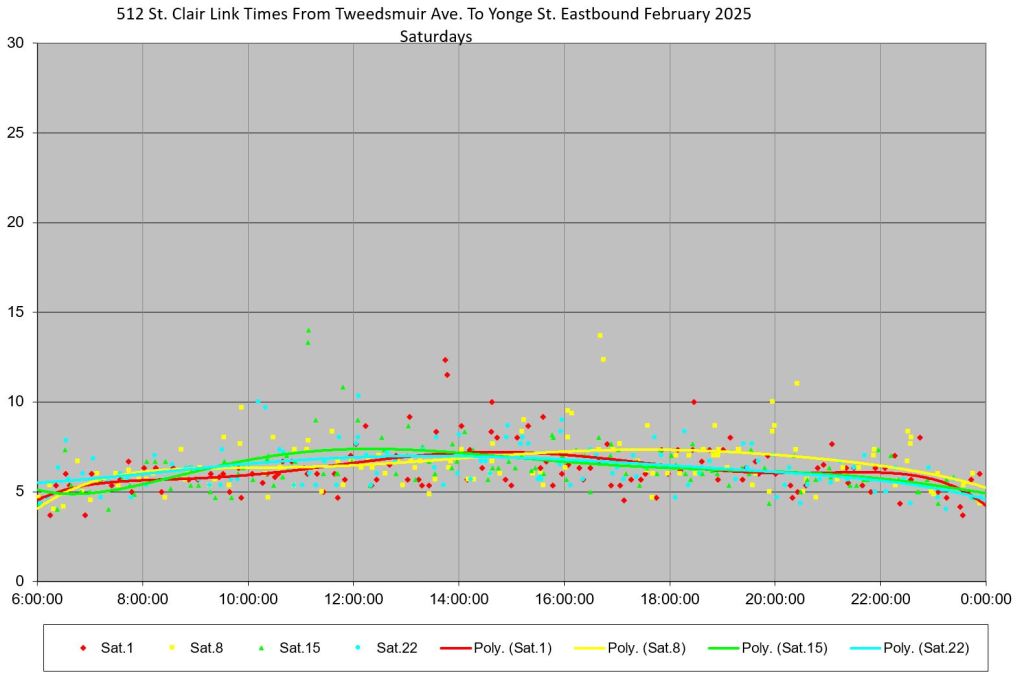
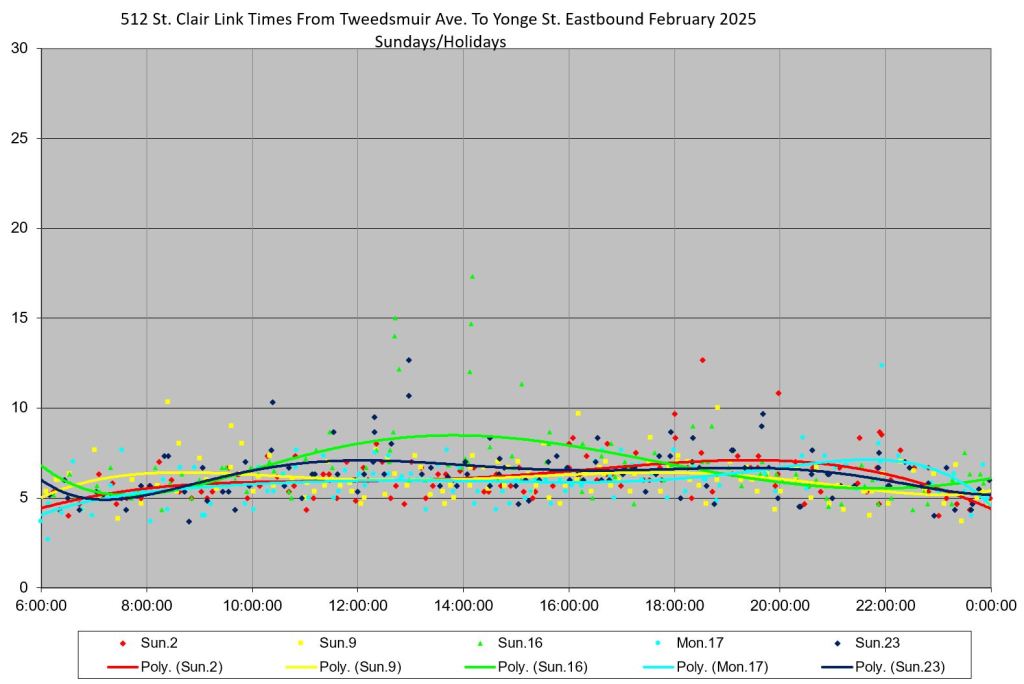
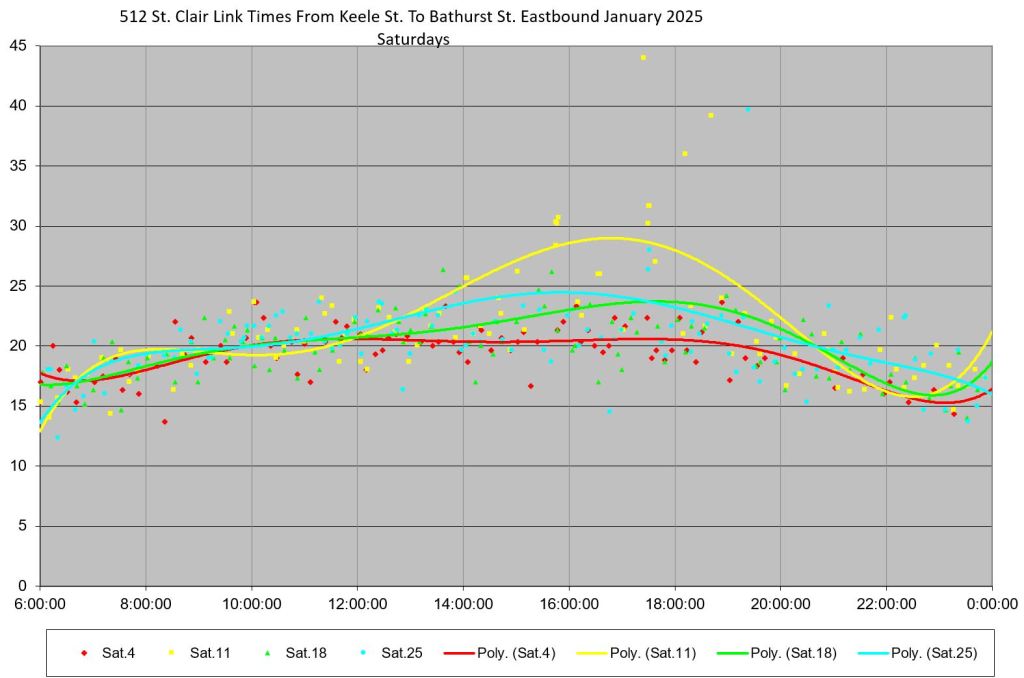
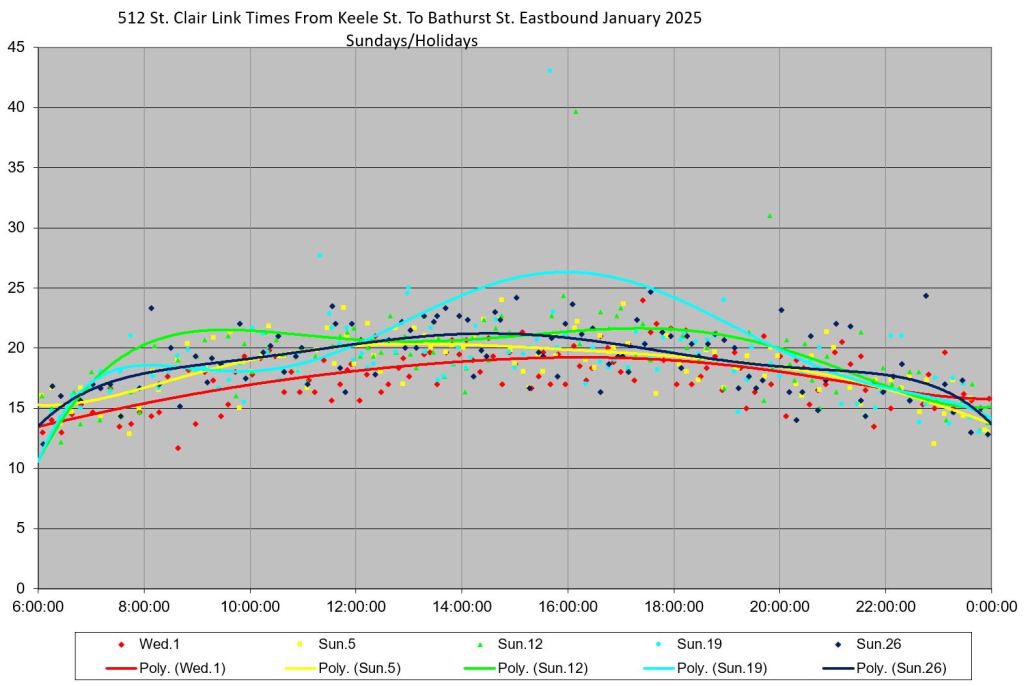
Yonge to Tweedsmuir
The eastern segment of the route between St. Clair and St. Clair West stations shows very consistent travel times for both directions in both months. For this analysis, the screenlines lie at Yonge Street and at Tweedsmuir, the street just east of the portal to St. Clair West Station.
January


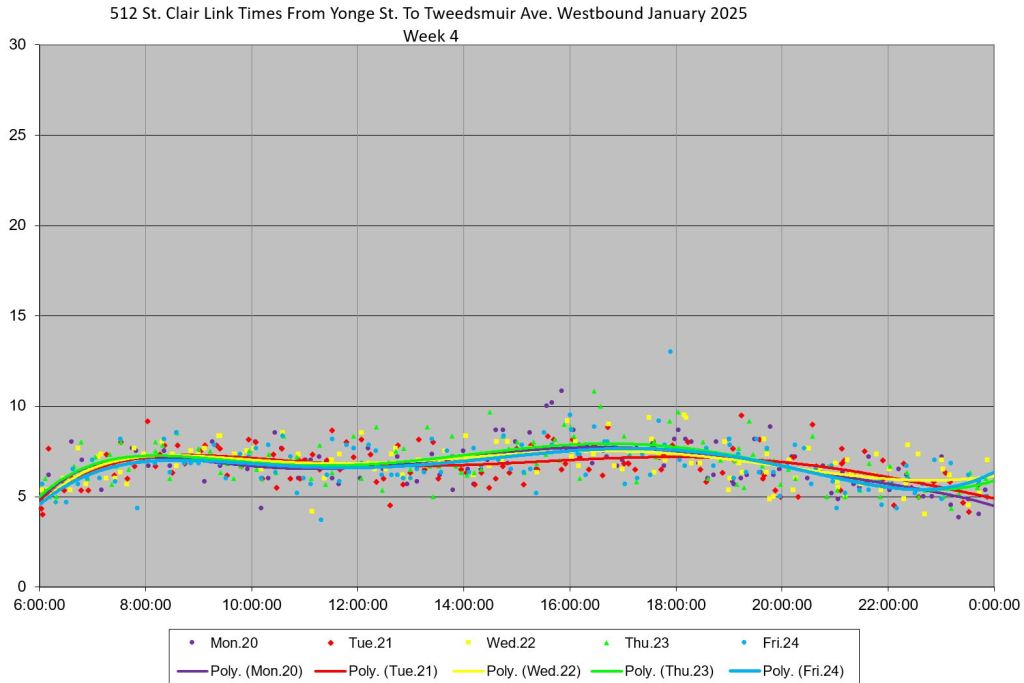

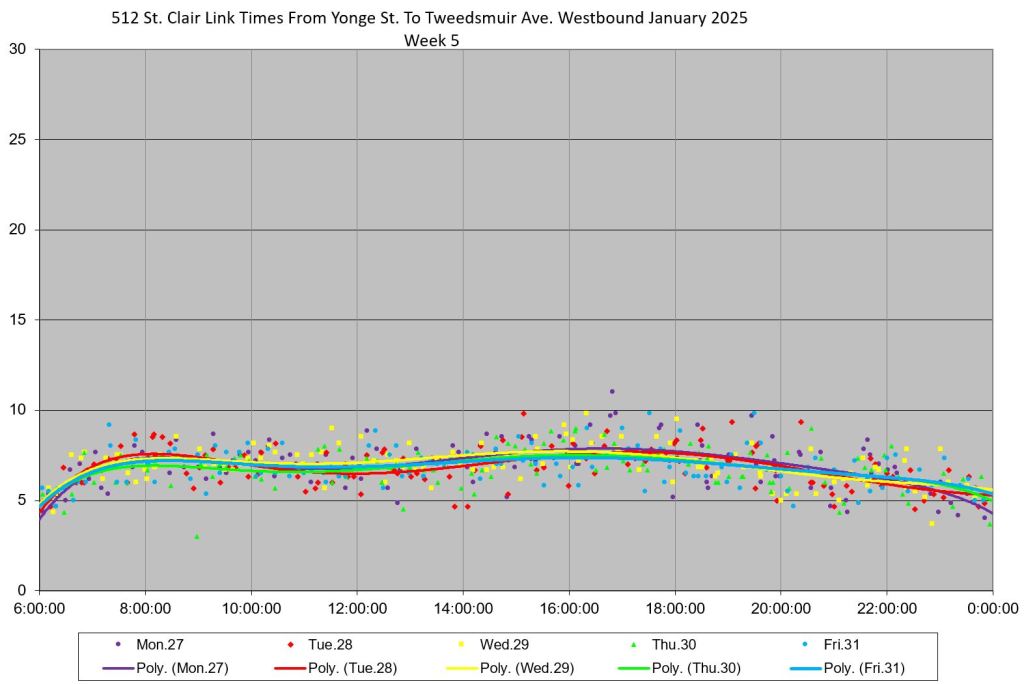


February
The rise in the trend line for Wednesday, February 19 in the evening westbound was caused by long trips for two cars that were held westbound for about 40 minutes. This is the medical emergency noted in the eAlerts. (The actual data points do not appear in the chart because the values 51 and 47 minutes, but they skew the trendline upward.)
The ride in the trend line for Thursday, February 20 in the evening eastbound was caused by a parade of cars arriving at Yonge Street. Two of them queued west of Yonge Street adding to the reported travel time to reach the screenline at the intersection.


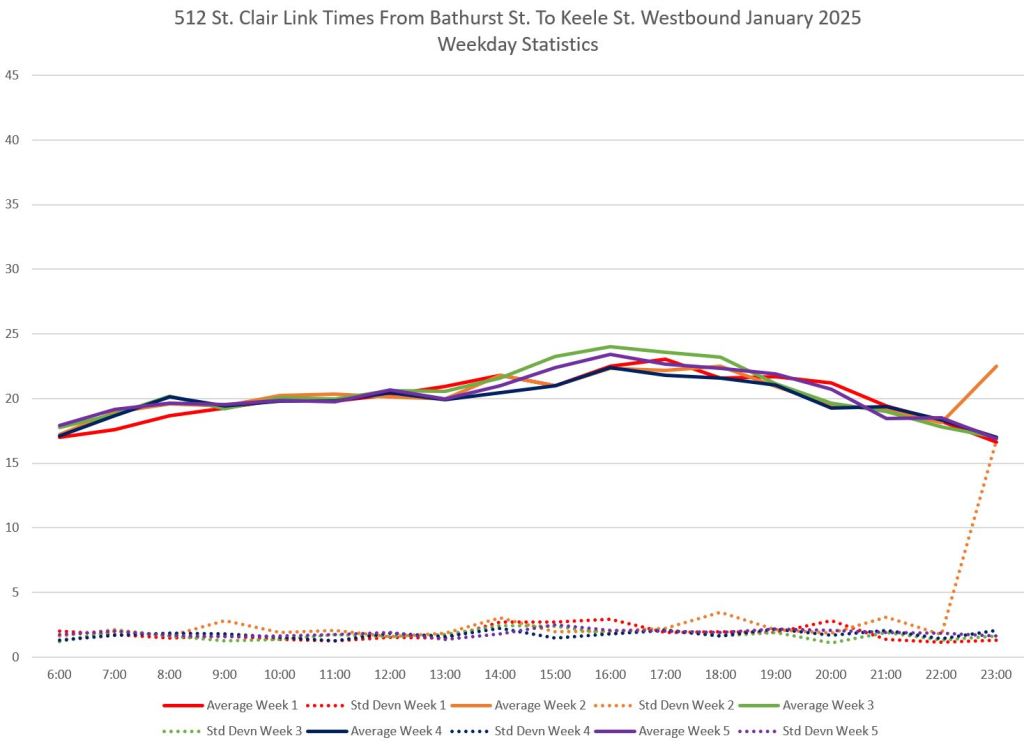
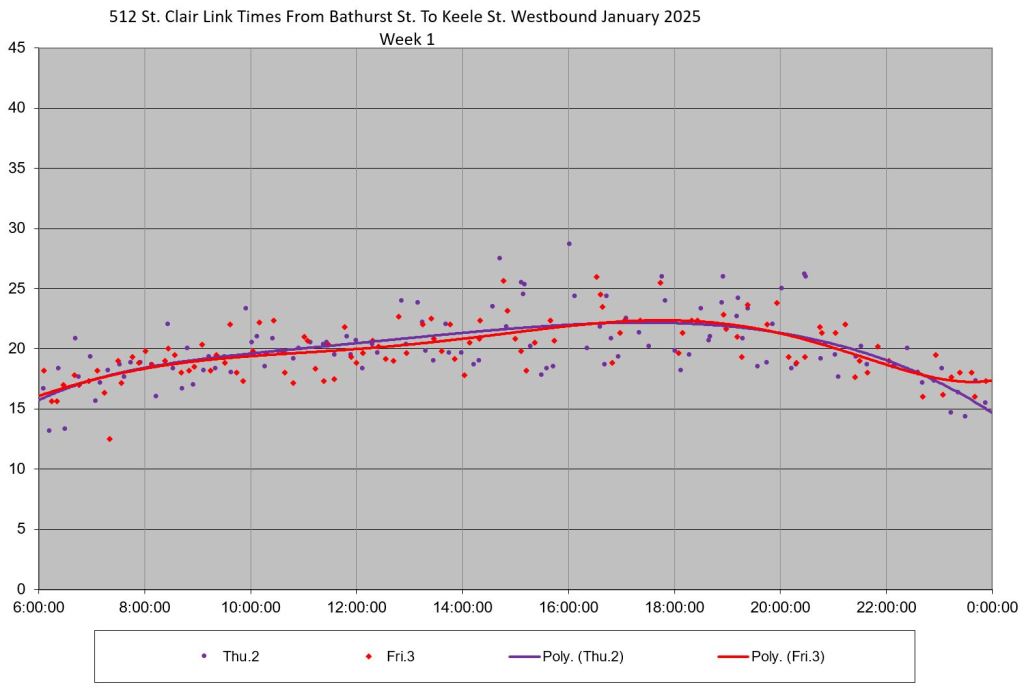
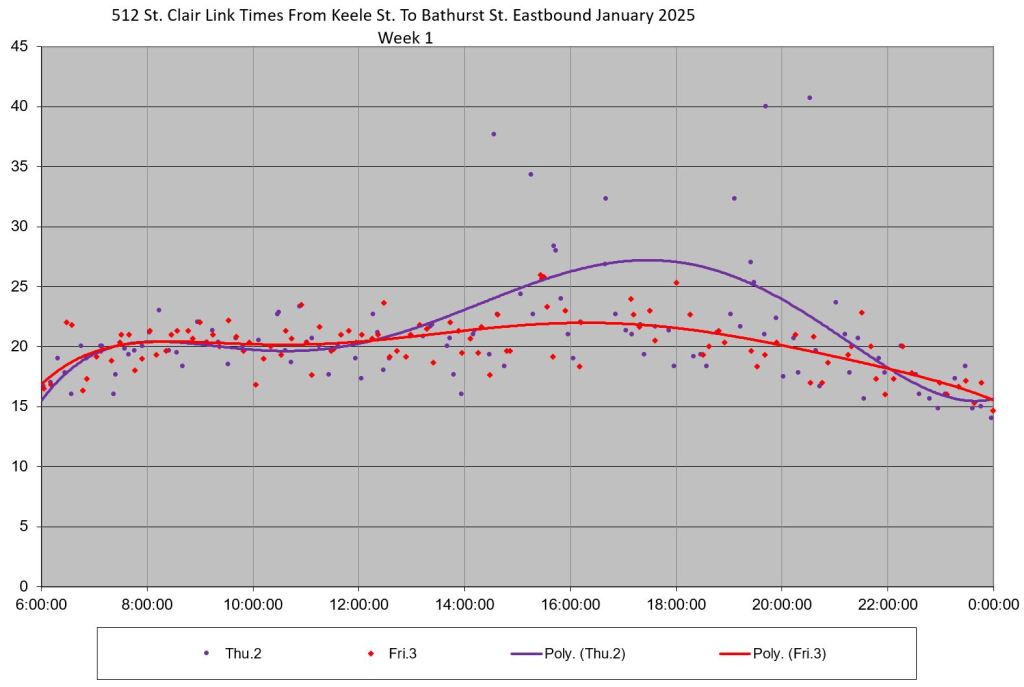
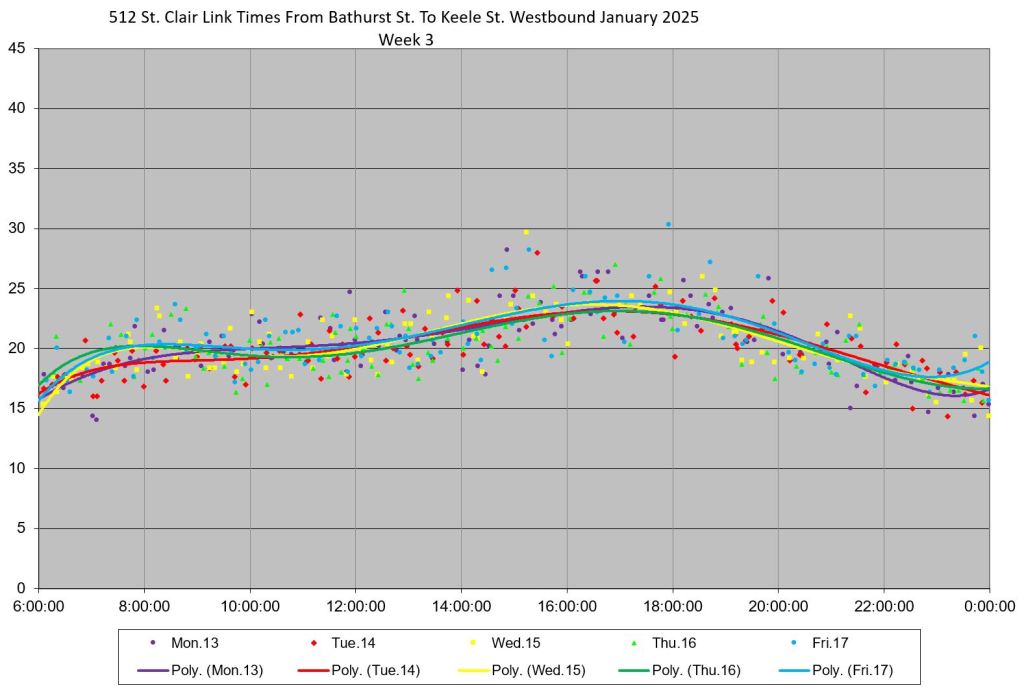
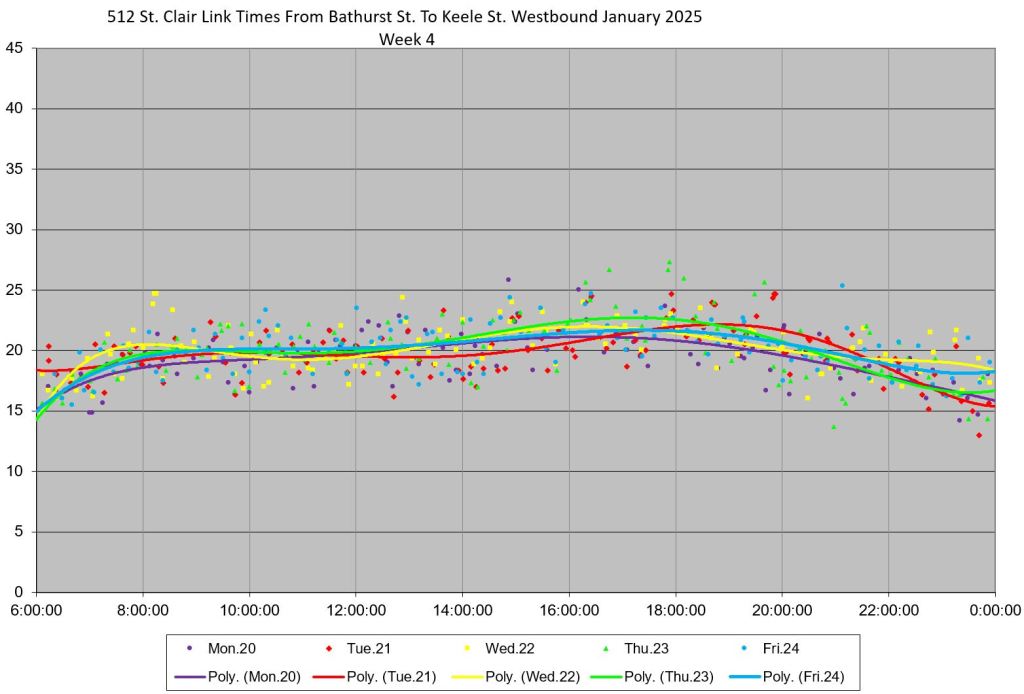
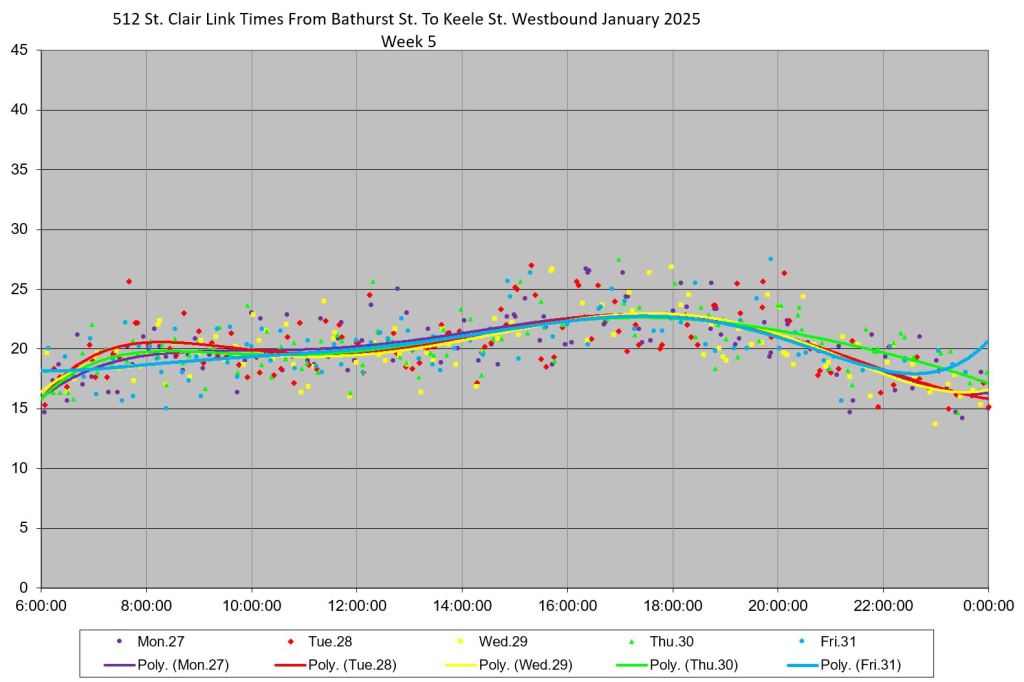
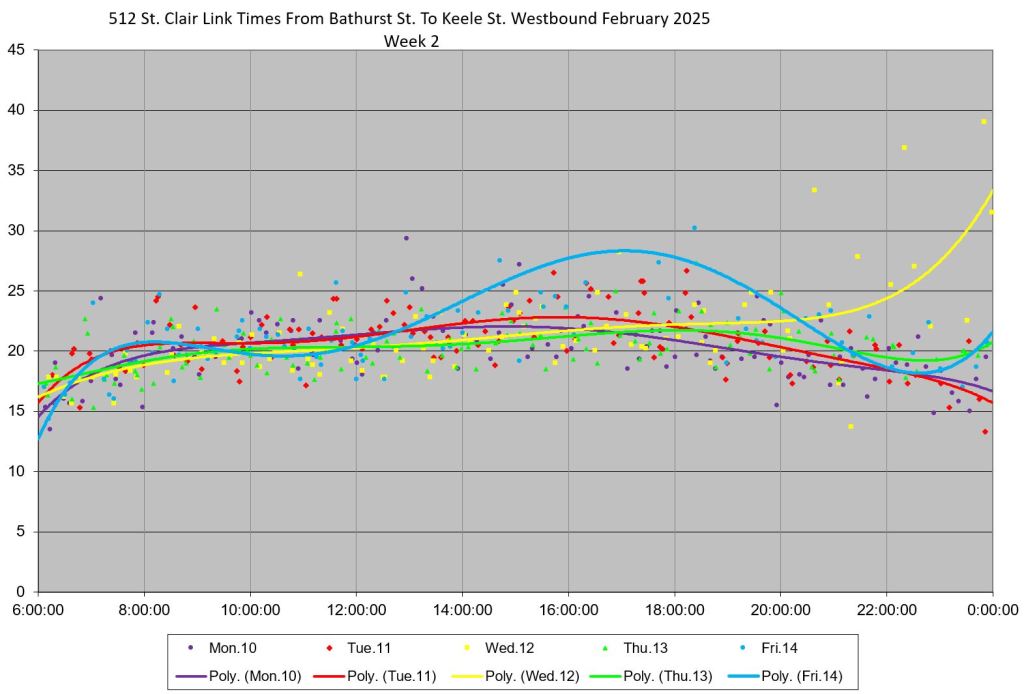
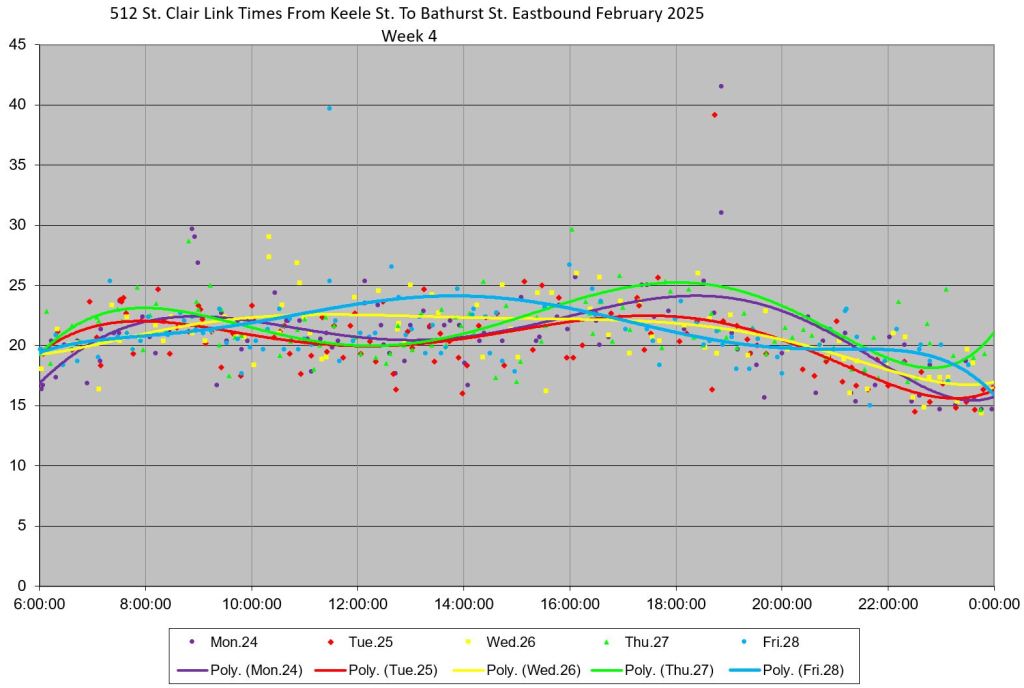
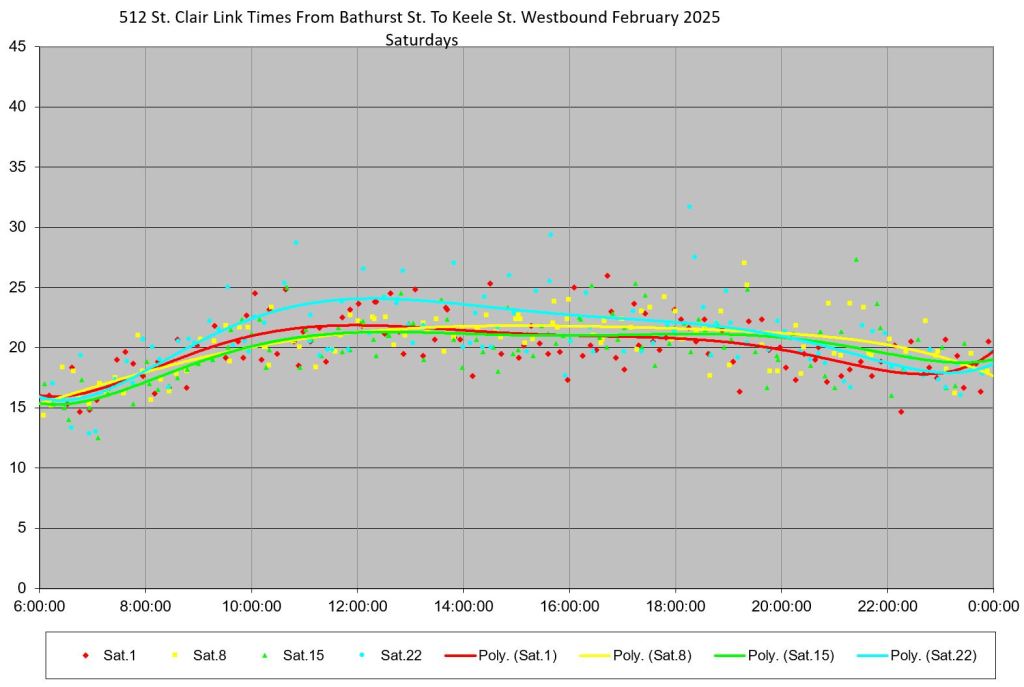
Bathurst to Keele
The western segment of the route lies between St. Clair West Station and Gunn’s Loop. For this analysis, the screenlines are at Bathurst and Keele Streets.
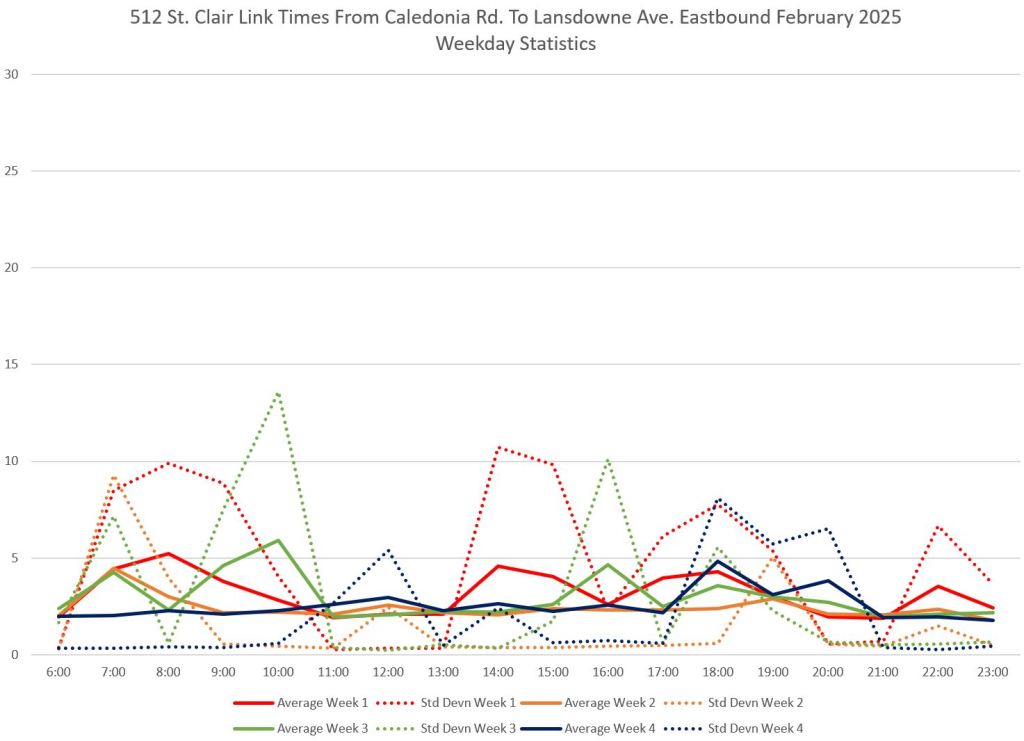
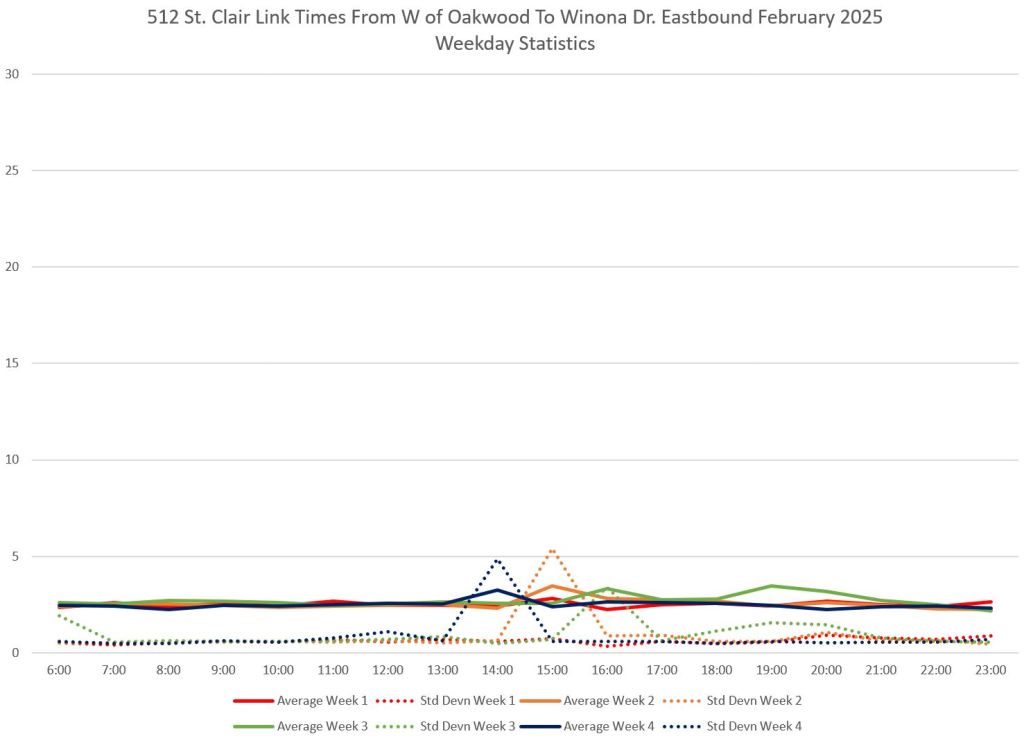
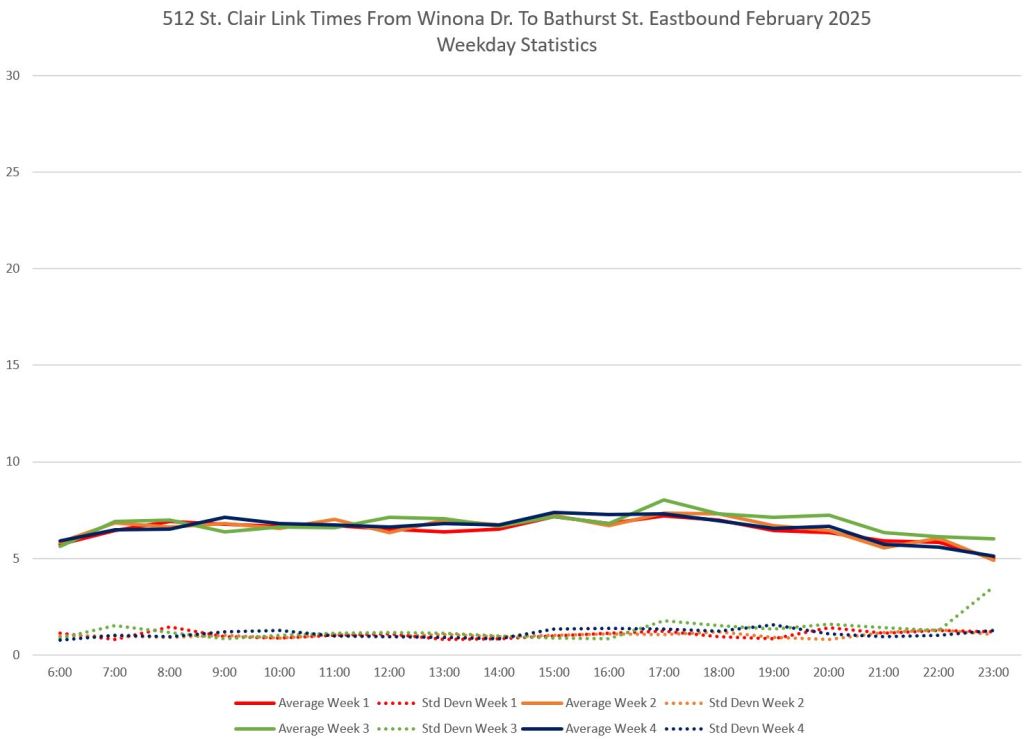
Travel times are much less reliable here, particularly in the evening, with eastbound times showing considerable variation with large standard deviations in values in both January and February. Looking at the data in greater detail shows that this is almost entirely due to eastbound cars taking extended layovers in Earlscourt Loop. The track layout allows cars to enter the loop from either direction making an eastbound stopover possible.
Because these cars only cross the Lansdowne screenline after continuing their journeys, the layover time is counted in the travel time for the segment from Caledonia to Lansdowne, while values for other segments are similar to westbound travel with little variation. This is an example of how actual operational practices can skew statistics, and detailed review is needed to understand what is happening. (A look at travel times broken by shorter route segments appears after this section.)
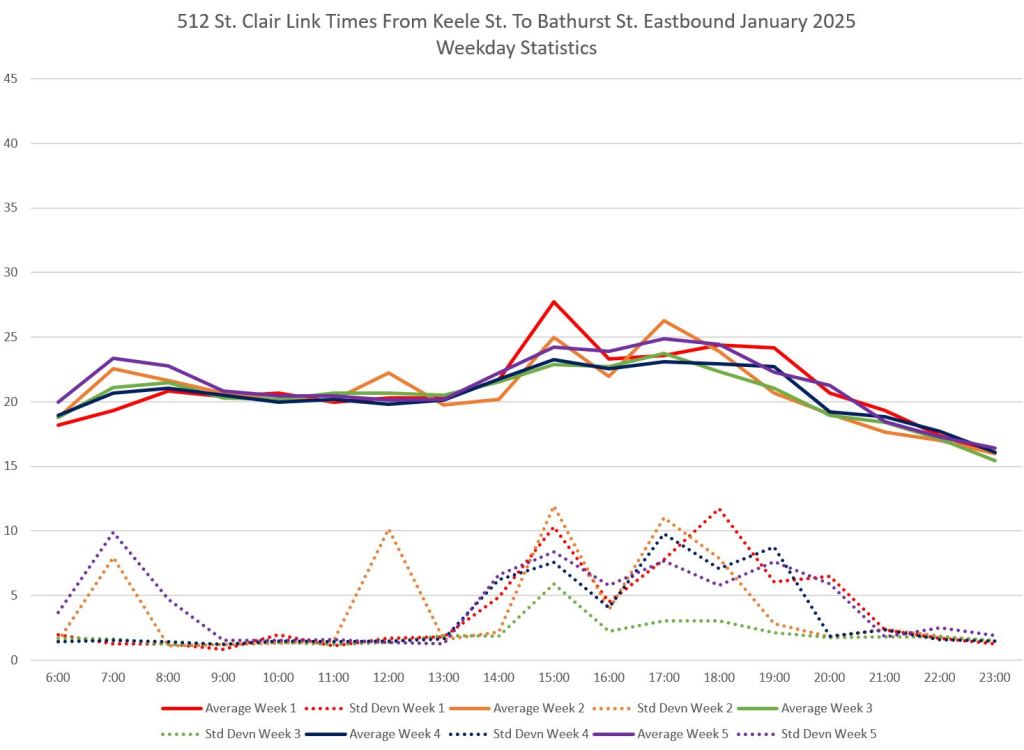

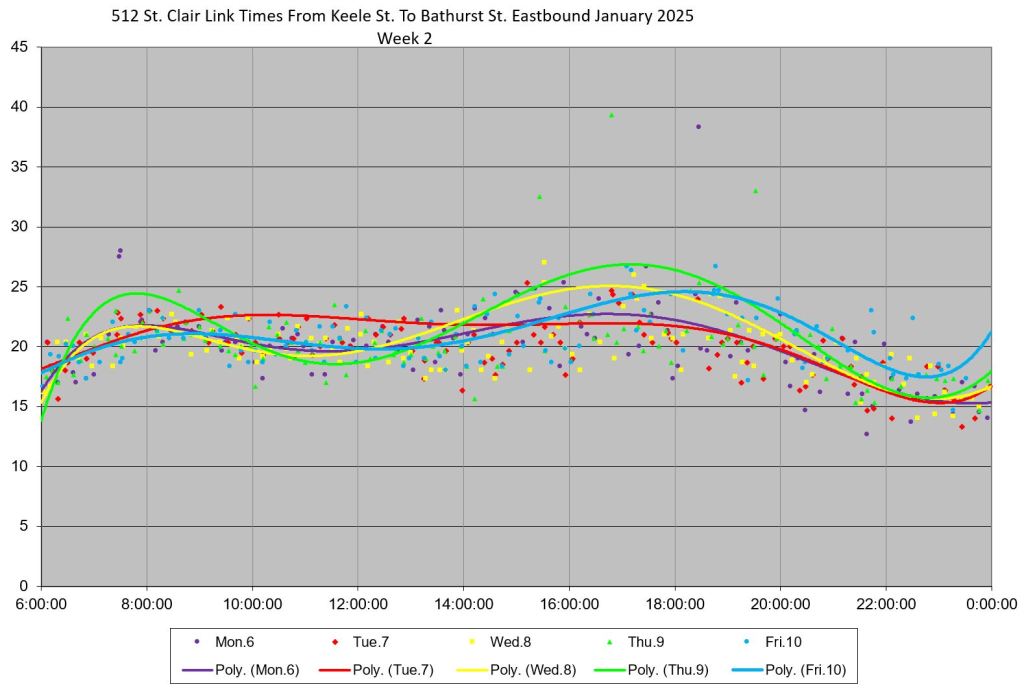

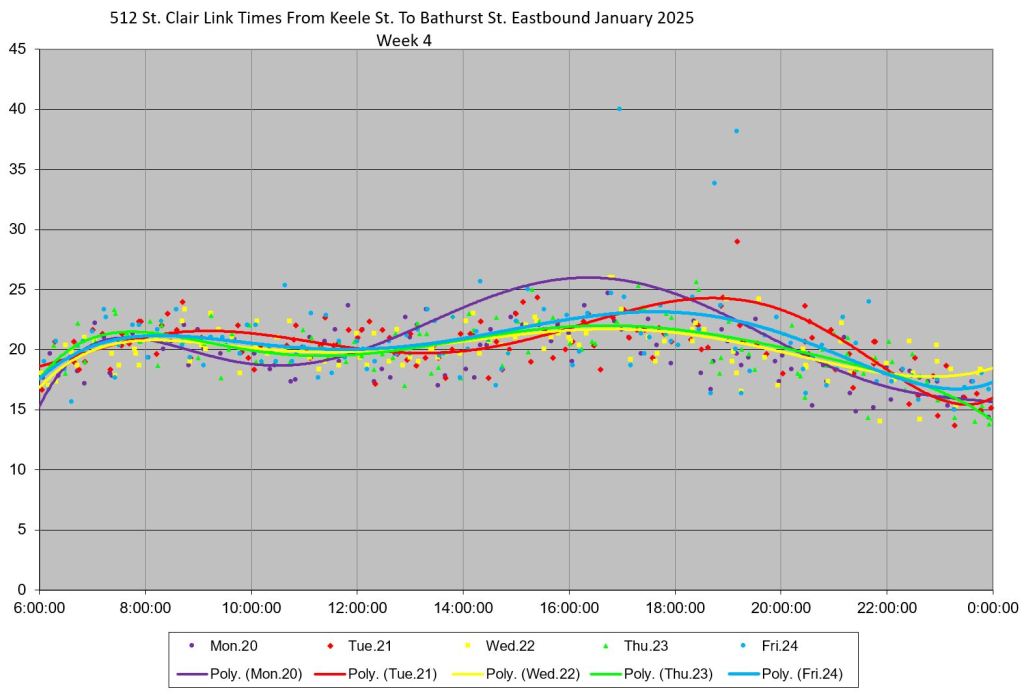


February


Layovers at Lansdowne and Oakwood Eastbound
The erratic travel times eastbound mostly occur in the segment from Caledonia to Lansdowne. Earlscourt Loop lies between the two streets, and it can be entered from the west as well as the east. Similarly, Oakwood Loop can be entered from either direction. Both of these loops, particularly Earlscourt, see cars taking extended layovers eastbound that contribute to the travel time over the full Keele-to-Bathurst segment. The variations in standard deviations of travel times are due to these outliers in the data, not to congestion.
The charts below show travel times by segment eastbound from Keele Street to Bathurst Street in February 2025.


Service Reliability
Scheduled Service
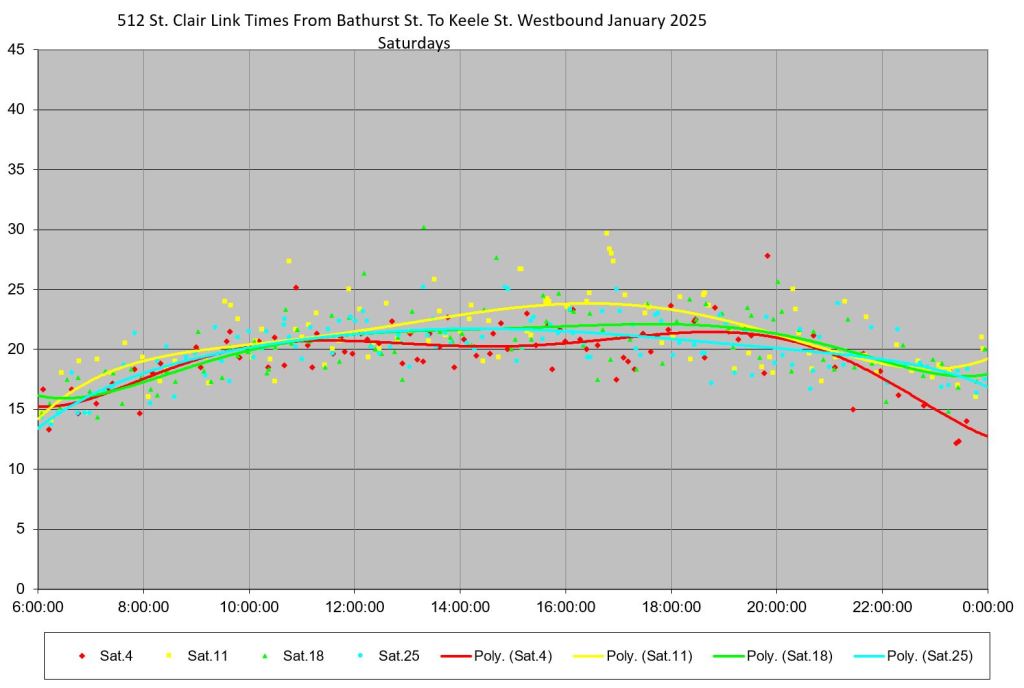
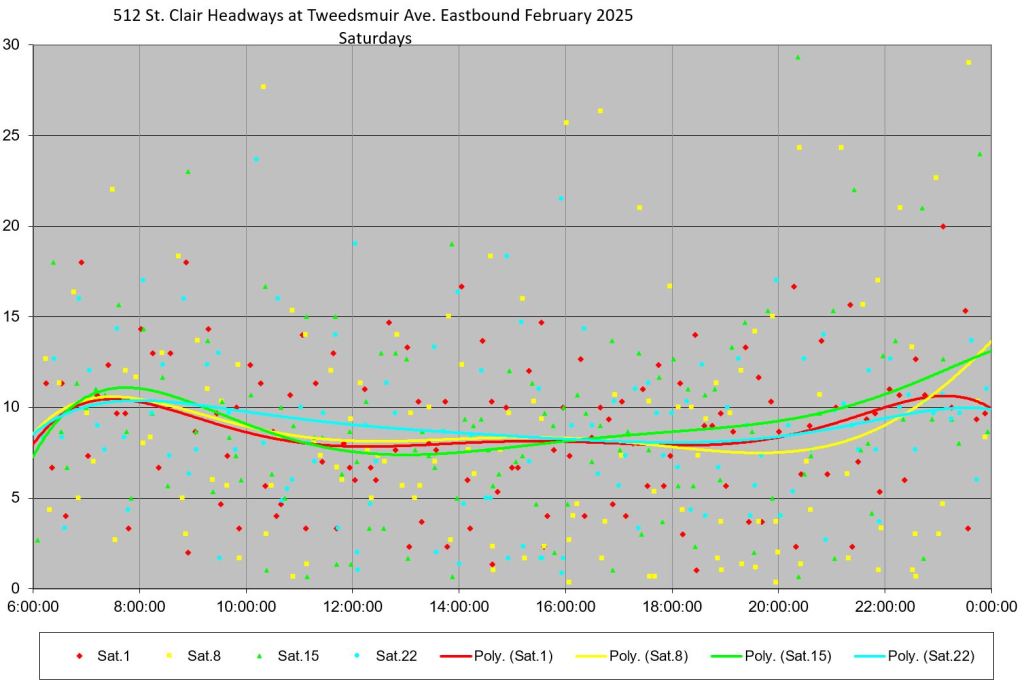
The scheduled service on 512 St. Clair ranges from 8 to 10 minutes depending on the time of day, and whether it is a weekend.

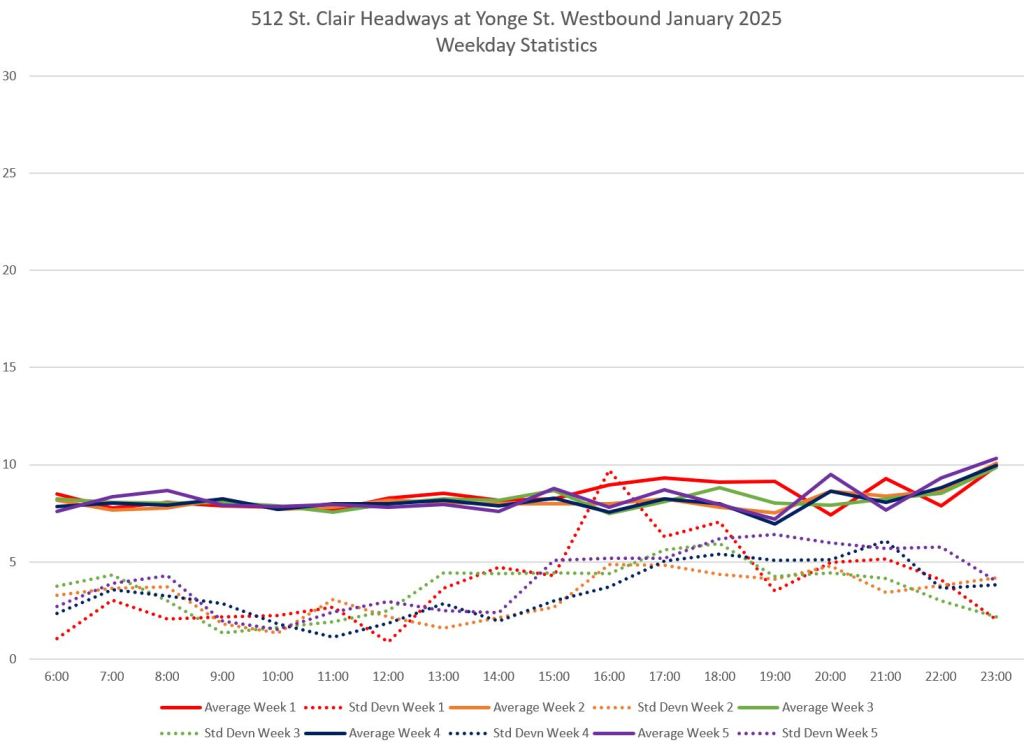
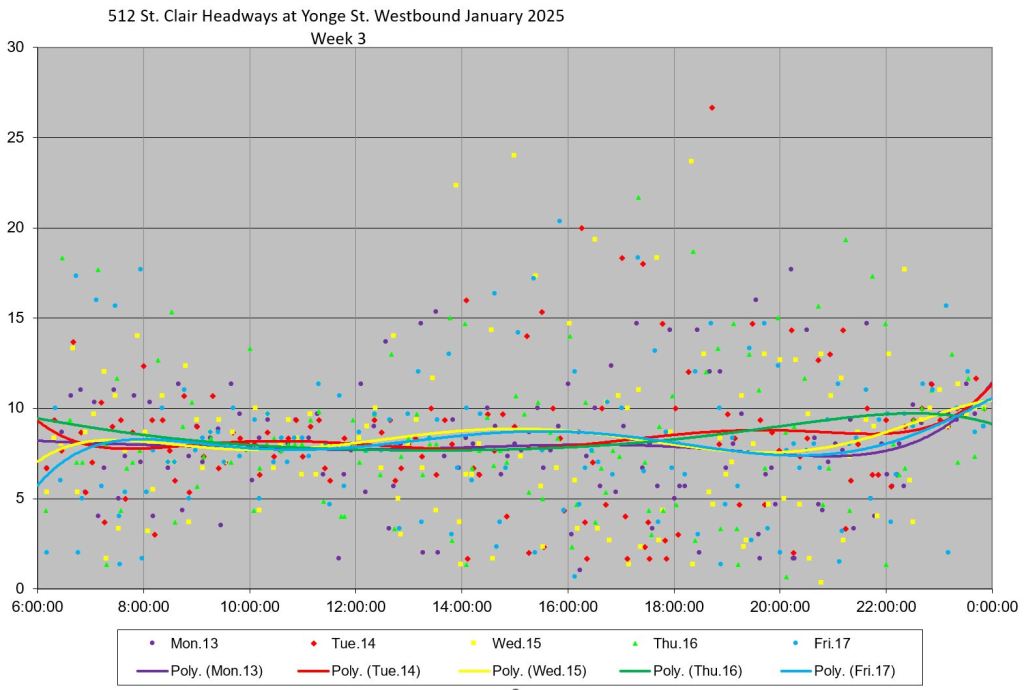
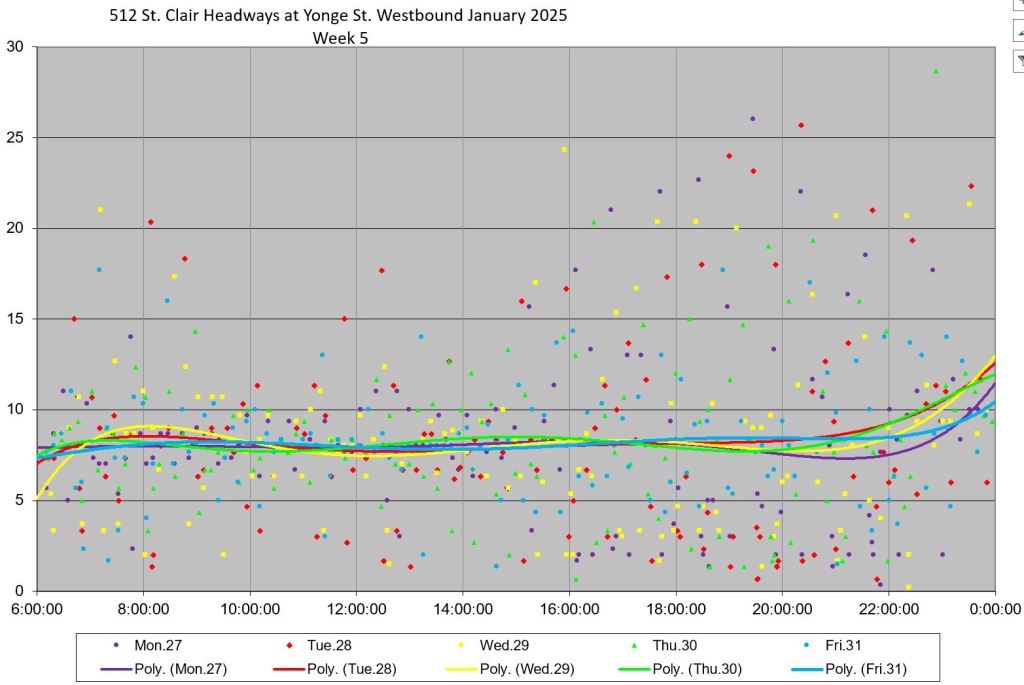
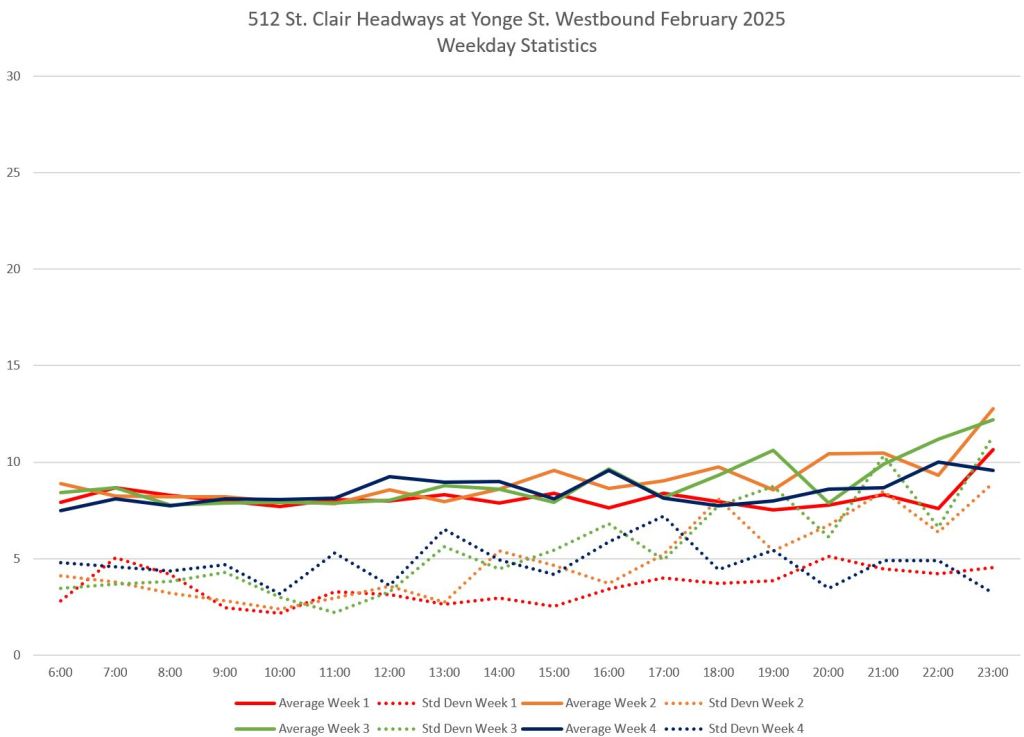
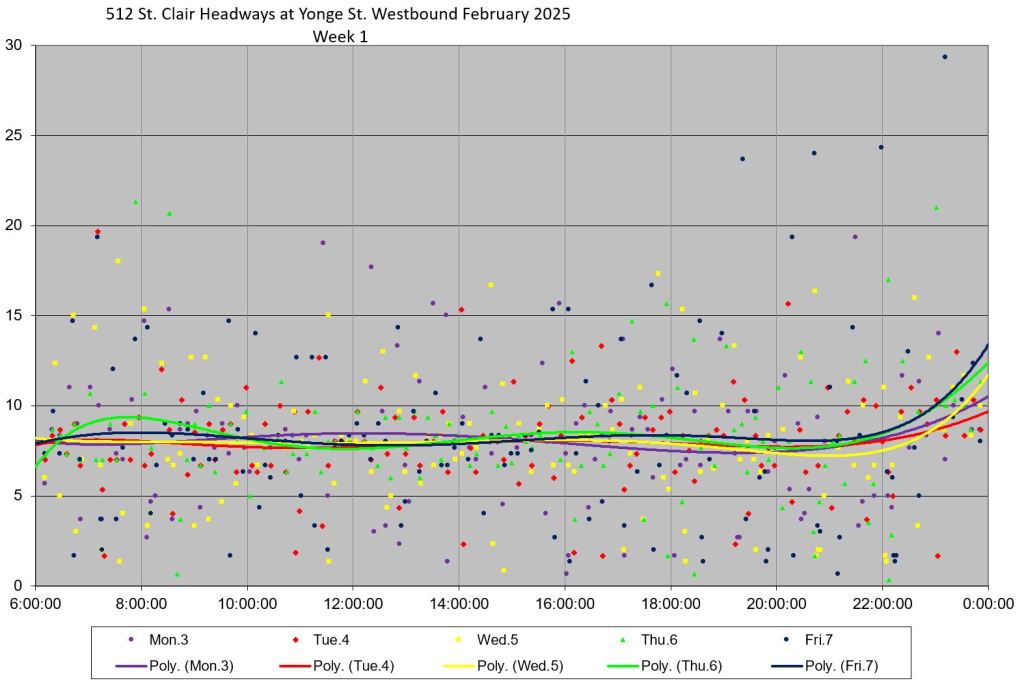
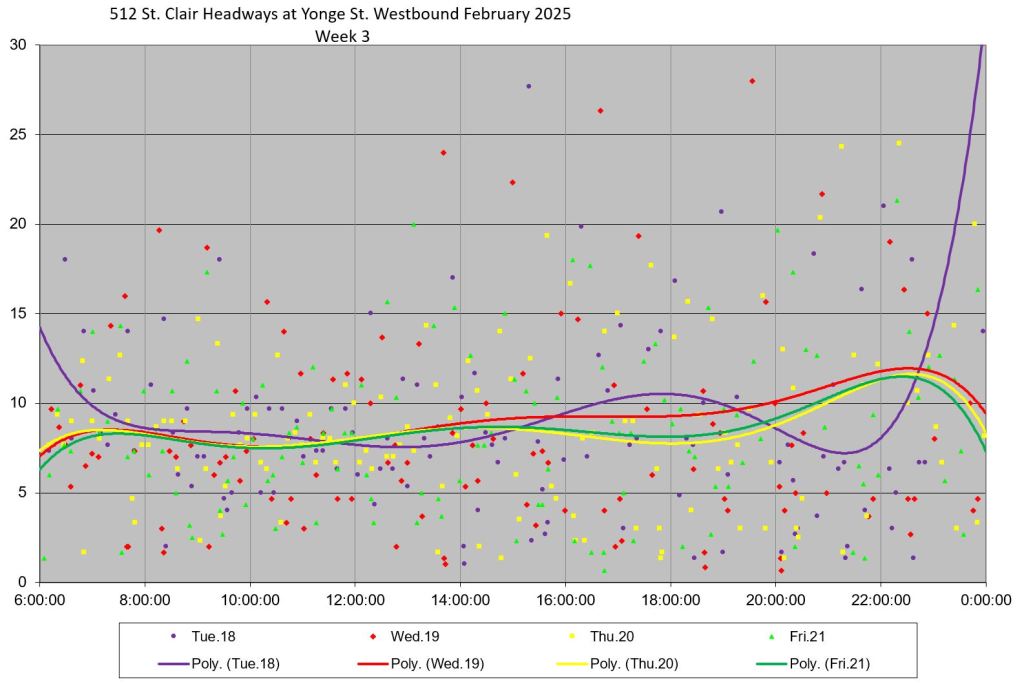
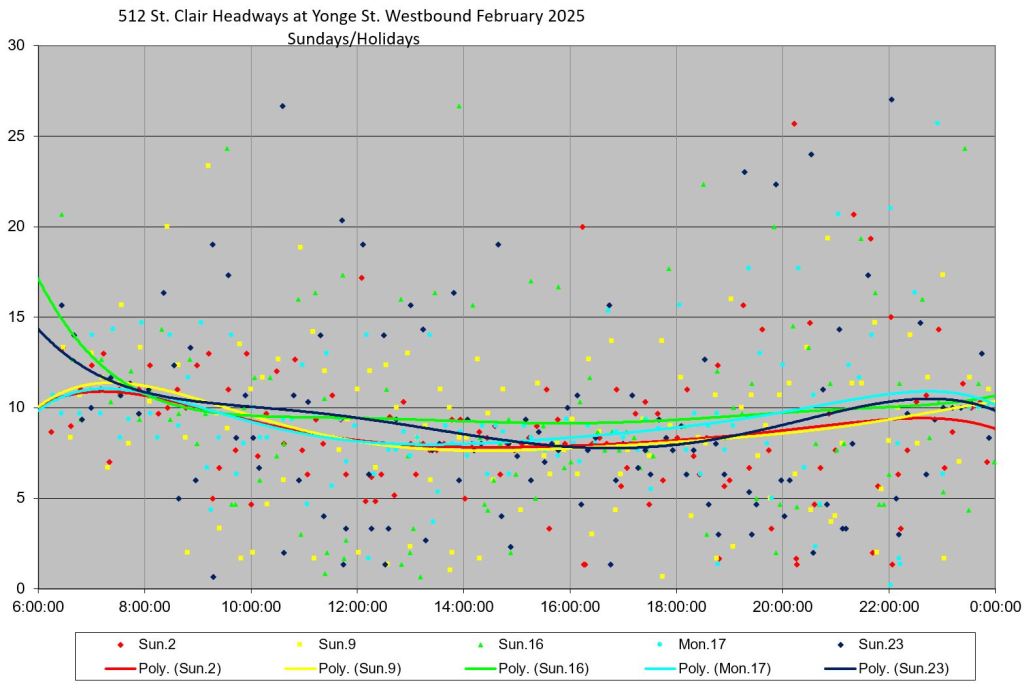
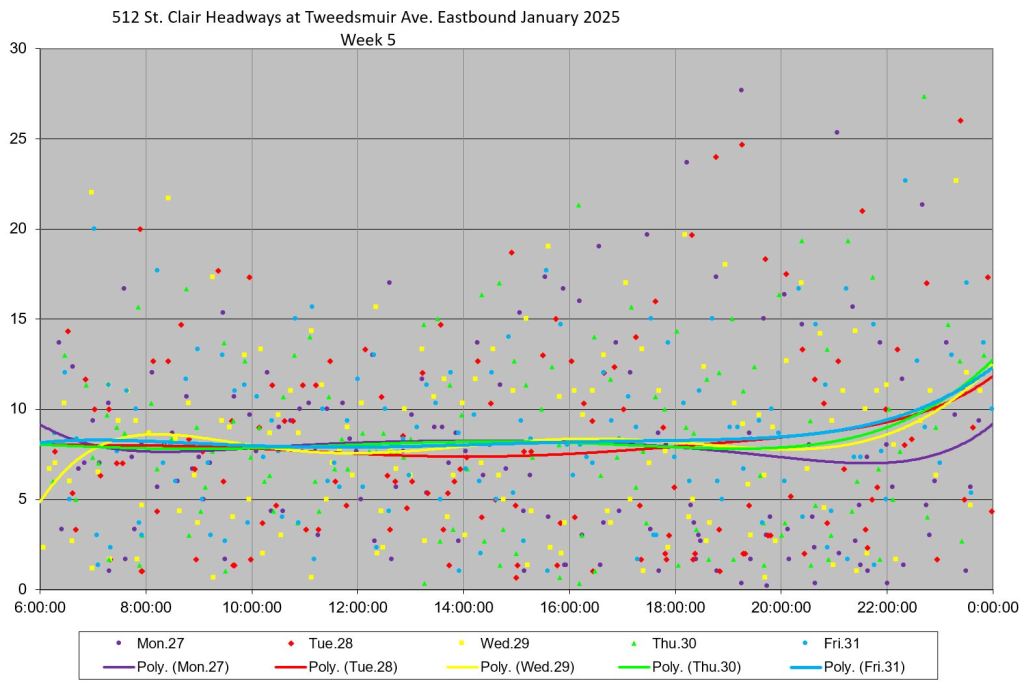
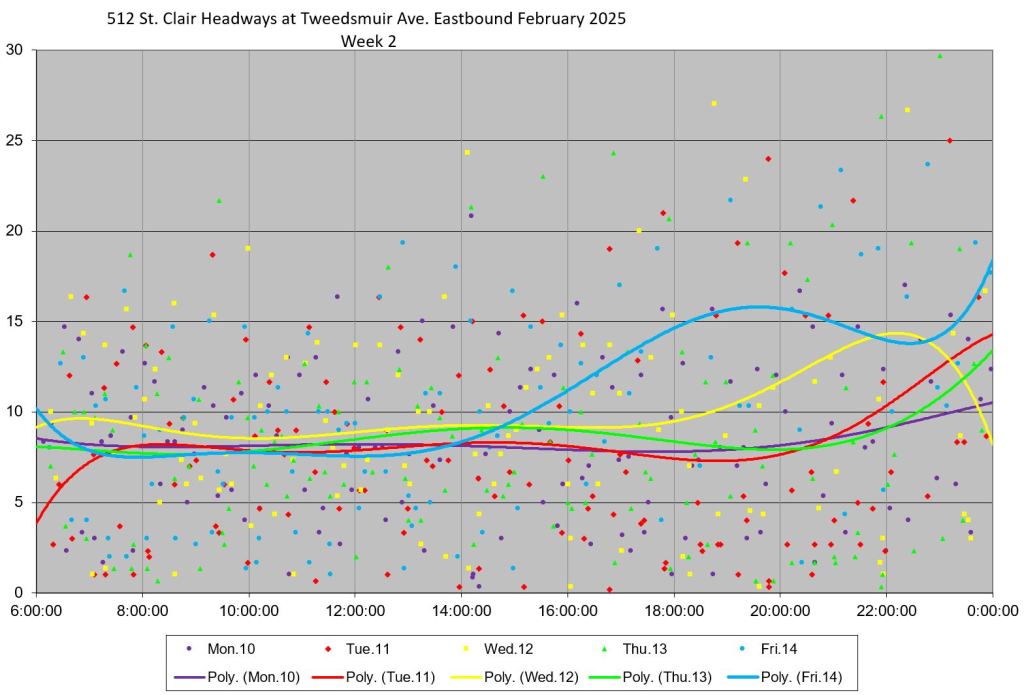
Headways Westbound at Yonge Street
These charts show headways crossing a screenline in the middle of Yonge Street. Departures from St. Clair Station will be slightly earlier, but the scatter in values cannot be explained by traffic interference in the short distance from the station exit to Yonge.
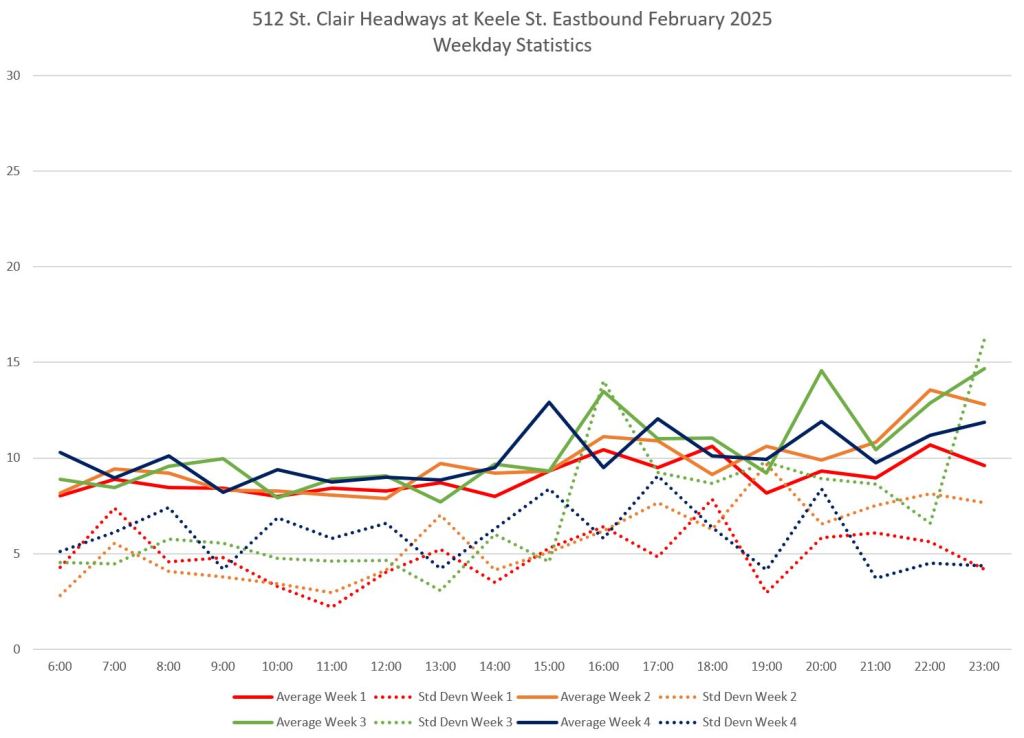
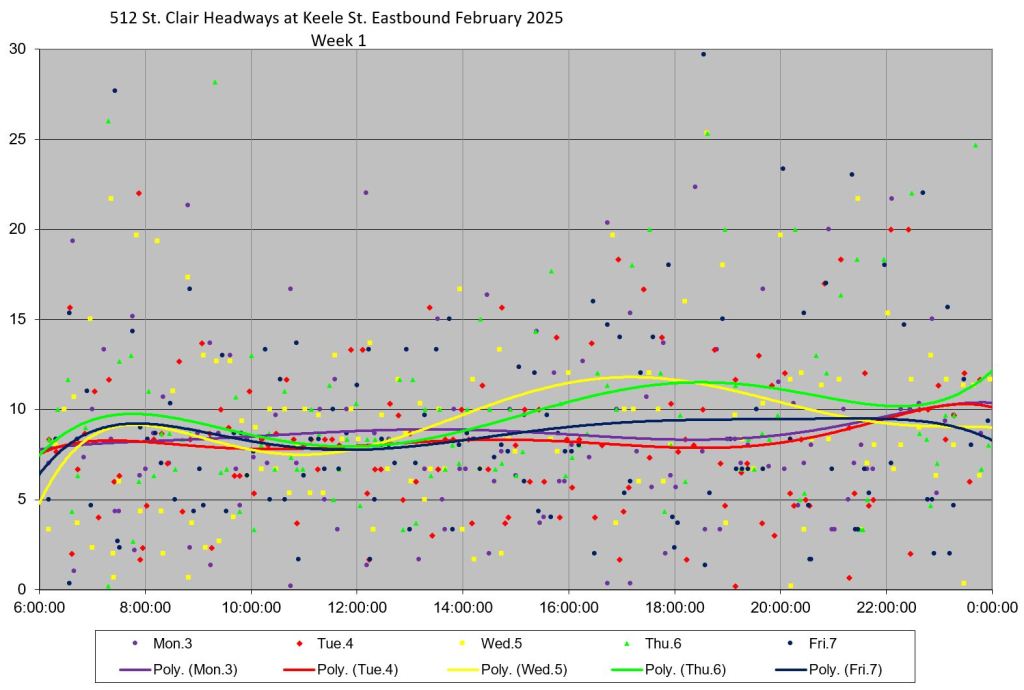
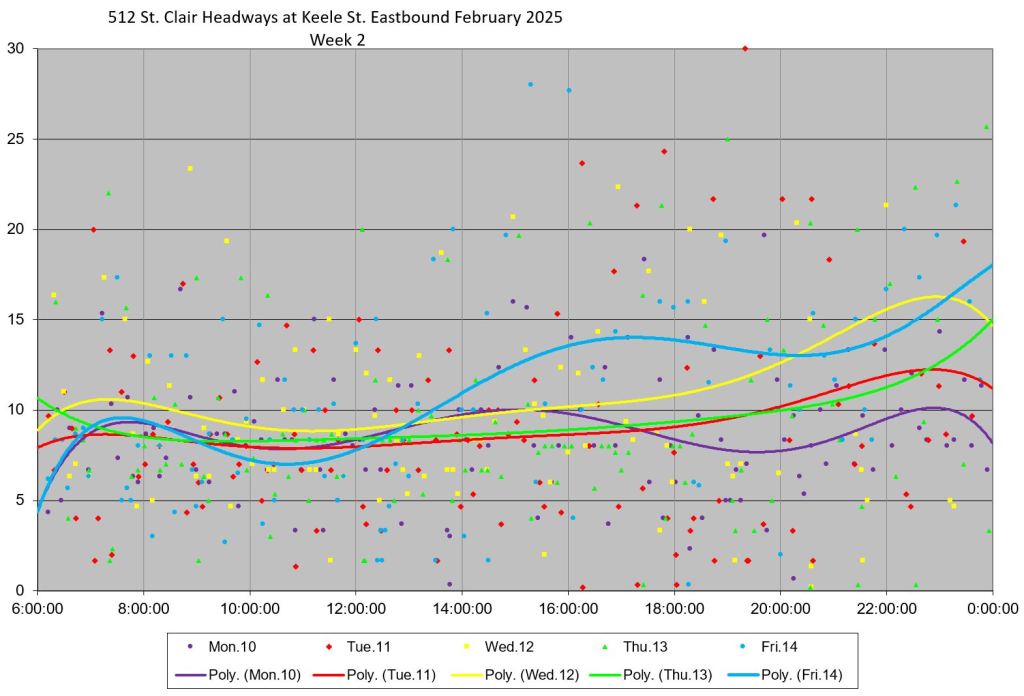
Weekday scheduled headways are every 8 minutes until late evening when this changes to 10 minutes. The averages for most weeks sit roughly at those levels indicating all of the scheduled trips operated, but not necessarily on an even spacing. The standard deviation of the headways is very high, particularly near a terminal, with values of 5 minutes or worse common. This indicates a large amount of bunching with corresponding gaps in service.
That distribution of short and long headways is clear in the week-by-week charts which show every trip as a distinct data point. Many points are near the x-axis showing cars close together, and many points are above the 15 minute line. There is clearly no attempt to regulate service to leave St. Clair Station on an even spacing. This situation continues through both months and is not weather-related.
January


February


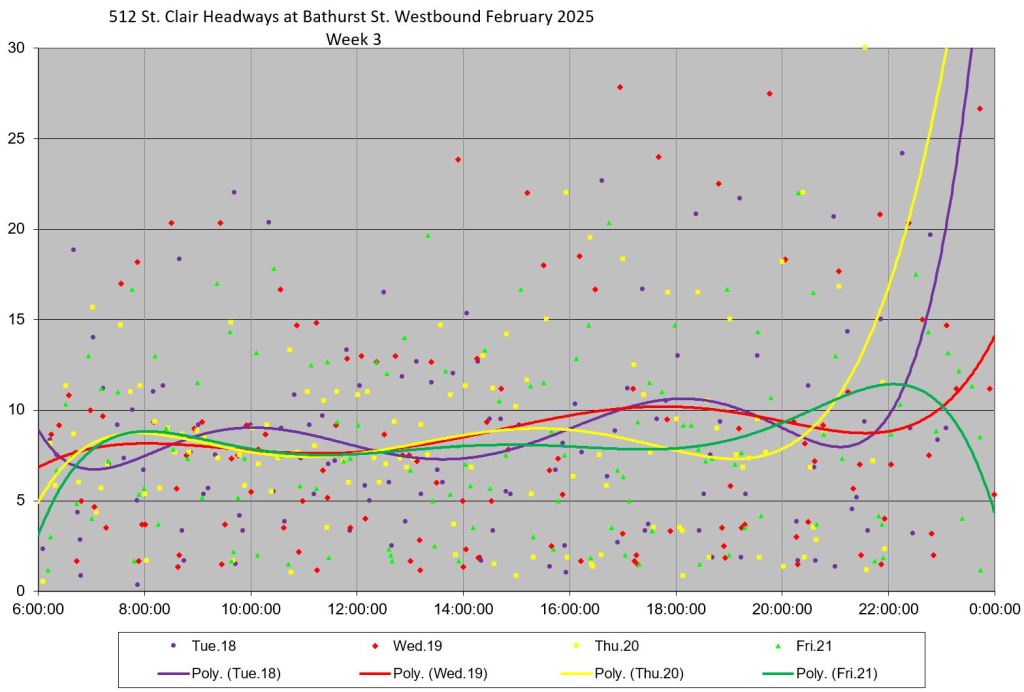
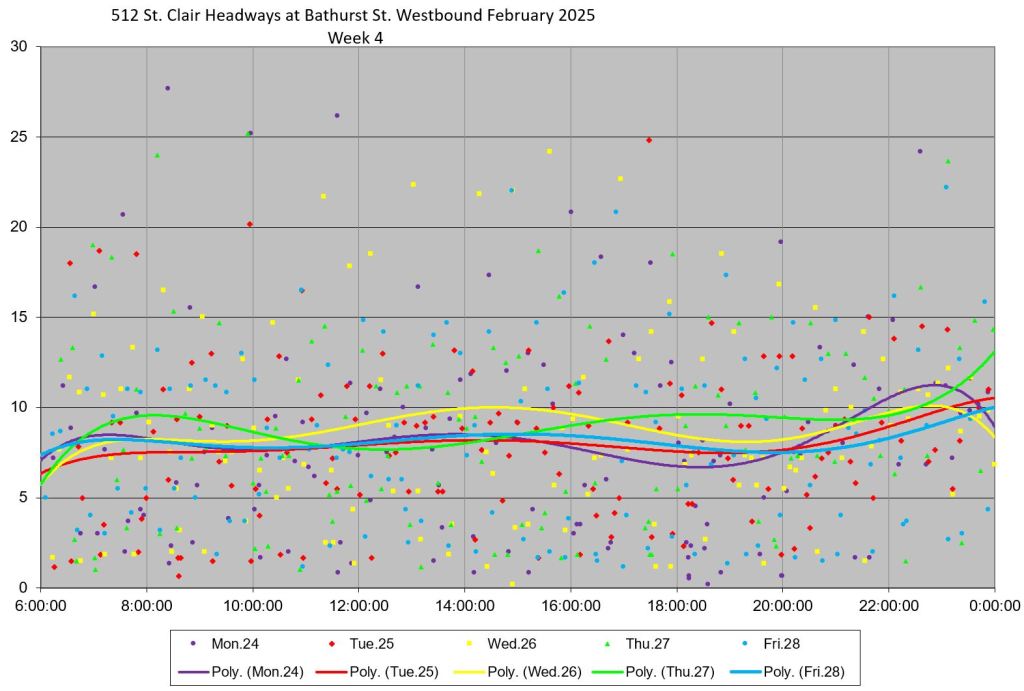
Headways Westbound at Bathurst
The screenline at Bathurst Street measures service leaving St. Clair West Station westbound. As at Yonge, the standard deviation values are high, particularly from the PM peak onward. The data points are scatted over a wide range in both months.
Although St. Clair West Station is not a terminus, it is a point where service could be regulated if the TTC chose to do so. The actual distribution of headways shows that this does not happen.
January


February


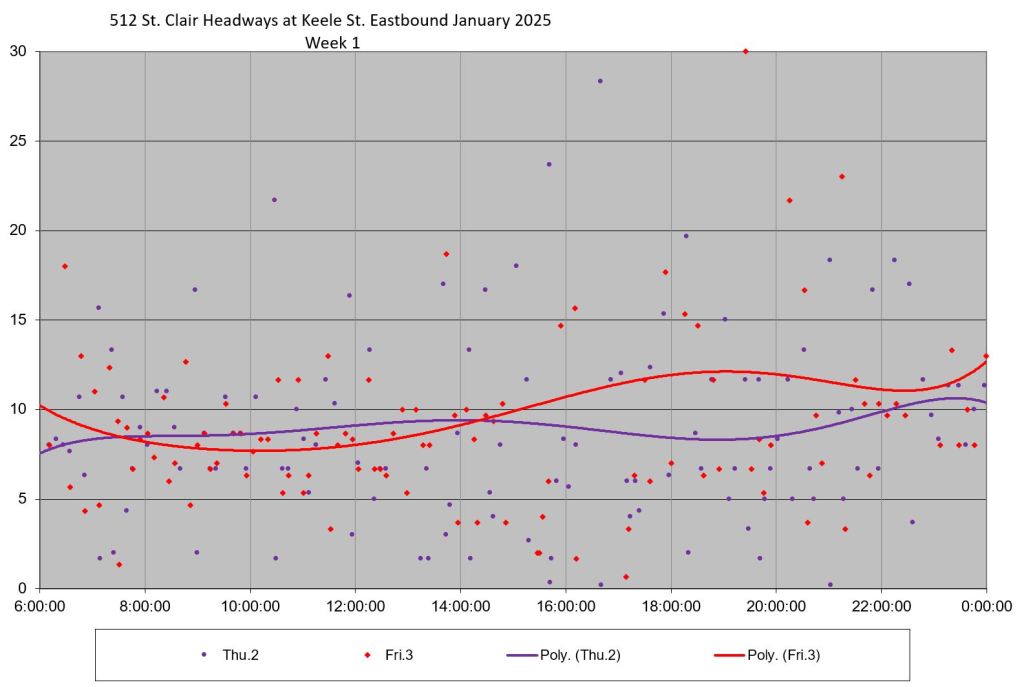
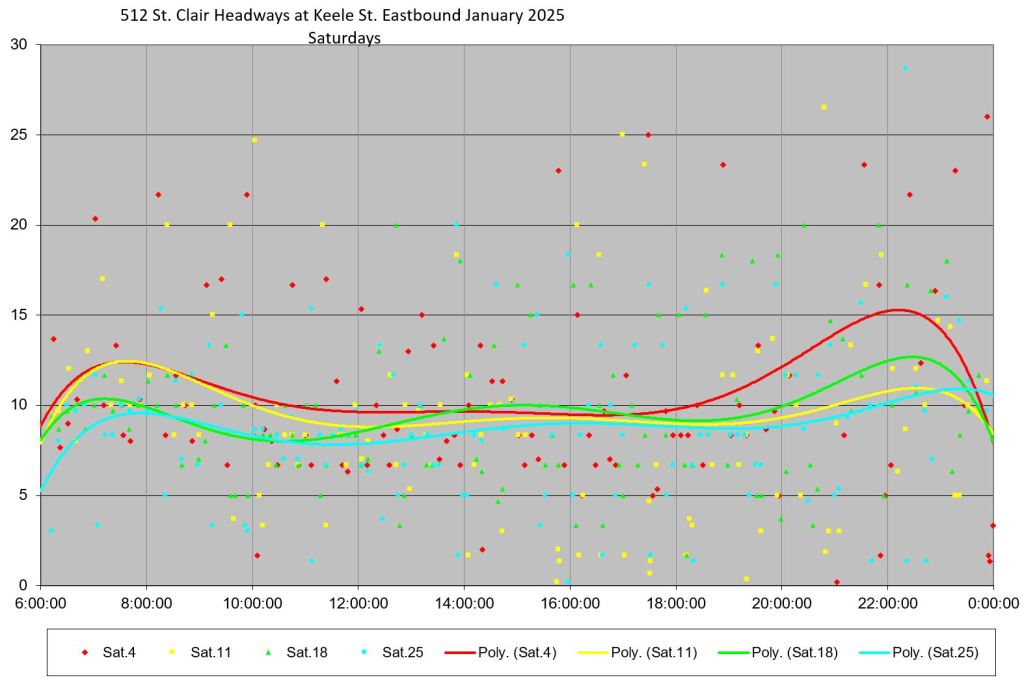
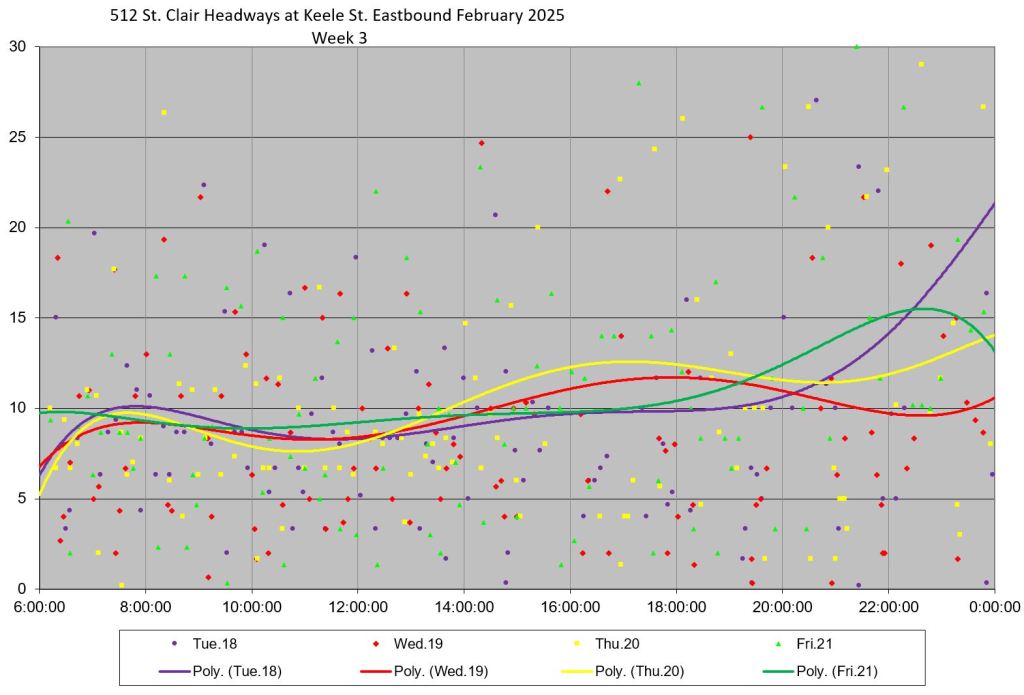
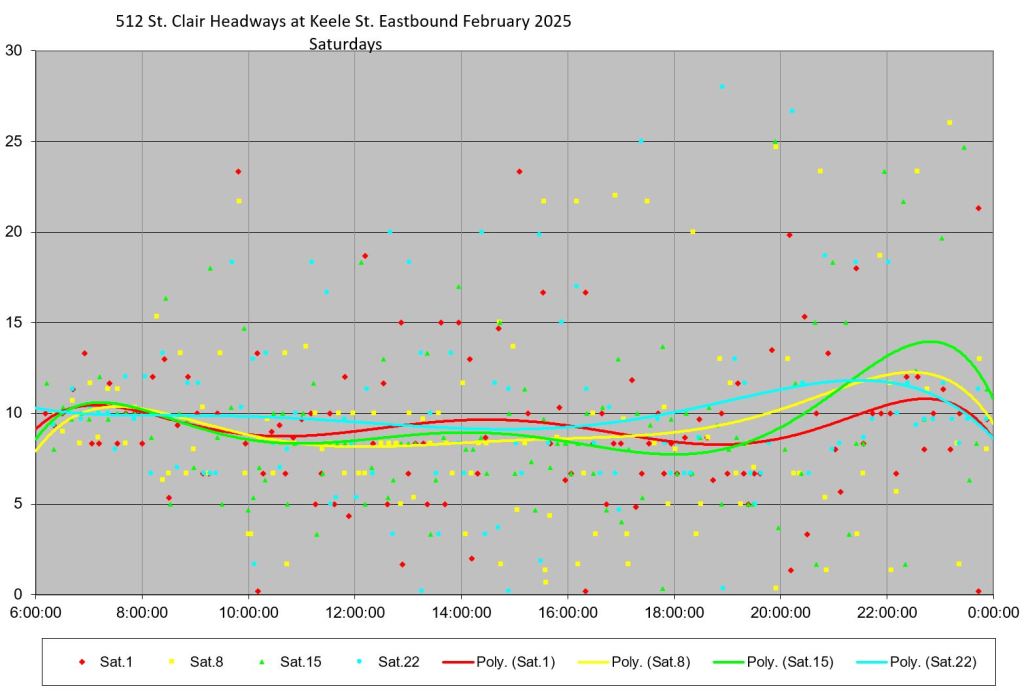
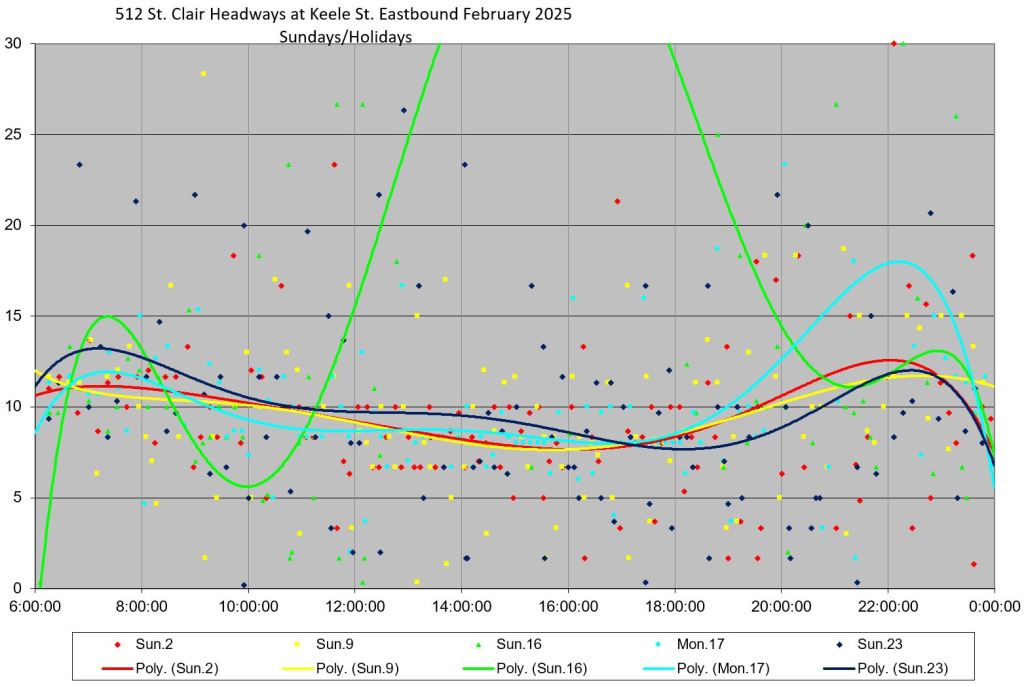
Headways Eastbound at Keele
Eastbound headways behave similarly to the westbound data, and if anything the spread in values is higher as shown by the standard deviation values. Again this is service leaving a terminus where headways could be controlled, but quite clearly they are not.
January
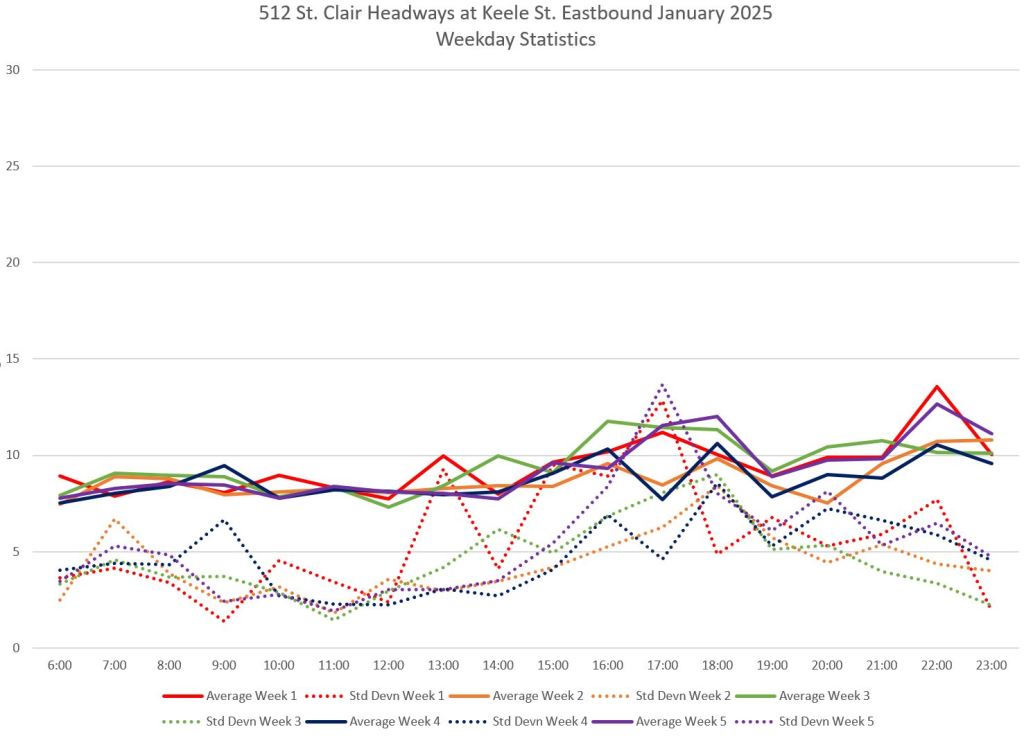

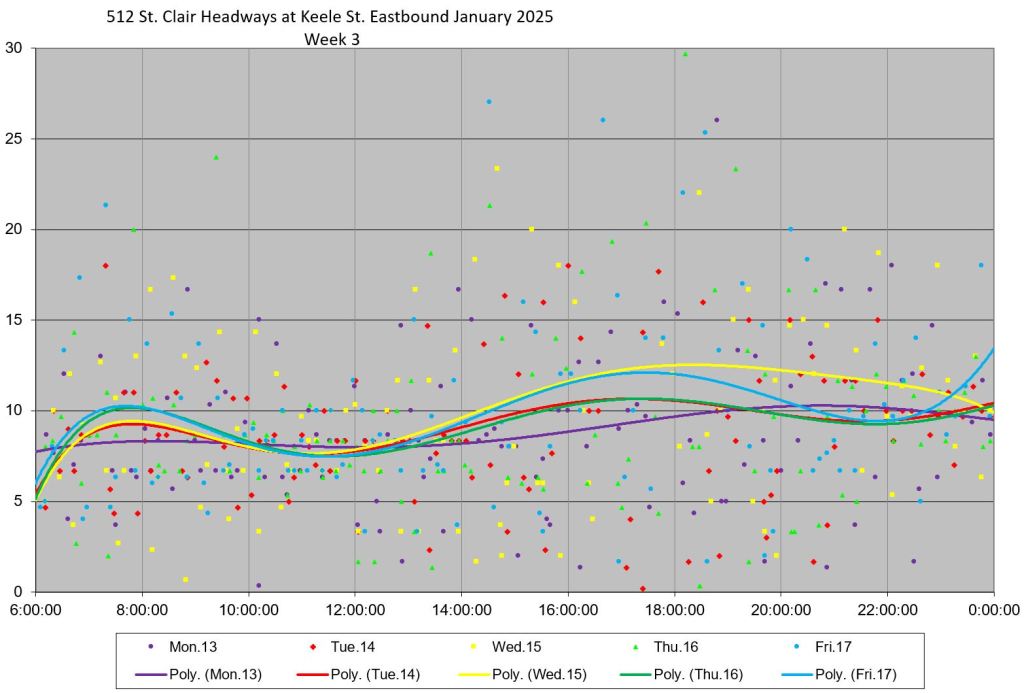
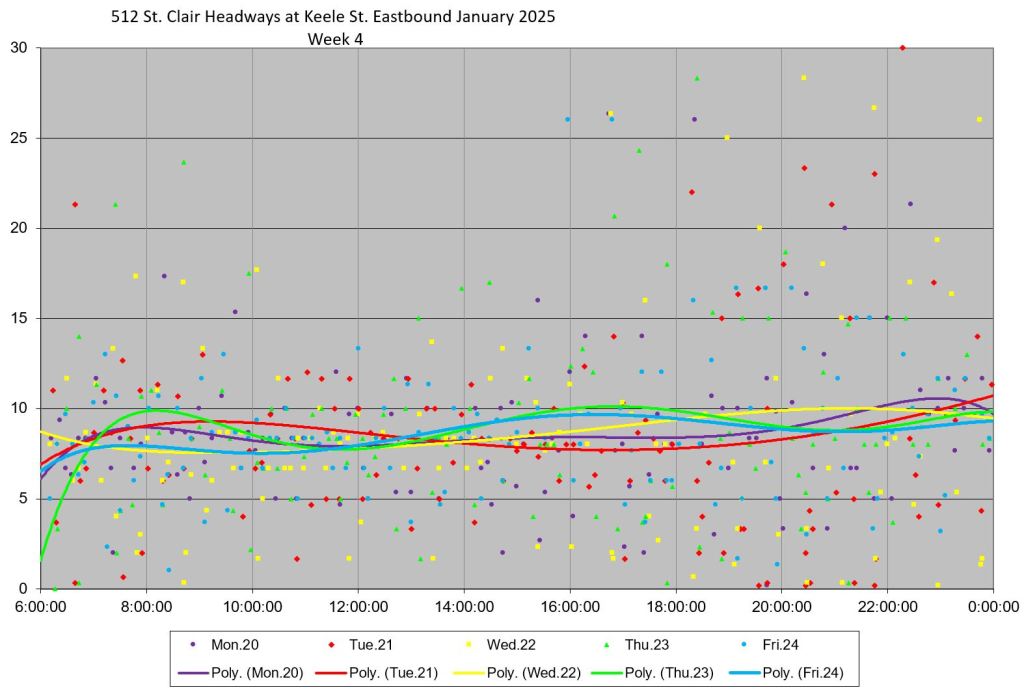
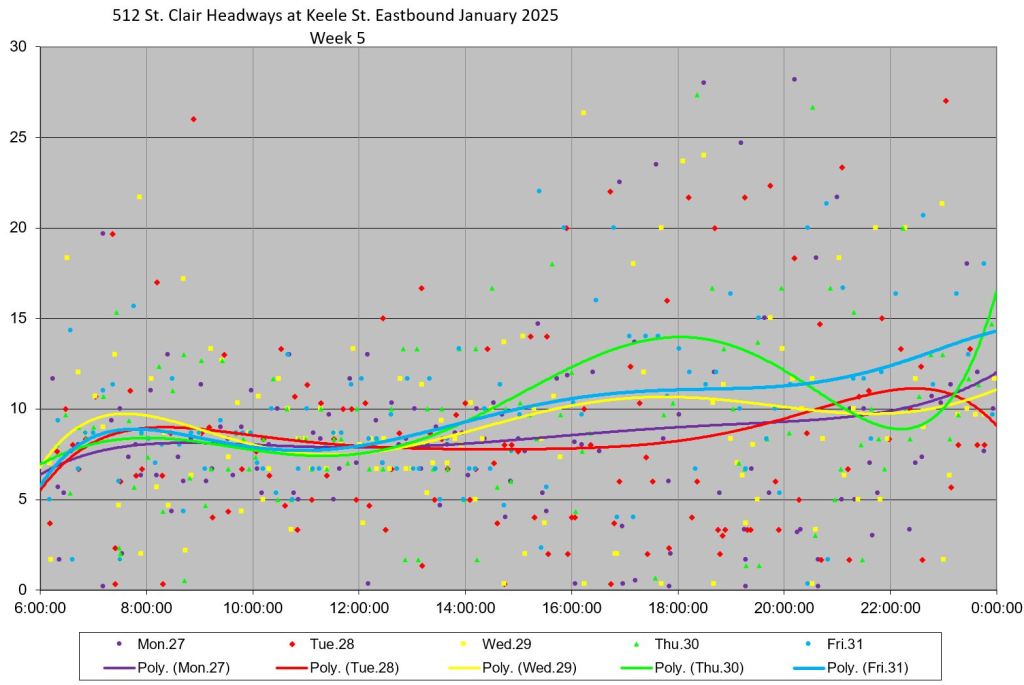
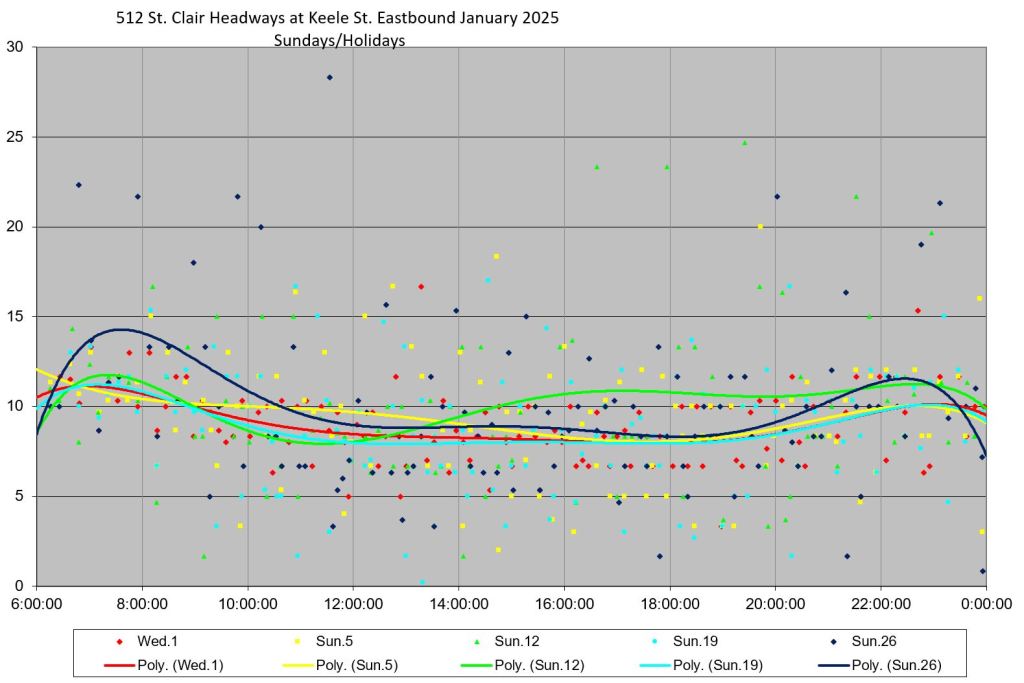
February
The very large hump in the line for Sunday, February 16 (green on the last chart below) corresponds to an extended delay noted in the logs earlier in this article.

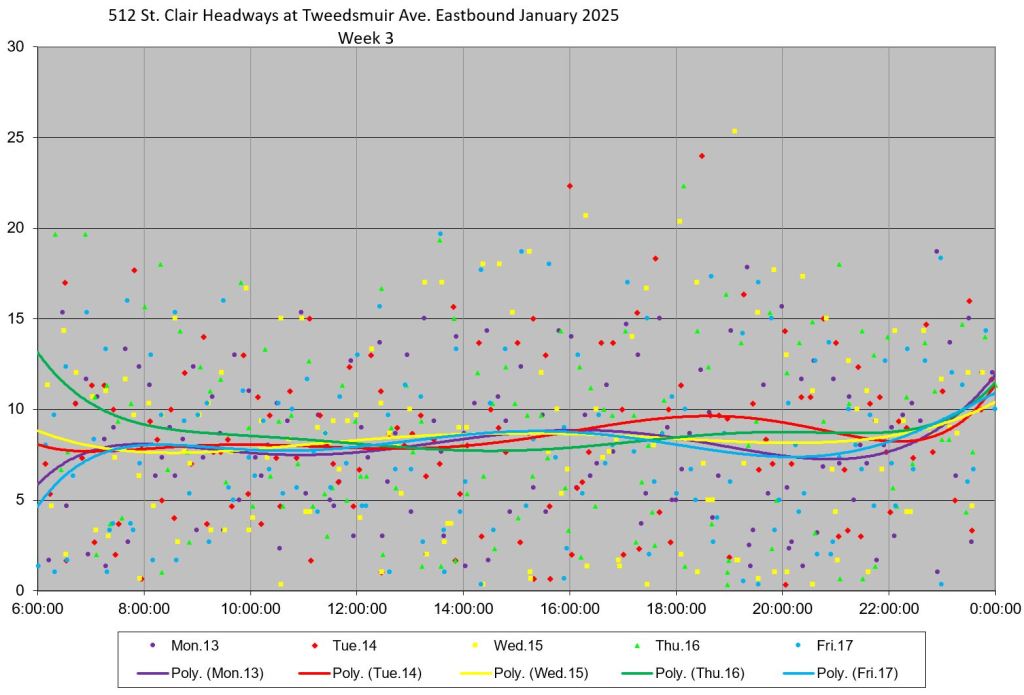
Headways Eastbound at Tweedsmuir
Service eastbound leaving St. Clair West Station is measured at Tweedmuir, just east of the east portal. It shows the same pattern of average headways close to scheduled levels, but standard deviations of five minutes or worse indicating very erratic service. The individual dots on the charts show the dispersion in headway values over the two-month period.
January


February


Service Tracking Charts
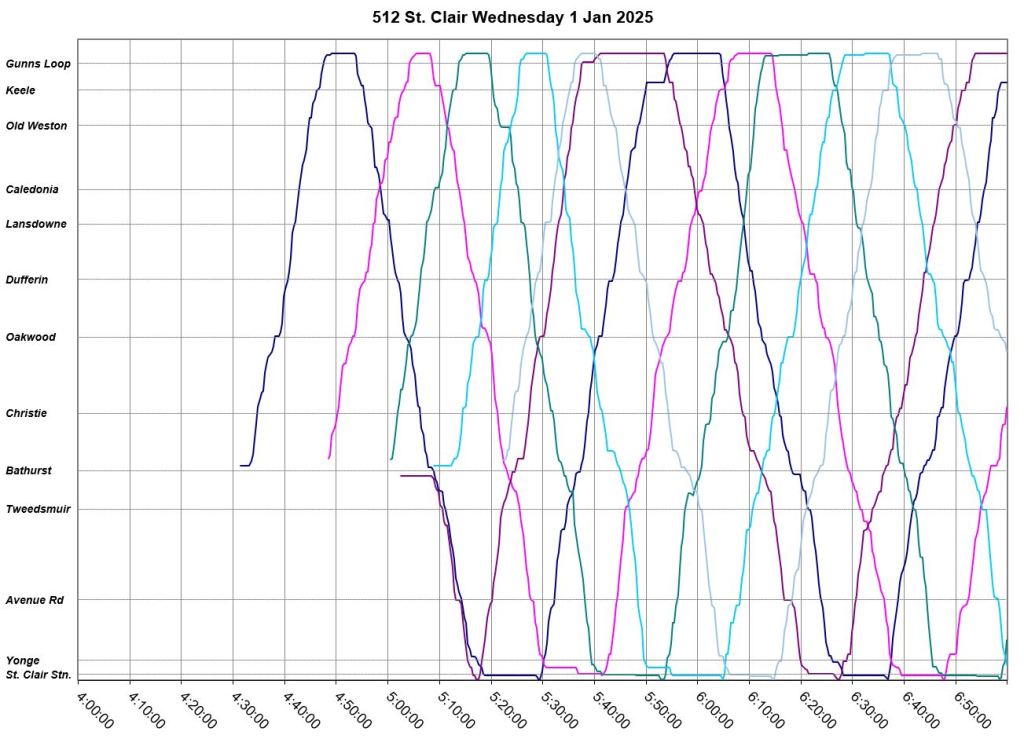
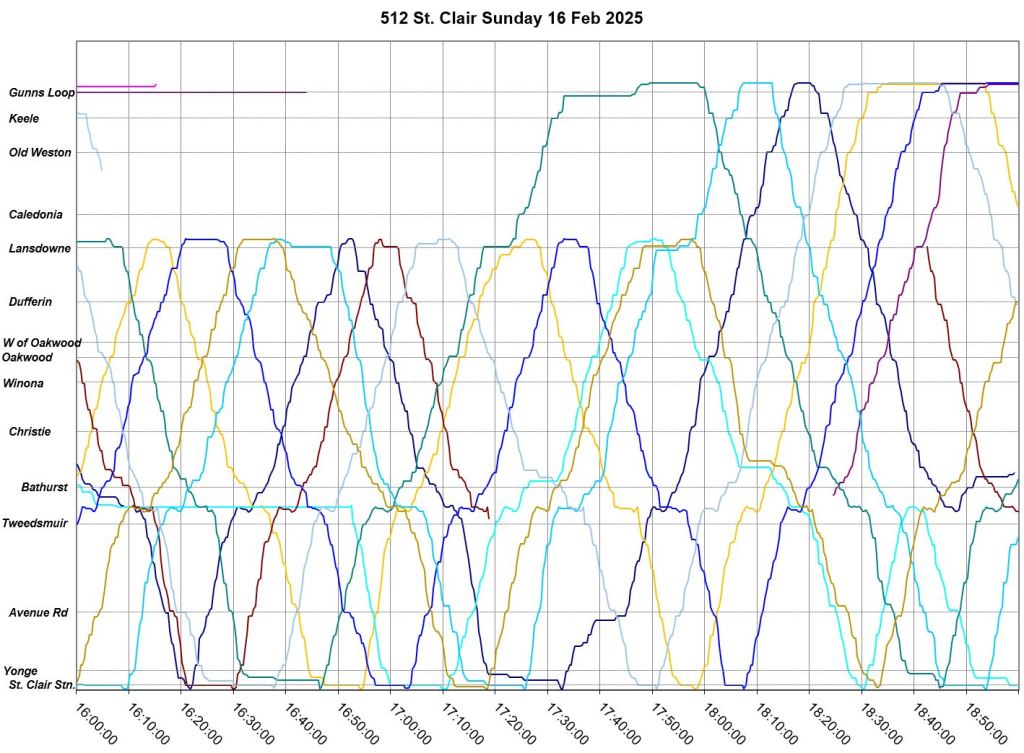
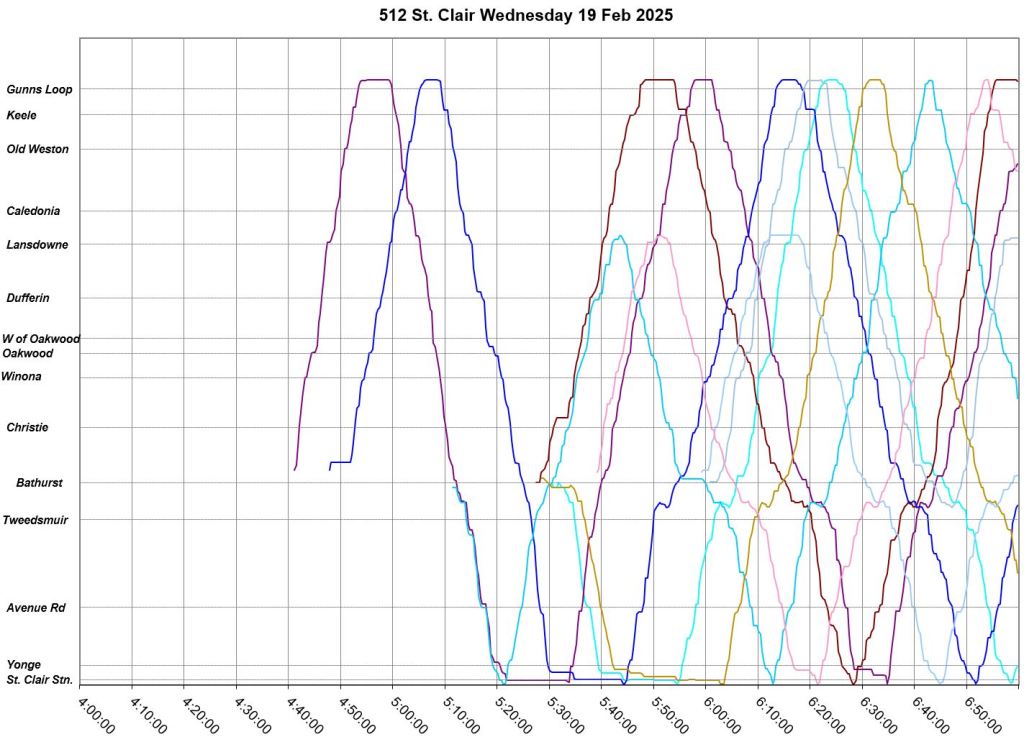
The charts in this section show the movement of streetcars back and forth on the 512 St. Clair route for a few day selected as examples. General notes:
- Time moves horizontally to the right. The west end of the route is at the top (Gunn’s Loop) and the east end is at the bottom (St. Clair Station). The vertical axis is scaled to actual distances on the route.
- The space between the lines show the time between cars. Where lines are close together, cars are running in packs of two or more. Where the lines are further apart, there is a gap.
- The slope of the lines is proportional to the speed. Congestion, where it occurs, appears as a group of lines becoming more horizontal showing cars running at a lower speed. A horizontal line show a car is stopped, usually at a terminus.
- There are “wiggles” in the chart where cars pass through St. Clair West Station. This is due both to the time spent at platforms, and for westbound cars, the fact that they travel back east a short distance while looping.
- As a general issue, the length of time for terminal layovers varies quite a lot from one day to another. This reflects the adequacy of scheduled times, or not, for actual conditions. 512 St. Clair is unusual in both its short end-to-end distance (7.1km) and the availability of a layover point including a washroom mid route.
- Plotting is based on GPS tracking data supplied by the TTC rounded to 10m increments in space and 20s increments in time.
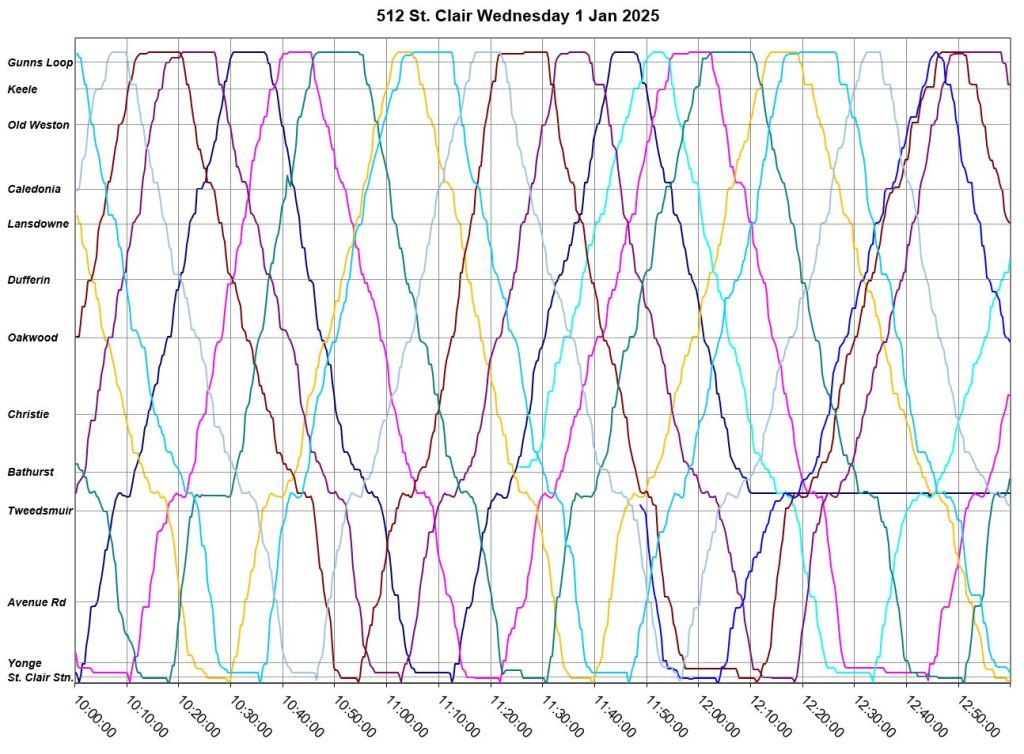
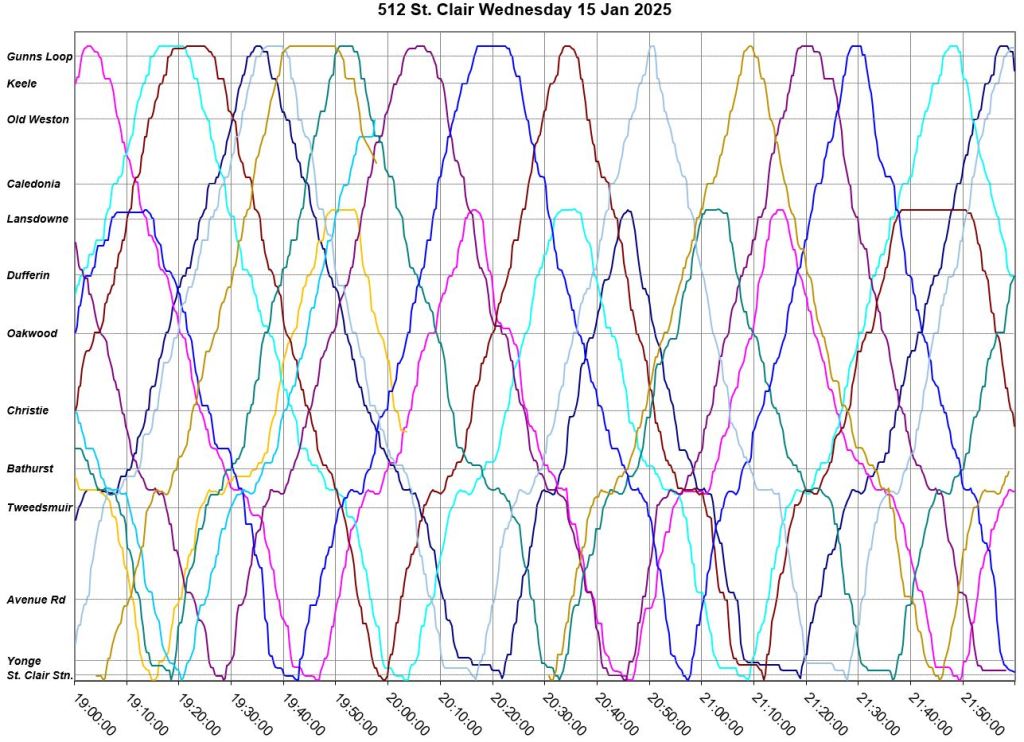
Wednesday, January 1
There was no visible congestion on New Year’s Day in the charts. Some bunching occurred thanks to cars taking layovers at St. Clair West Station, and the following car caught up. These were resolved on the return trip from Gunn’s Loop when proper spacing was restored. No cars were short turned at Earlscourt or Oakwood Loops.


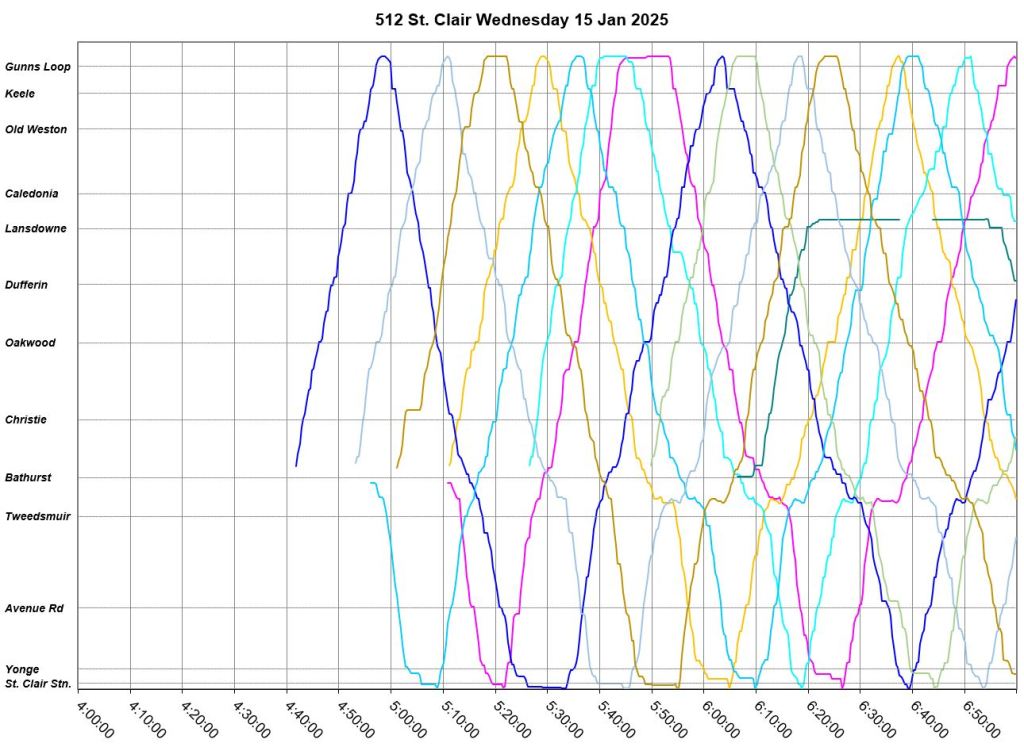
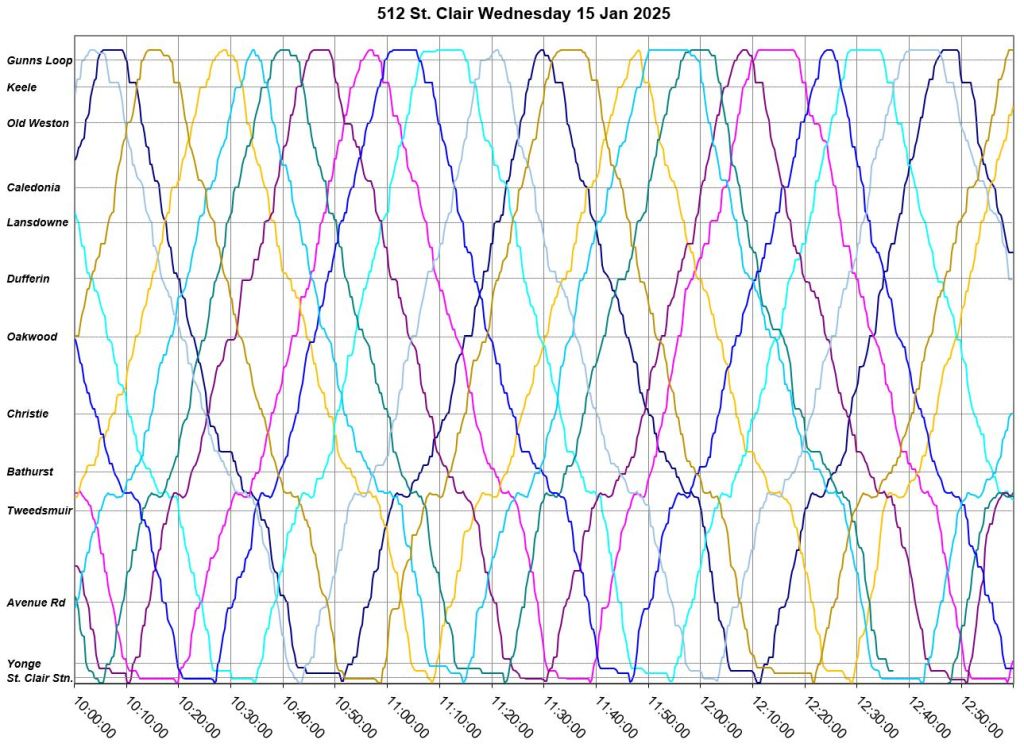
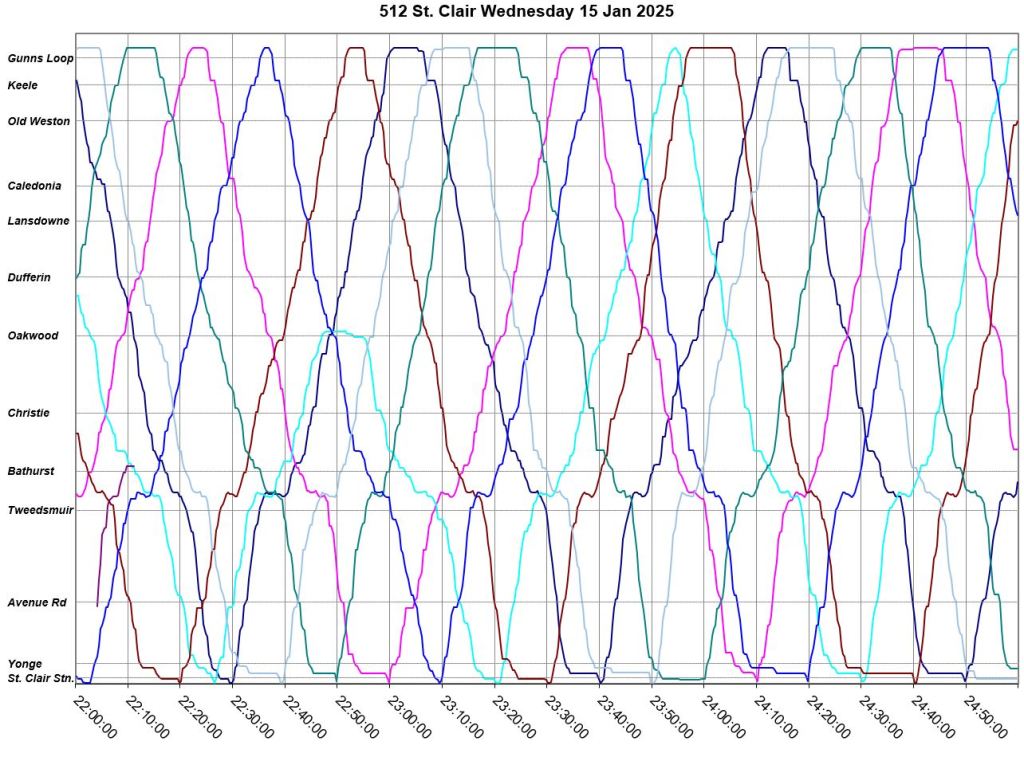
Wednesday, January 15
January 15 shows a typical mid-January service pattern.
- Several cars were short turned at Lansdowne notably in the PM peak and early evening.
- Several cases of bunching inbound from terminals are evident beginning in the AM peak and continuing through the day. In some cases, the bunch was not broken apart on the return trip.
- No eAlerts were issued for service interruptions.


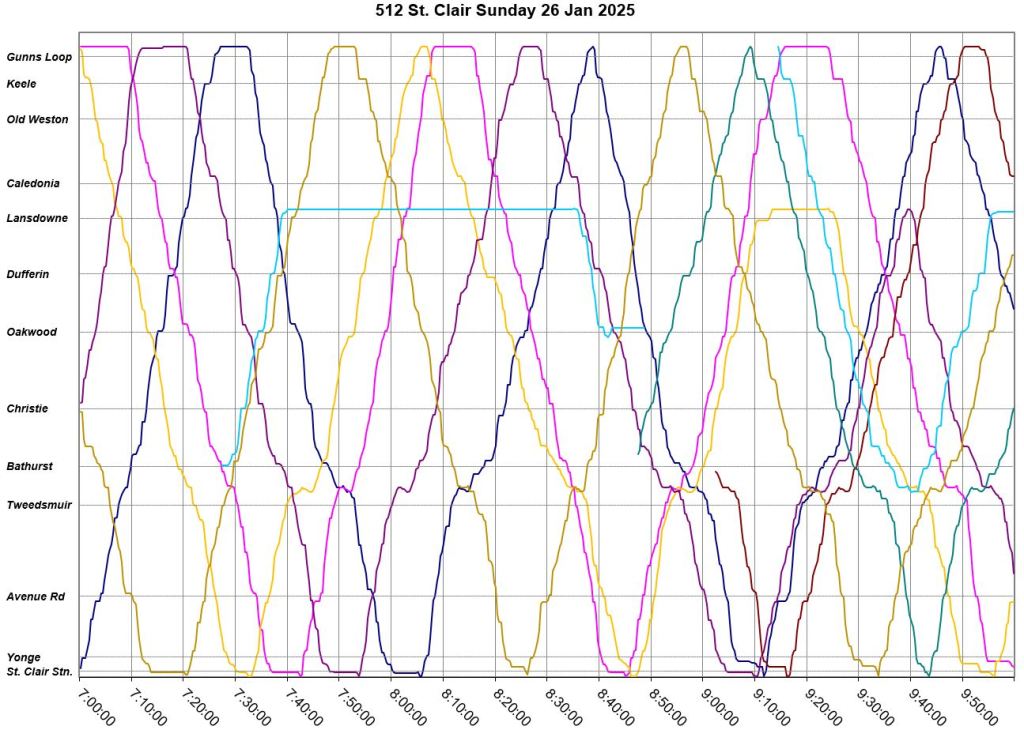
Sunday, January 26
Weekend service on St. Clair is little better than weekdays with the same sort of bunching and gaps.
- There is no indication of congestion.
- No eAlerts were issued for service problems.
- Bunching begins in the morning and continues into the mid-evening.
- There are a few examples of cars taking extended layovers eastbound at Earlscourt Loop, one starting at 3pm and another just before 6pm.


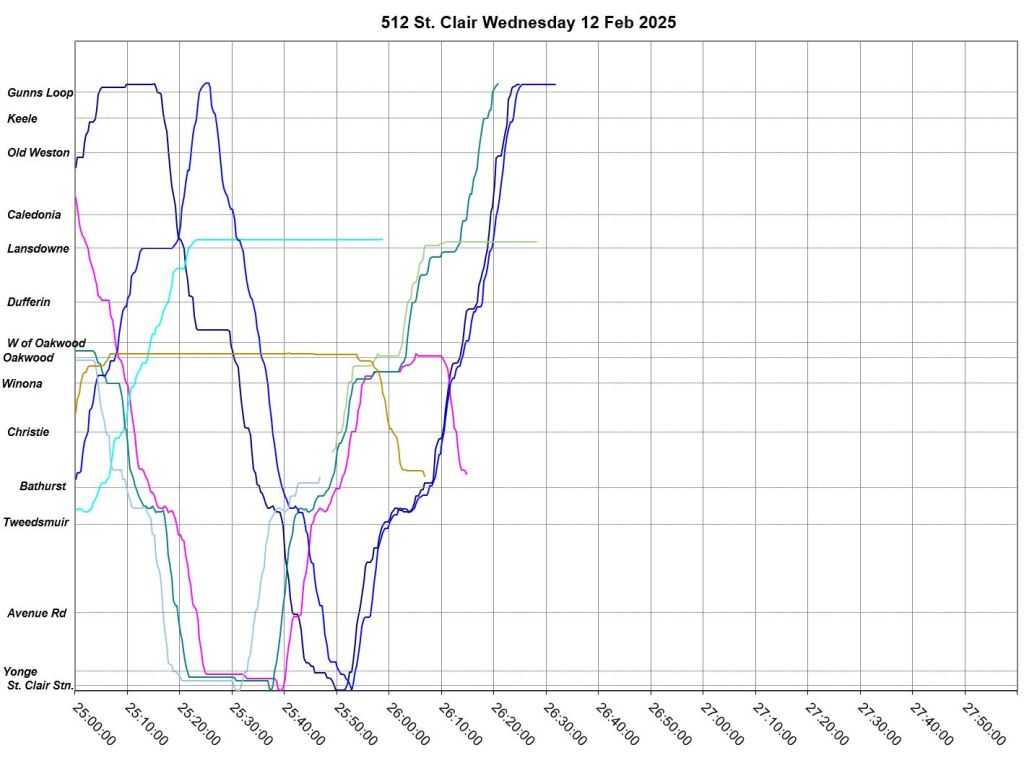
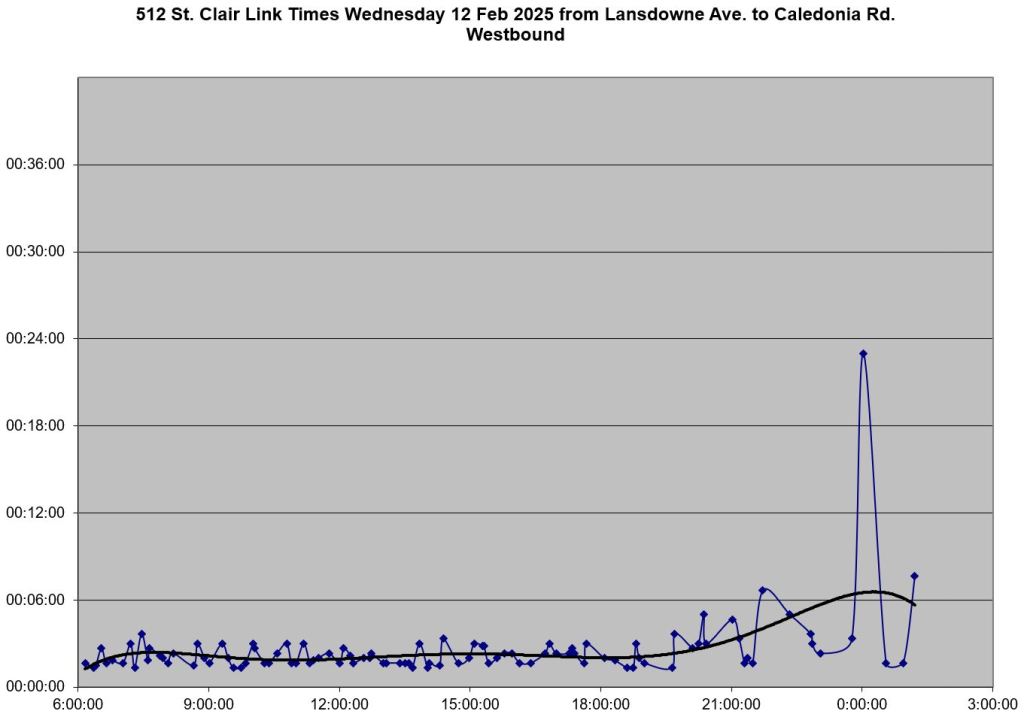
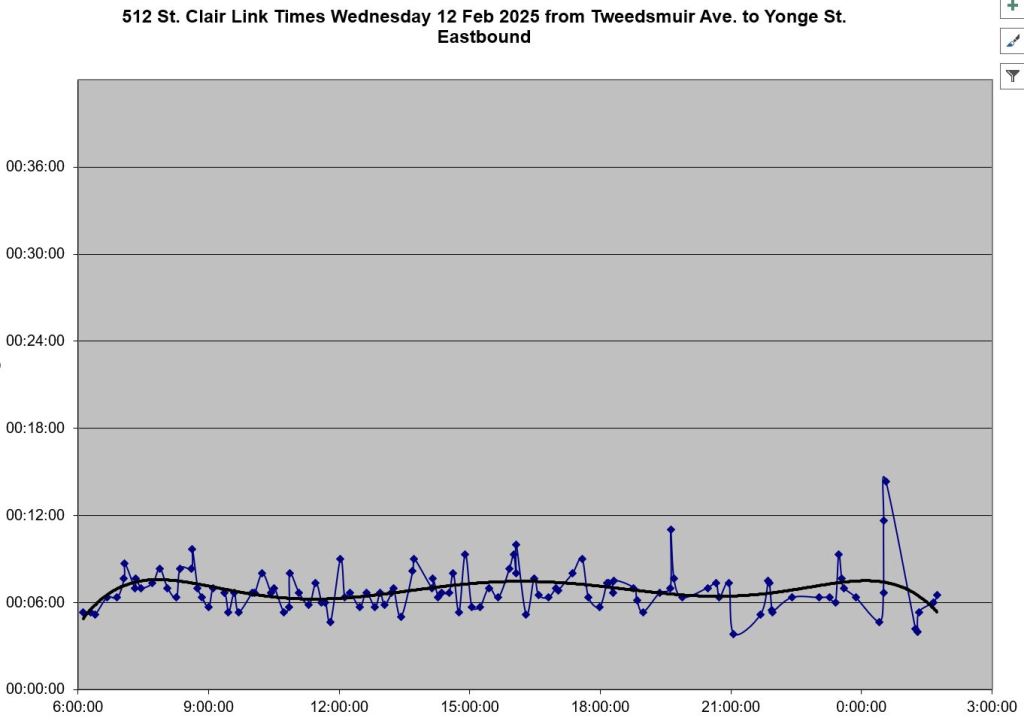
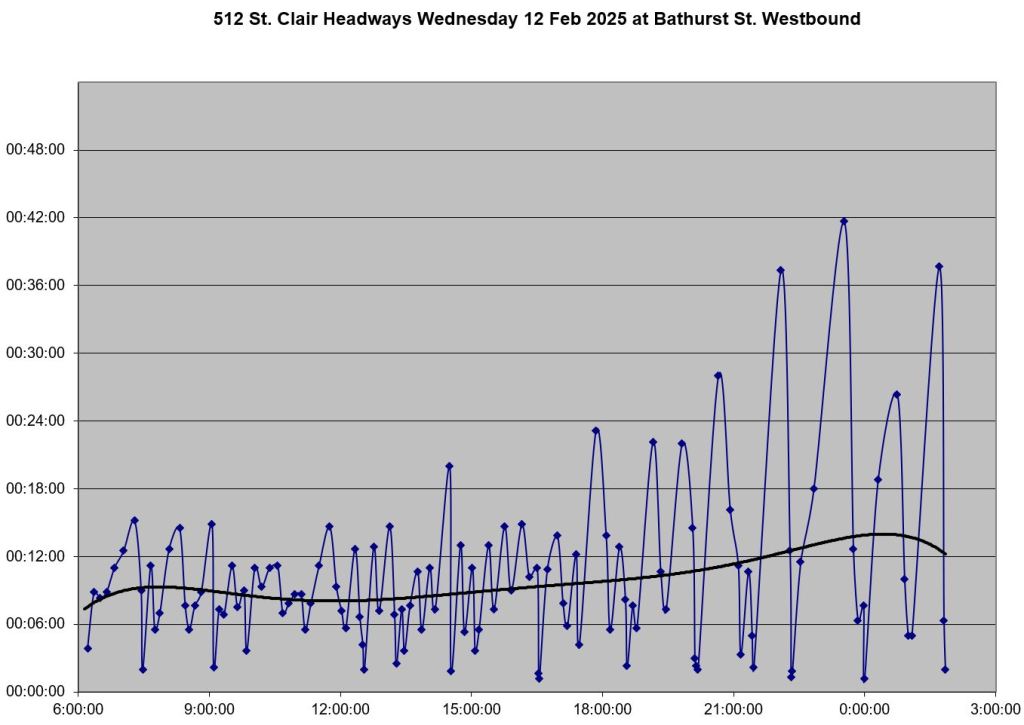
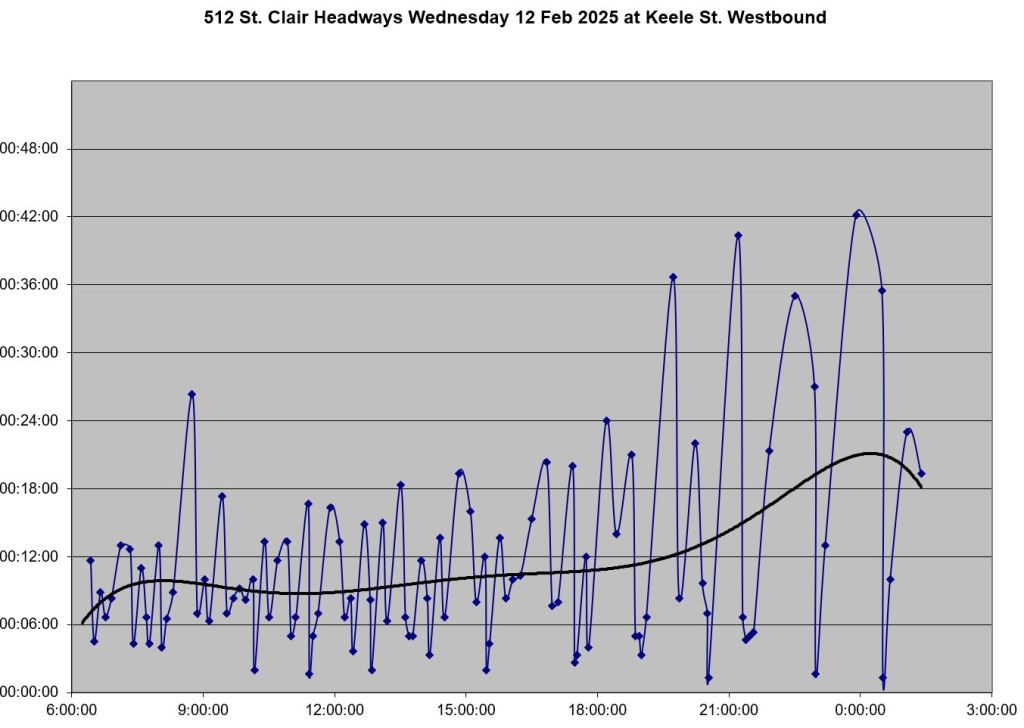
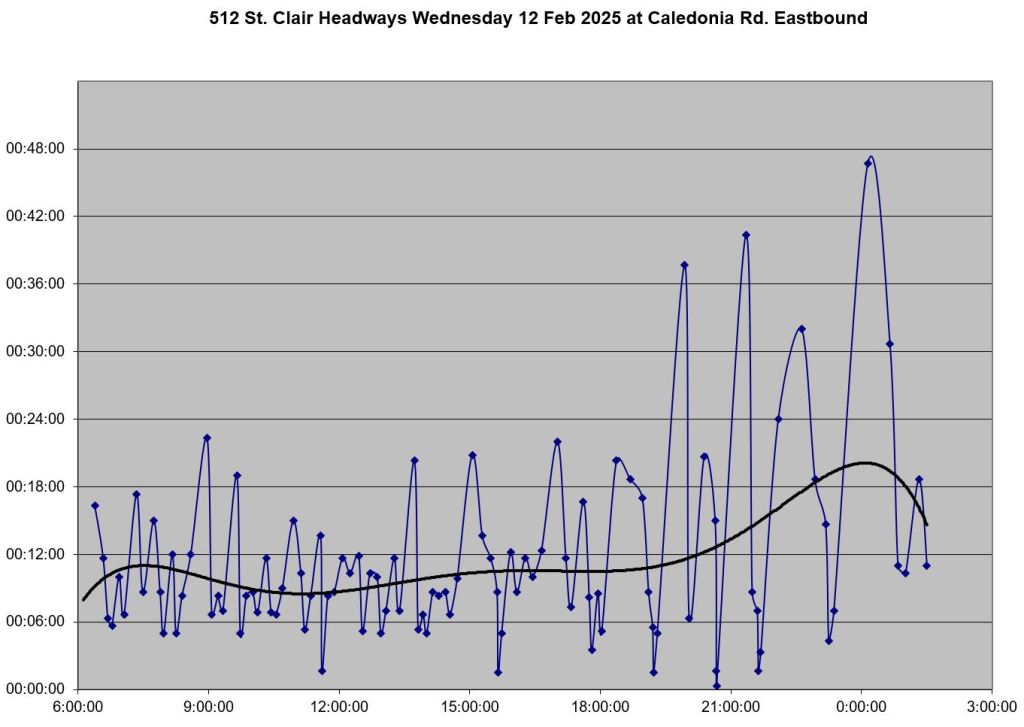
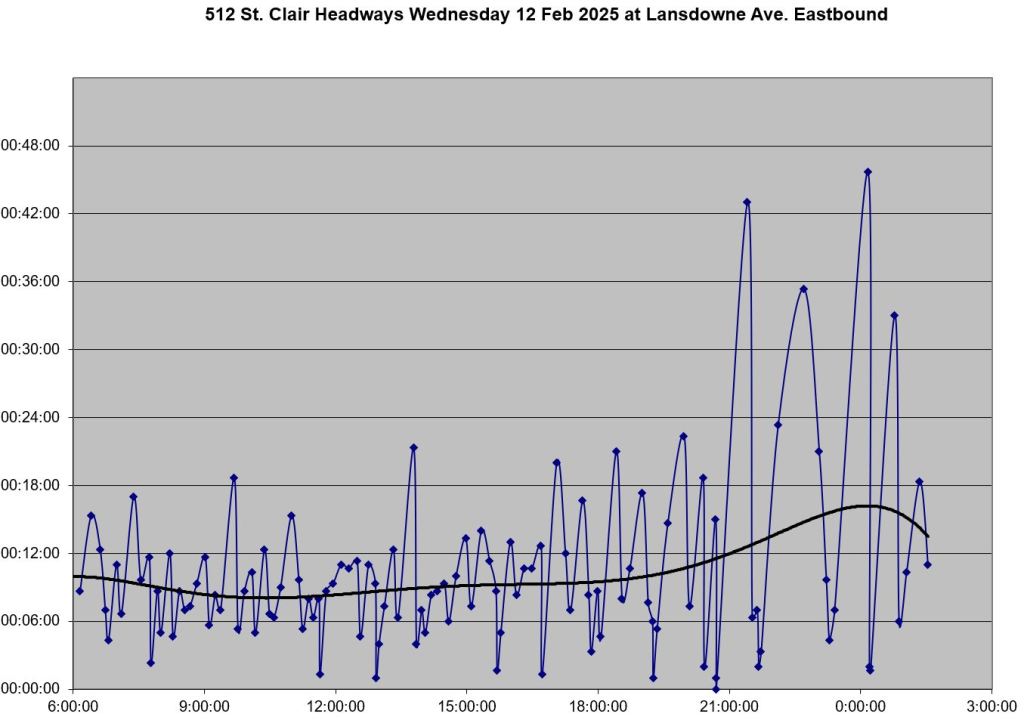
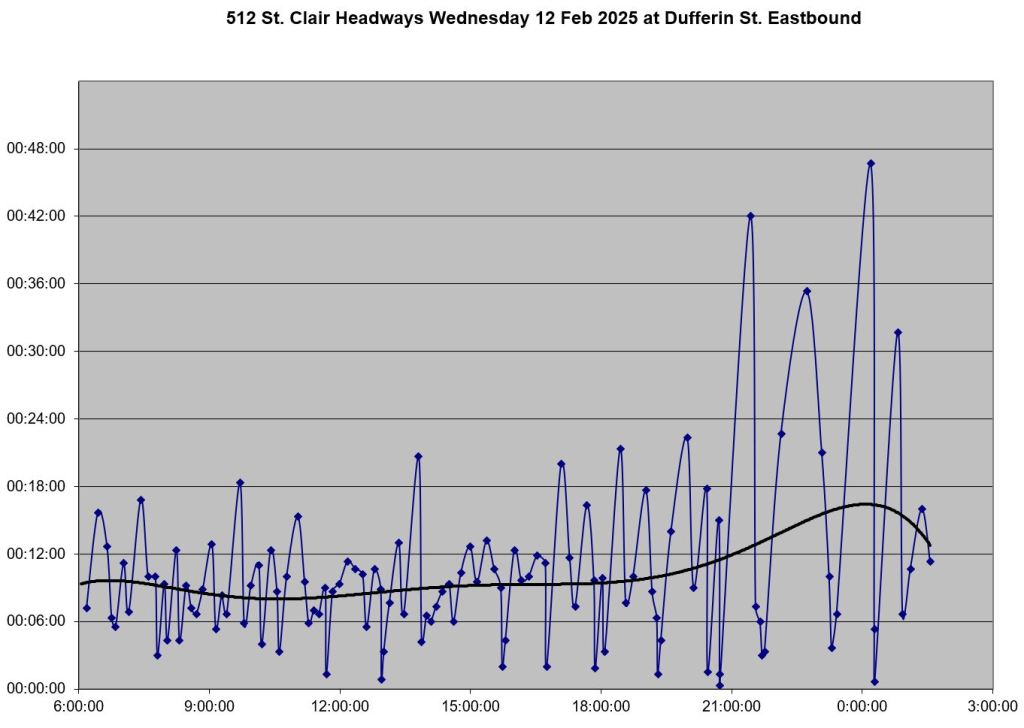
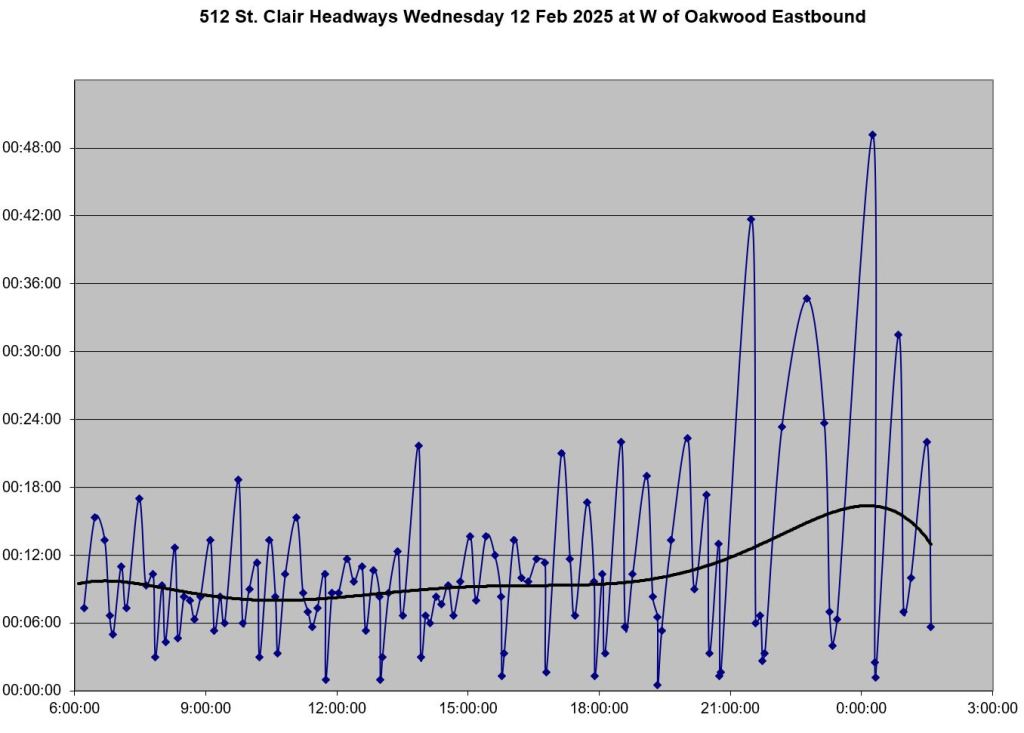
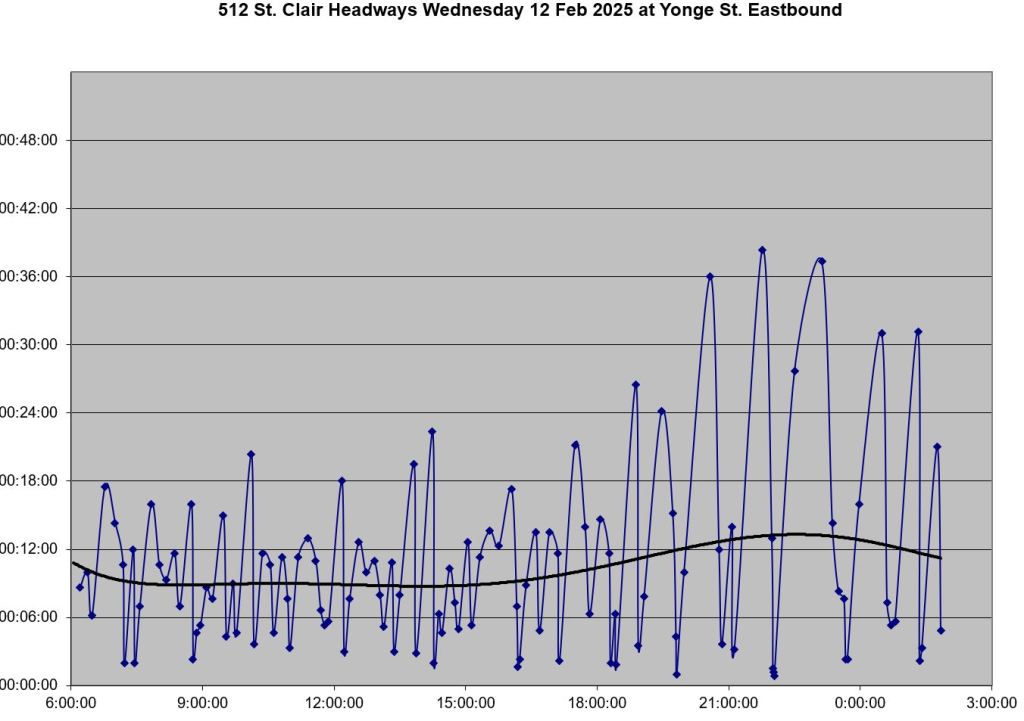
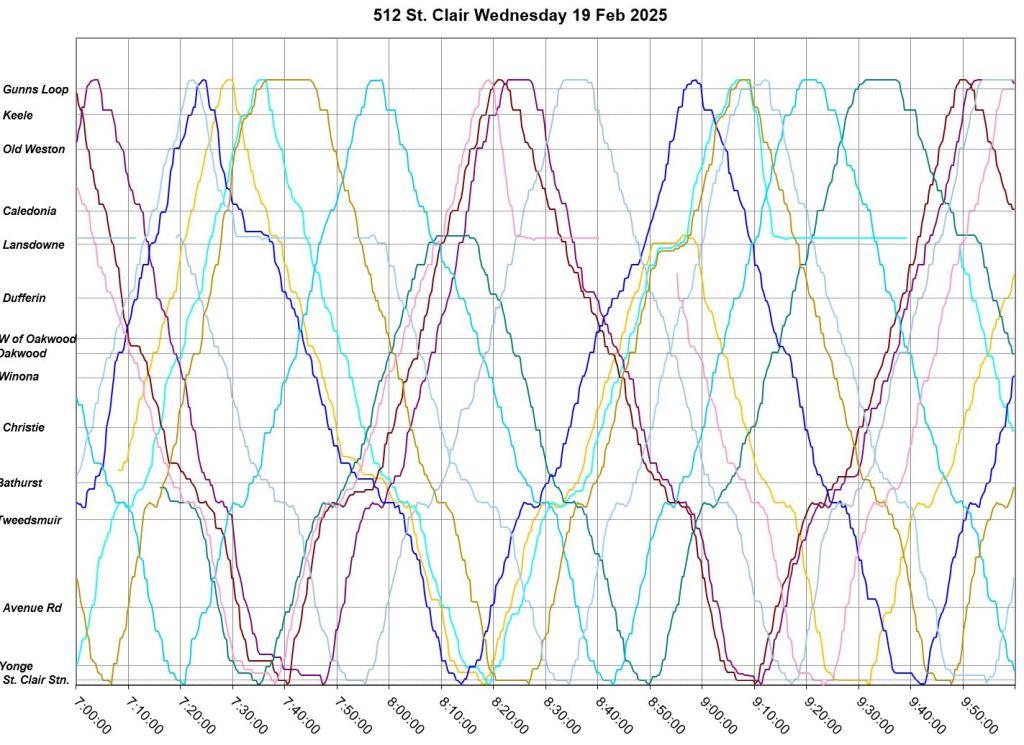
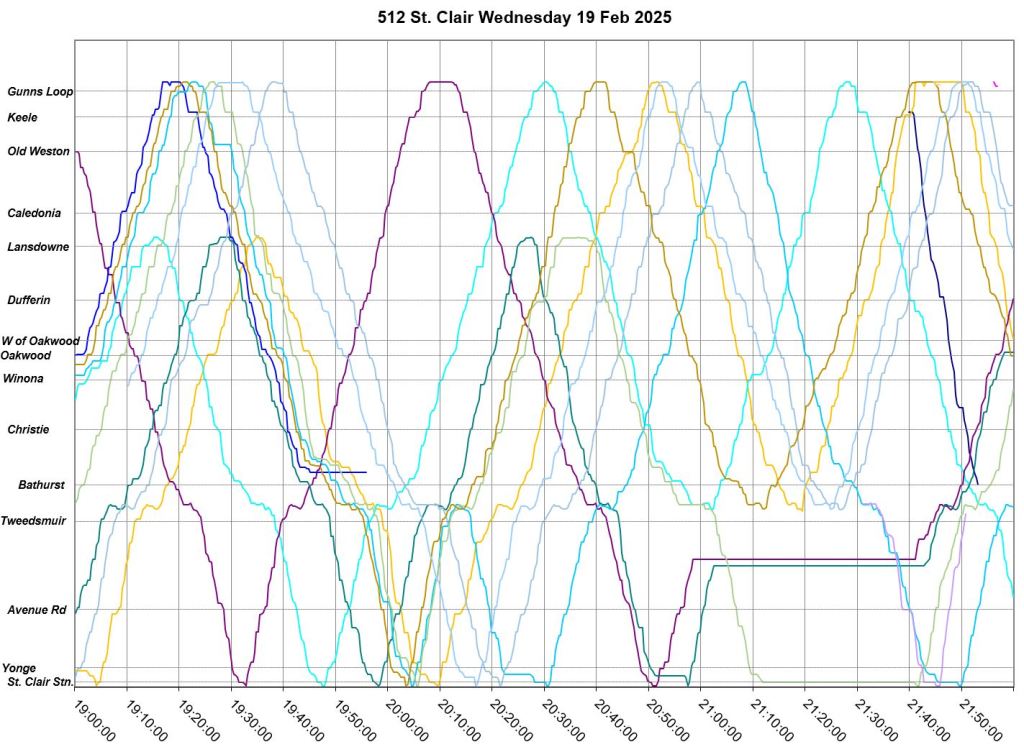
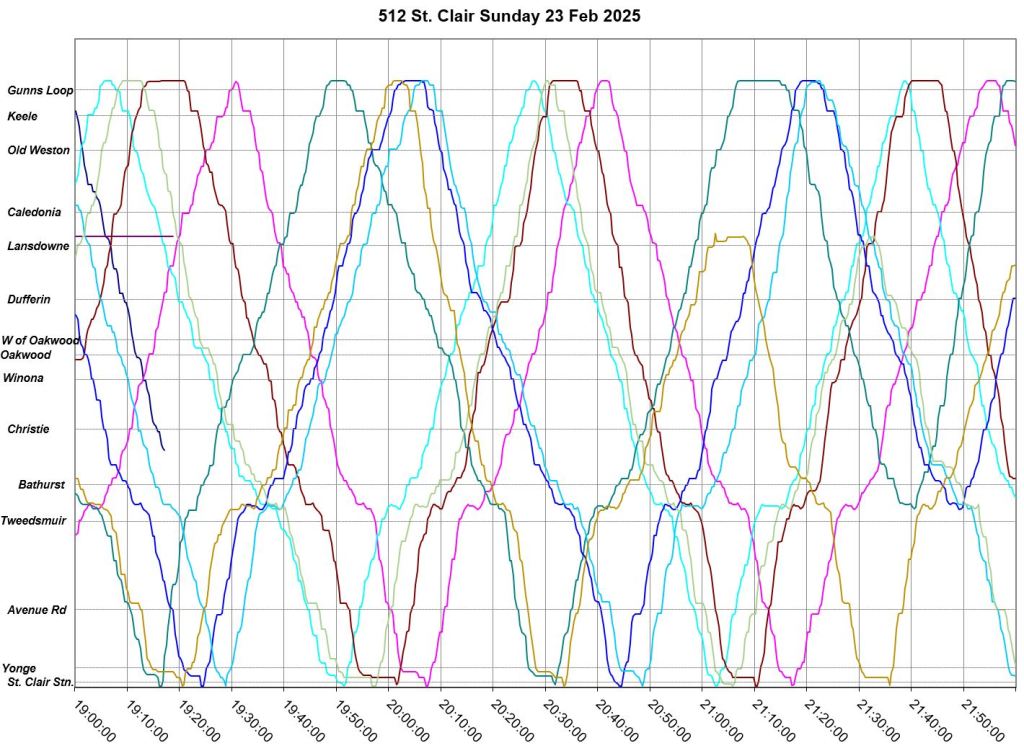
Wednesday, February 12
February 12 was the first heavy snow day. The snowfall began after 5pm and the rate grew from 0.4mm between 5-6pm to 2.9mm by 11pm-12mn which was the peak hour. Snow continued overnight and ended between 8-9am on February 13. [Source: Environment Canada]
From the mid-evening onward, service becomes erratic with wide gaps and a few short turns, but with little evidence of a persistent slowdown. Service from Keele is particularly bad because of the combined effect of gaps and short turns at Lansdowne. There appears to be little effort to space out the badly bunched service, and groups of cars run together for extended periods.
There is a very wide gap westbound from St. Clair Station at about 8pm preceded by cars running in a pack. If these had been spaced regularly from Yonge, the very large gap at Keele between 8:35 and 9:15pm would not have occurred. Other bunches of cars were similarly followed by preventable large gaps.


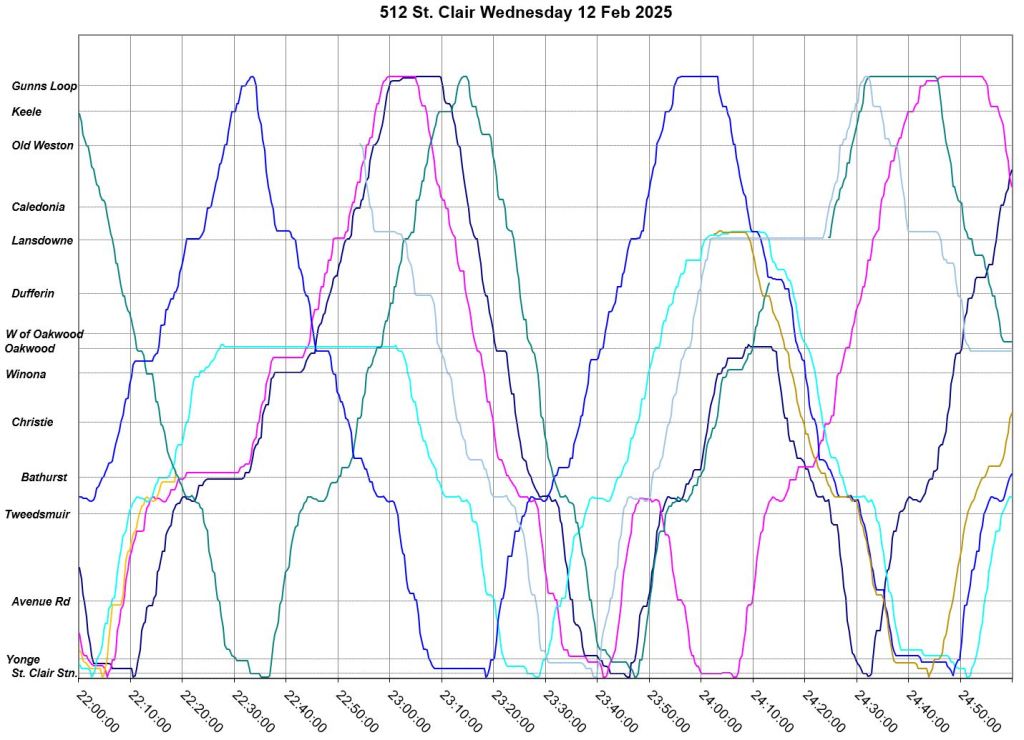
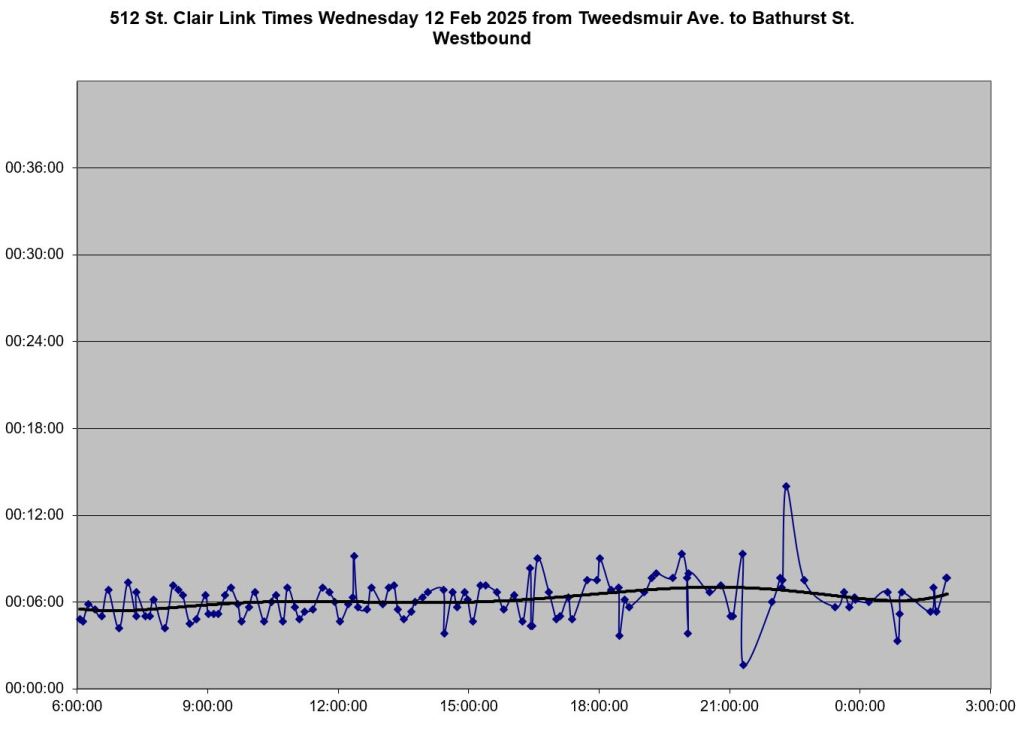
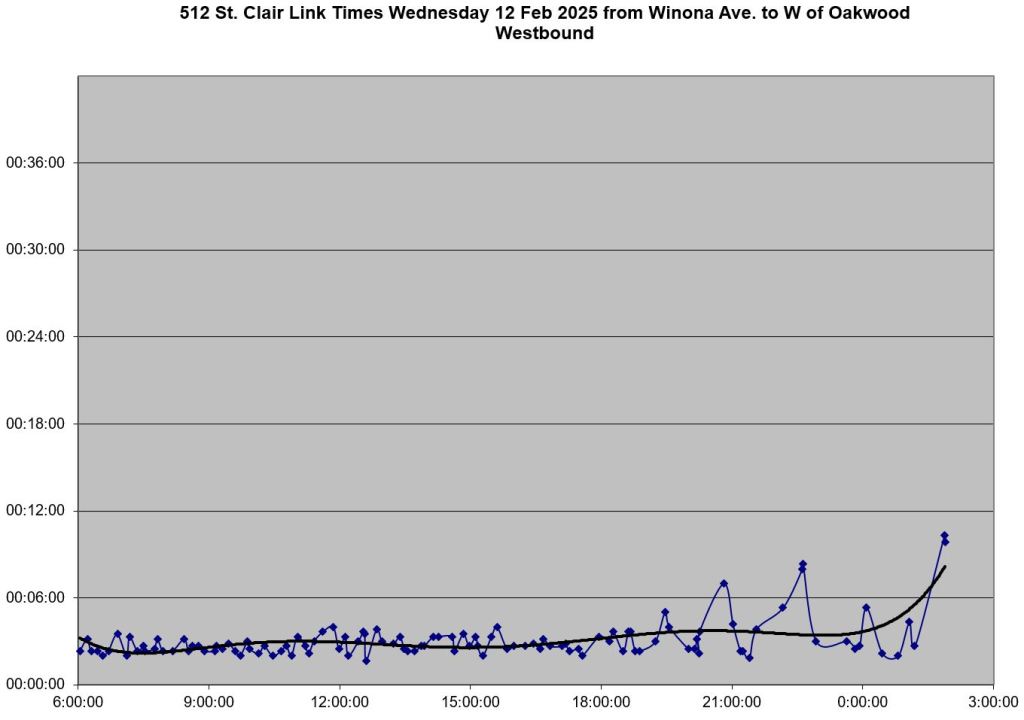
The following charts illustrate the headways and travel times in more detail showing the effect of bunching and gaps. Normally, I do not publish these charts because they are at a far greater level of detail than readers would put up with. However, in this case, they show the contrast between fairly reliable travel times, and totally unreliable headways. The quality of service cannot be explained away entirely by the weather, and certainly not by “blocked track” delays of which there is little evidence, and no service eAlerts were issued.
In these charts, the blue dots are the individual data points for travel times or headway, and the line joining them simply follows the ups and downs of the points. The black mostly horizontal line is an interpolated trend line showing the overall behaviour of the data. It is not a moving average.
Travel Times Westbound


Travel Times Eastbound


Headways Westbound
Unlike the fairly consistent travel times above, headways are erratic, especially in the evening. This problem begins to appear well before the snow arrives, but becomes progressively worse through the evening. Headways over half an hour with multiple cars traveling together across the route are common. Note how the peaks and valleys become higher/deeper as one moves west across the route showing the typical problem of gap development.


Headways Eastbound
The eastbound service shows the same pattern as westbound with some very wide gaps during the evening.


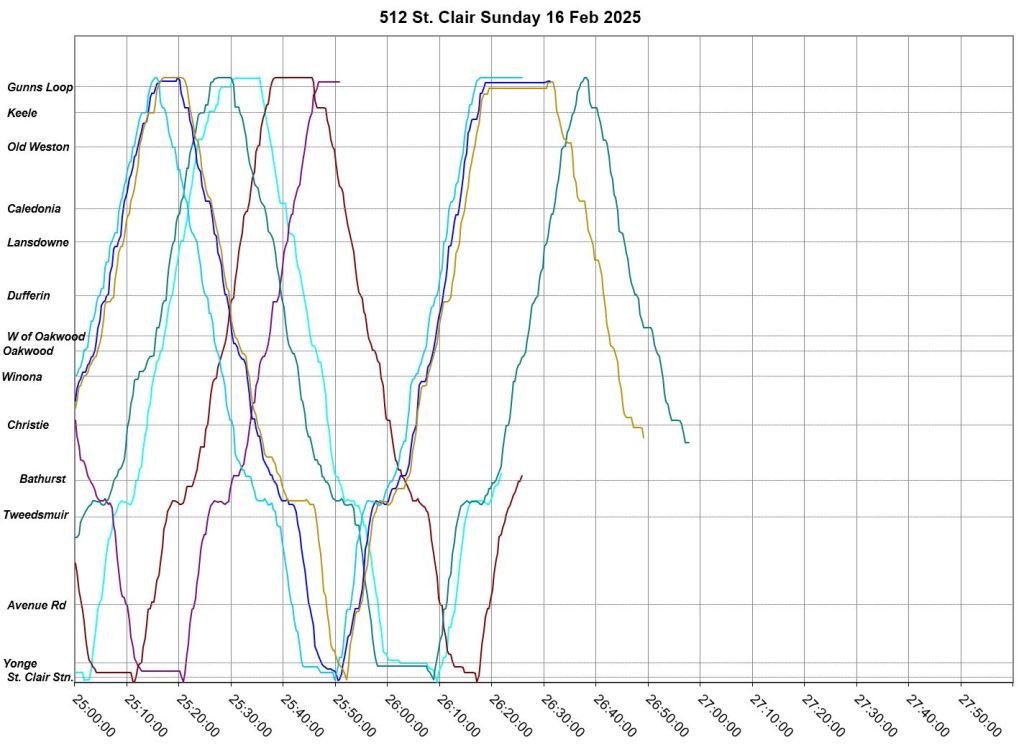
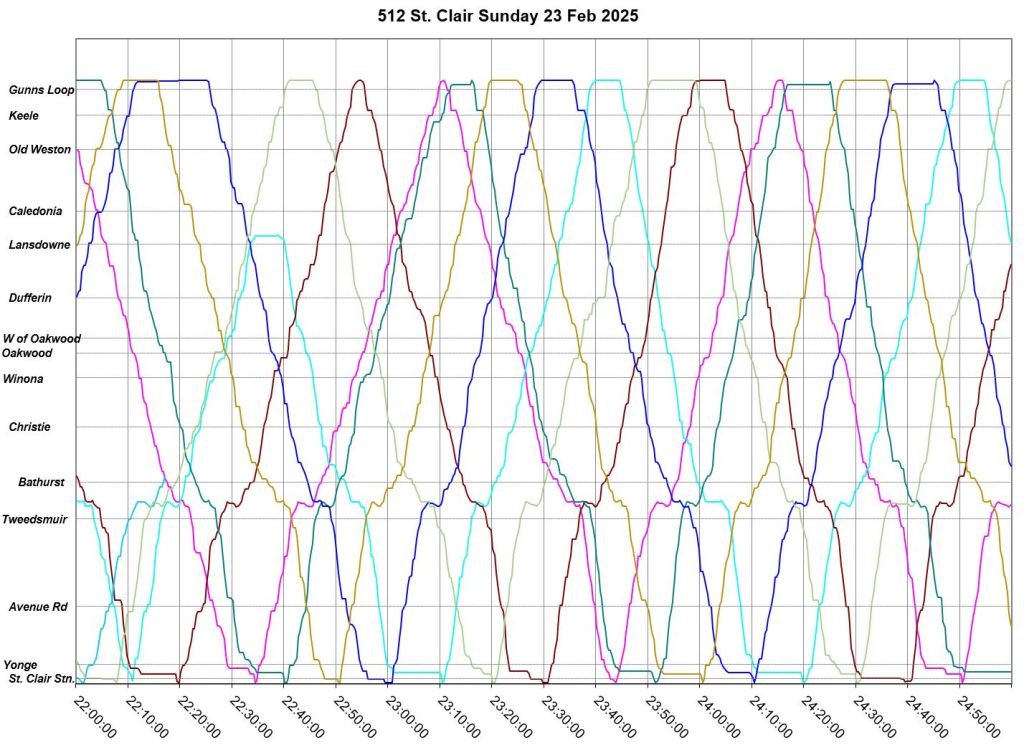
Sunday, February 16
February 16 was the second heavy snow day.
- After a rocky start, service was fairly well-behaved until mid-morning when severe bunching set in. Note that this was not accompanied by congestion or a major change in speed. Cars ran in twos and threes, and often did not move apart to create regular headways at terminals.
- A collision at about 1pm blocked service to Gunn’s Loop for over 4 hours. Streetcars turned back from Lansdowne. One shuttle bus from there west to Gunn’s appears in the tracking data, but there were probably more. (There are problems with the TTC’s tracking system being able to keep track of replacement buses, and this is echoed in the tracking data I receive.)
- Some short turns and bunching persist through the evening, but service was not blocked by the snow.


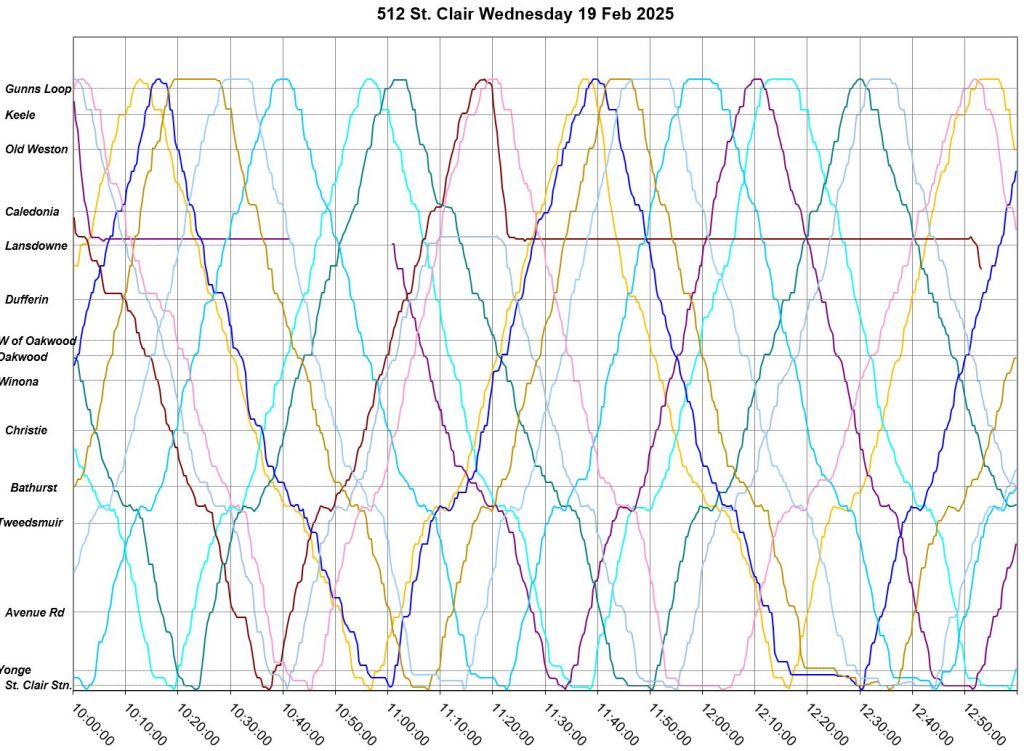
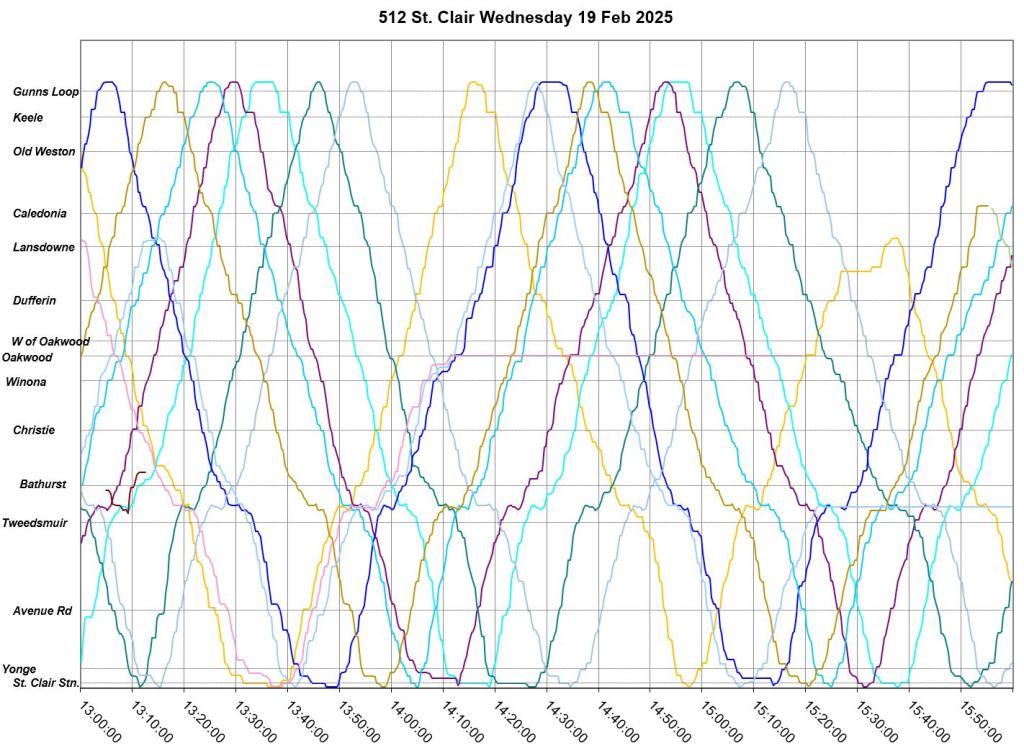
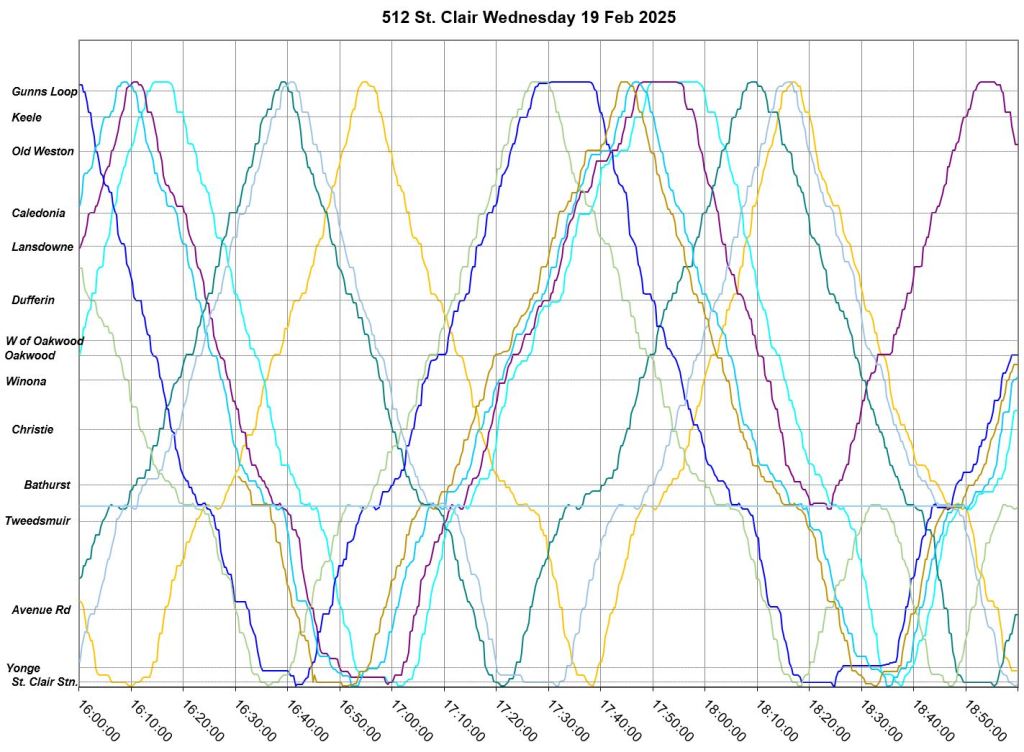
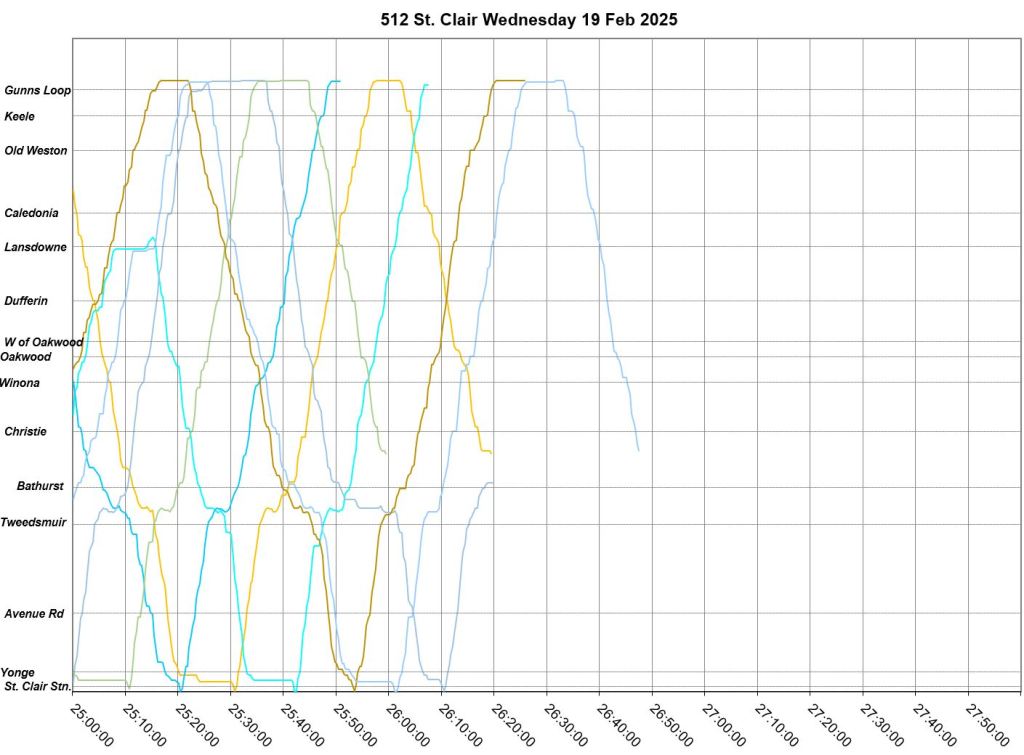
Wednesday, February 19
By February 19, service was somewhat back to normal, but still not ideal.
- A medical emergency just after 9pm blocked service between Yonge St. and St. Clair West Station for about 40 minutes.
- Bunching sets in even in the AM peak and continues through the day with particular severity in the early evening. The tracking data do not show any reason for this situation beyond the gradual accumulation of streetcars into packs that nobody managed to pry apart.
- There were several short turns at Earlscourt Loop as well as eastbound layovers.

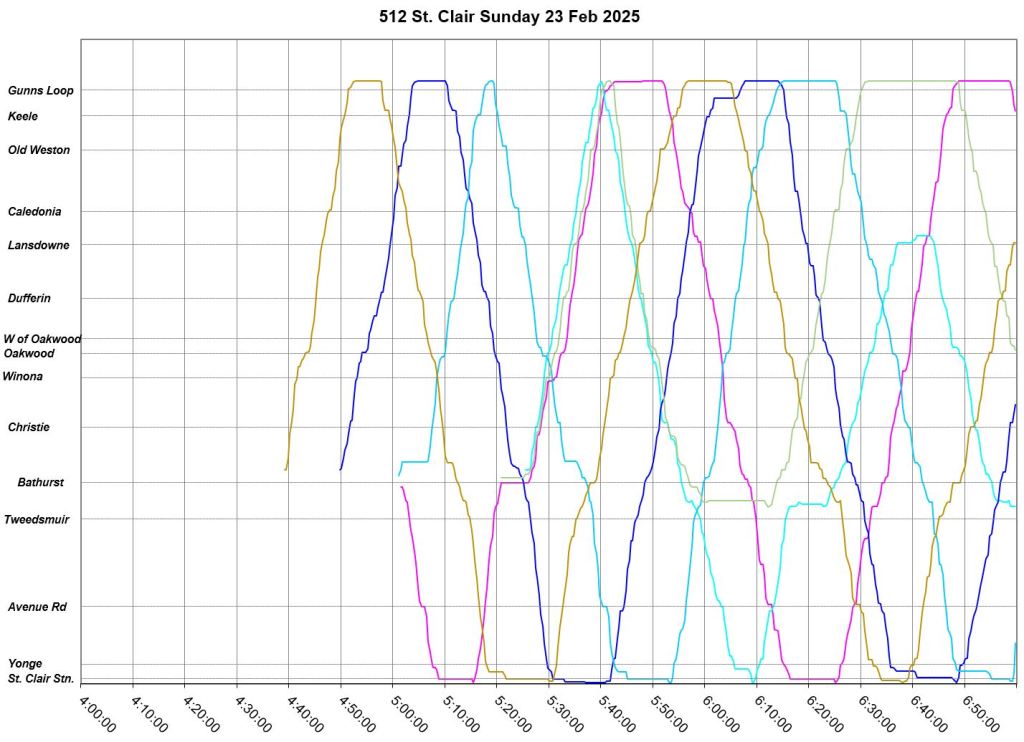
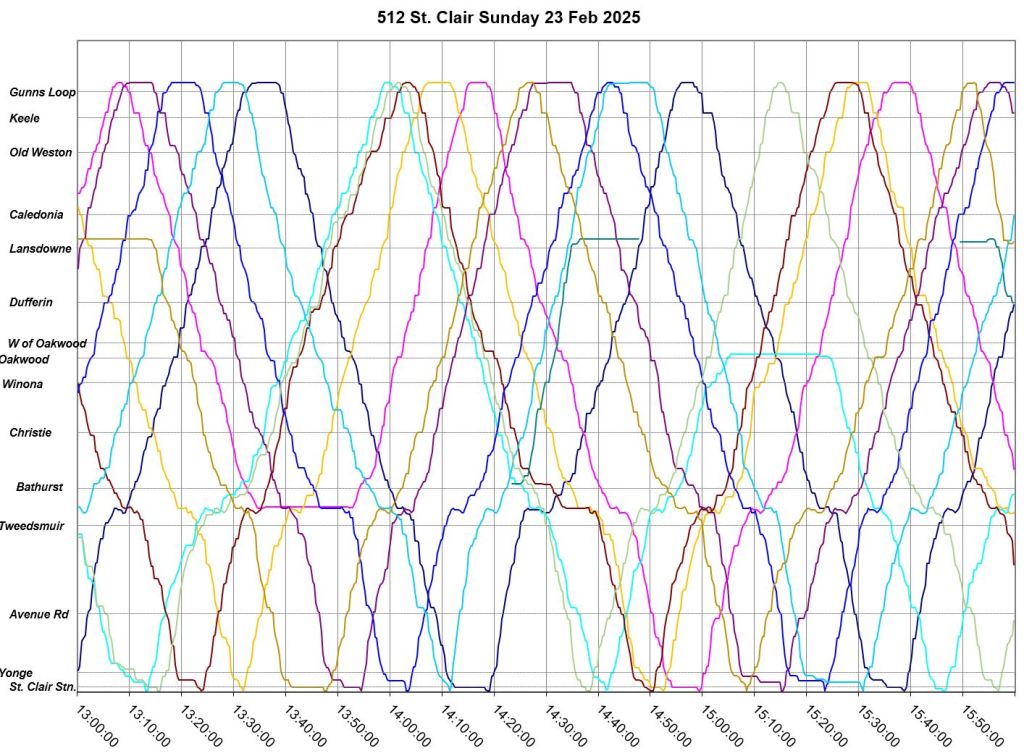
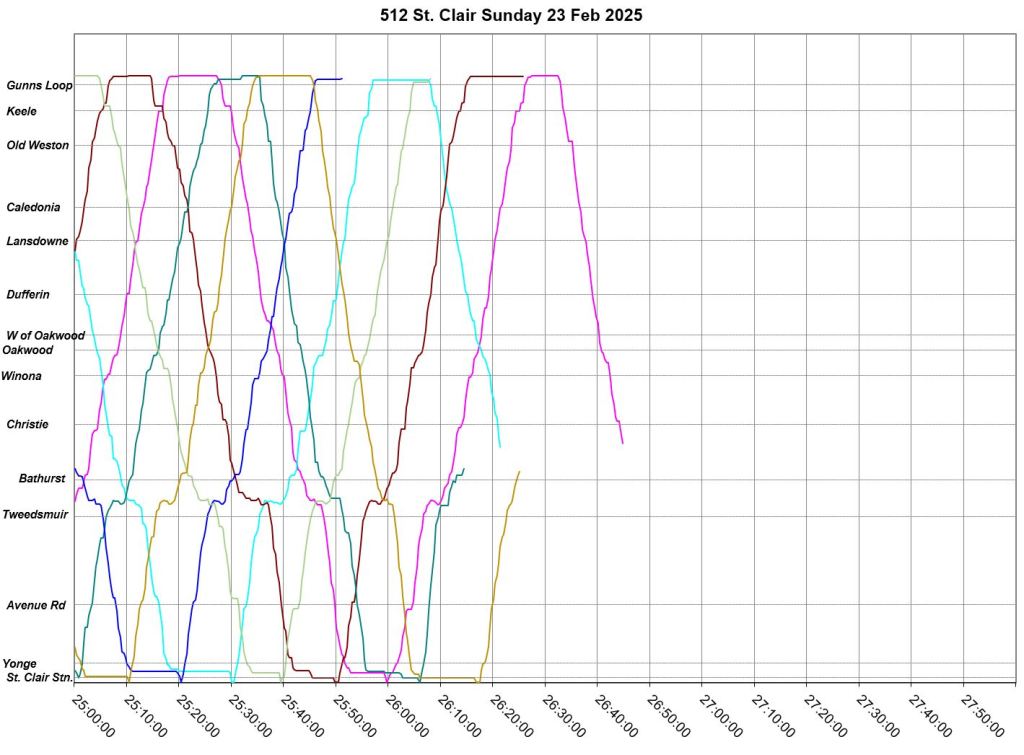
Sunday, February 23
February 23 shows the weekend service a week after the snow.
- Uneven service with bunches and gaps is common from the morning through to mid-evening.
- Several cars short turn or lay over eastbound at Earlscourt Loop


Thanks, Steve. I live on this route, close to Avenue Rd. With the promise of 8 to 10 minute service, I should be able to leave my apartment and expect to board a streetcar in short order. I can never count on that, and always, always, check my transit app before leaving to see how long the wait will be and how many cars are bunched up with 1 or 2 minute headways. Far too often, it’s quicker to walk to Yonge than to wait for a car to reach me, and if I’m headed downtown by subway, it can be quicker to take the 13 bus south to College station than to wait for a car westbound to St. Clair West station. There is no excuse for such poor (non-existent) line management.
LikeLiked by 2 people
I’ve read your site for a long time, and I’ve seen so many of these charts, but I don’t recall as many with that consistent level of variance in service lasting weeks, never mind it being on a route with a dedicated right of way!
Is this really the worst one you can recall ever seeing?
Steve: Yes, it’s really bad. Service management is practically non-existent on some routes and it’s been getting worse. There are only so many articles like this I can write. but I try to pick examples that illustrates important points. In this case, it is transparently clear that problems with service have nothing to do with traffic or weather or plagues of frogs or whatever. The TTC simply doesn’t care.
LikeLiked by 2 people
I live on the 512 route. It’s always baffled me why a line that’s outside the downtown core, does not intersect with any other North-South streetcar lines, and runs on a separated track on a not too busy street, manages to be this inconsistent and unreliable. I wish I could upload all the pictures I’ve taken of 4-5 streetcars bunched up one-way, or the screenshots of Transit app showing the next 3 cars 21, 22, 23 mins away.
Thank you for your analysis.
LikeLiked by 2 people
Was hoping I’d see data for February 12, as I have text message correspondence from that evening with a friend when I waited at least 30 or 40 minutes in windy, blowing snow for an eastbound streetcar at Keele and St. Clair. Eventually 4 showed up in a row, but if transit data was to believed there was a long stretch around 8:30pm where not a single streetcar was pointing eastbound along the entire route.
Steve: I have added the chart for February 12. It’s not pretty, but what is striking is that the very poor evening service is largely down to poor spacing of cars, not delays enroute.
LikeLike
Have you’ve received the March 30th service change memo yet now that the TTC have announced the service increase for that period?
Steve: I expect to receive it later today (Mar 25).
LikeLike
Apparently, the #1 ask at consults ahead of the RoW design, was for safer cycling, but after done, it’s extremely fraught/tight – at least on-road. The RoW has a bit of extra space, and at least the tracks aren’t a persistent and bad hazard, but there aren’t other side streets to use, and there’s getting to be pavement degradation too. Maybe we should be thinking of having TTC vehicle RoWs on the sides of wide roads, in a shared curb lane with bikes.
As it is, many cyclists aren’t ‘suicycle’.
LikeLike