
Updated February 7, 2025 at 8:00pm: It occurred to me that although charts here are produced with maximum Y-values of an hour, or even 90 minutes, that this shows the peak times while compressing the visual range of the area where averages change over time. I have added a second set of charts for 2016-2025 with the maximum Y of 30 minutes to give the area where averages move between 15 and 25 minutes more “elbow room” and to make the evolution of values easier for readers to see. These have been added at the end of the “Implementing the Transit Mall” section.
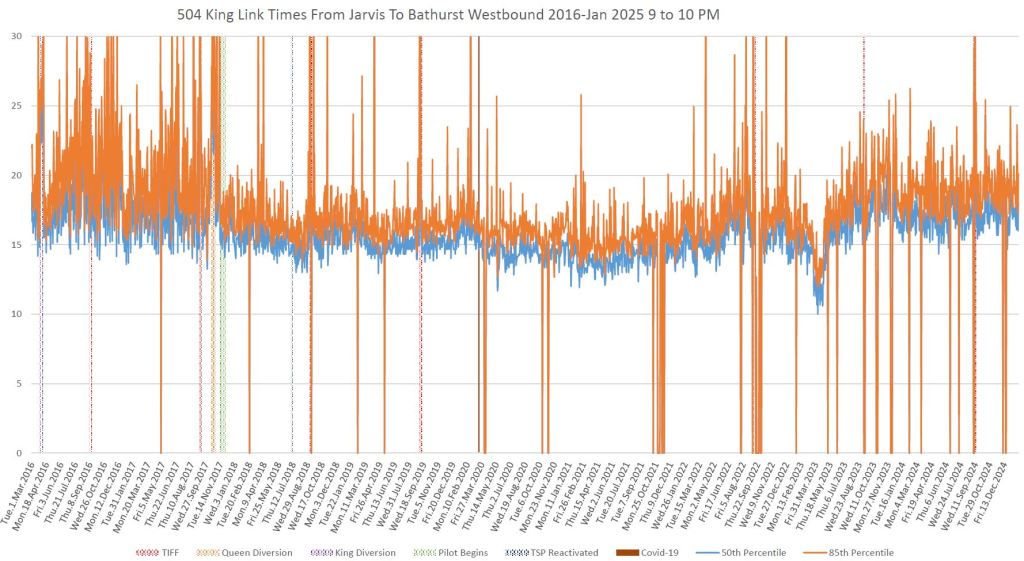
In previous articles, I have posted charts showing the changes in travel times on the central portion of the 504 King route between Jarvis to Bathurst. This is the area covered by the supposed transit mall, although the degree to which streetcars actually have priority has varied over time for various reasons.
This article will review how travel times have evolved in recent years, as well as looking back to pre-pandemic and pre-transit mall eras. Full chart sets are available via links to PDFs for those who are interested.
Beyond that central section lies the conventional “streetcar” portion of the route west through Bathurst/Niagara, Liberty Village and Parkdale. To the east is the northern reaches of the St. Lawrence and Distillery districts. Do these deserve the same level of priority treatment? What would be the benefit if any? I will turn to those areas later in the article.
For those familiar with similar analyses on this site, I have retained the format of charting the 50th percentile (median) and 85th percentile values. These show both the general trend over time as well as the degree by which trips can vary from the median affecting reliability both in the priority area and on the broader route.
Significant events include the implementation of transit priority in November 2016, the covid lockdown in March 2020, and the effect of enforcement (or lack of it) on the ability of streetcars to move briskly through the priority area. Also important to note is that the effects differ by time and direction, and that congestion interferes with transit not just during the classic peak periods.
The important history lesson on King Street is that transit priority can improve travel times, but more importantly can improve reliability leading to more predictable trips and vehicle spacing over a route even beyond the bounds of the priority scheme’s area. Moreover, the benefits are easily lost through lack of enforcement and external events that significantly change demand on the road network.
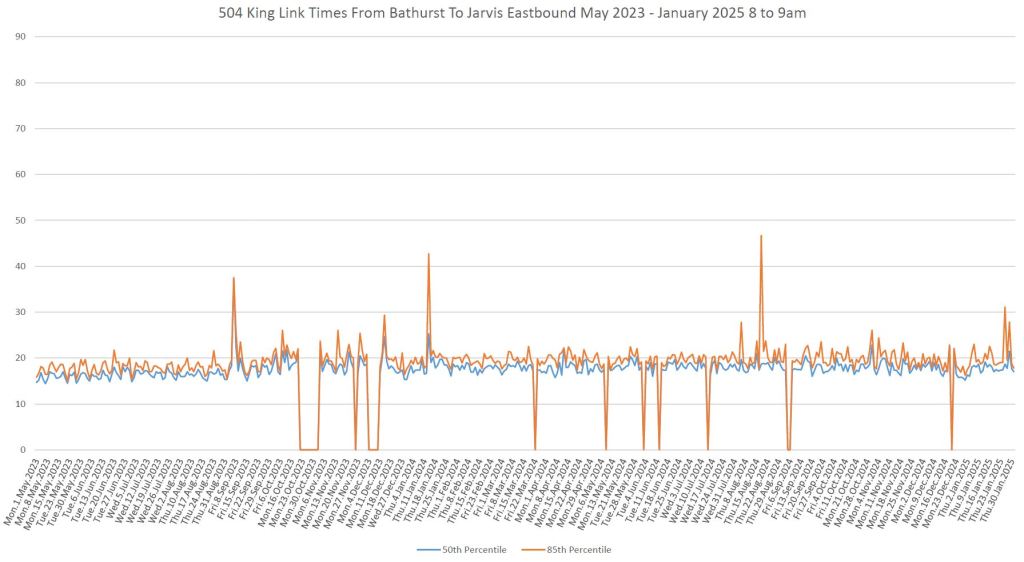
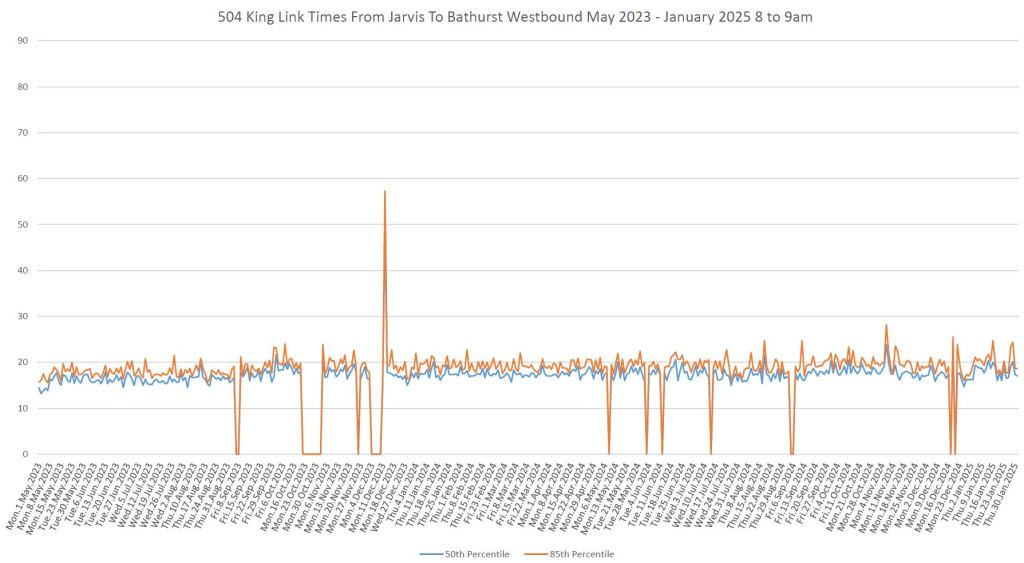
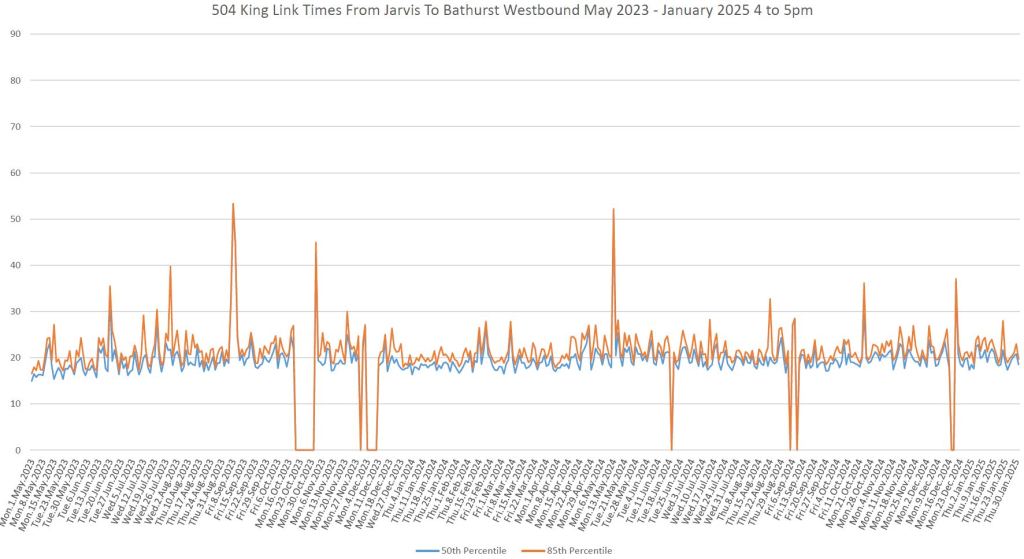
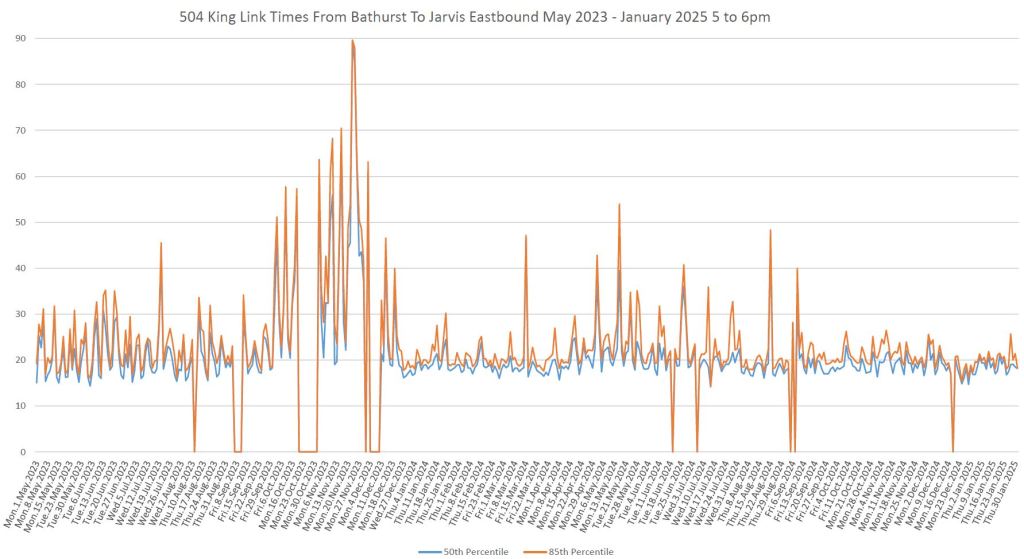
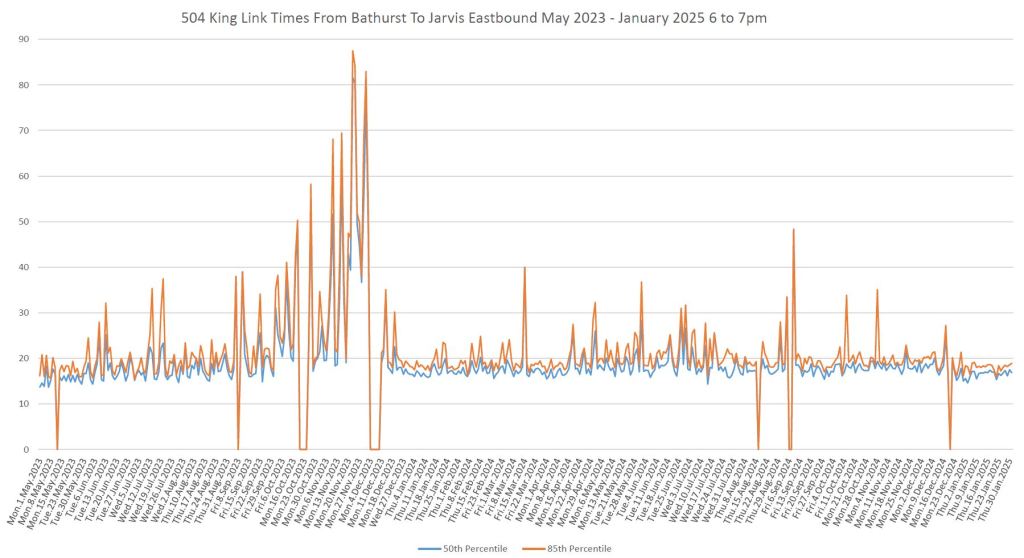
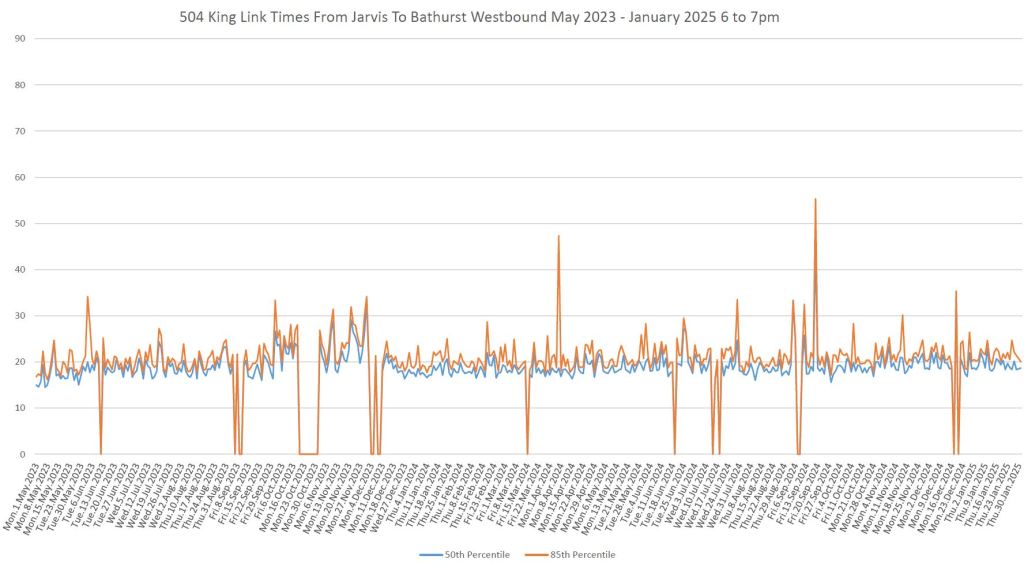
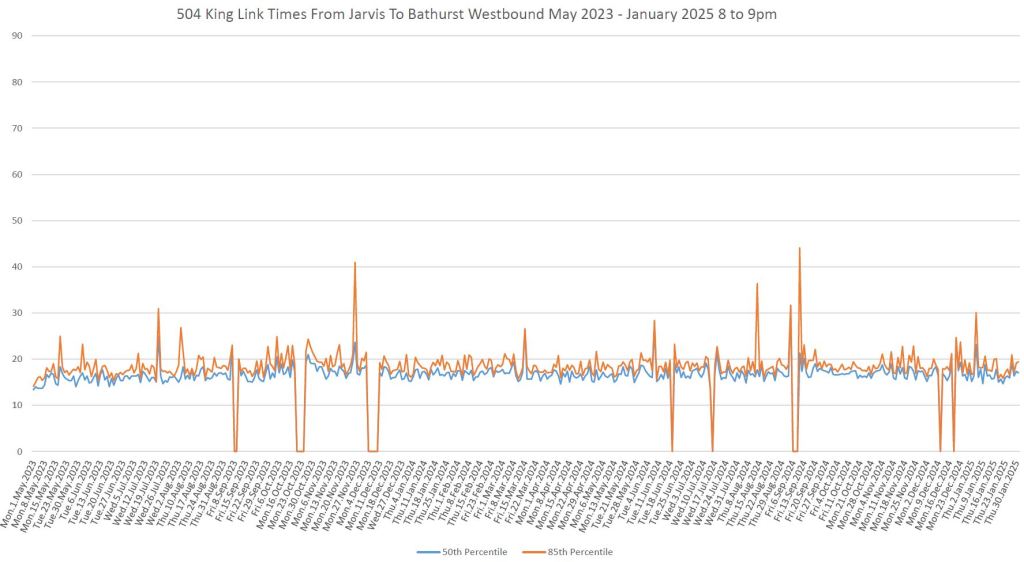
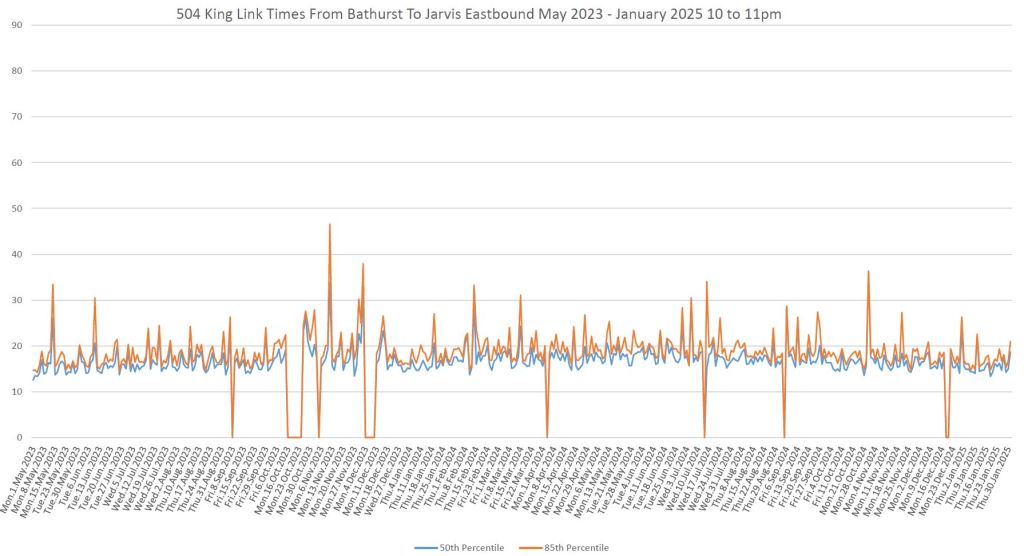
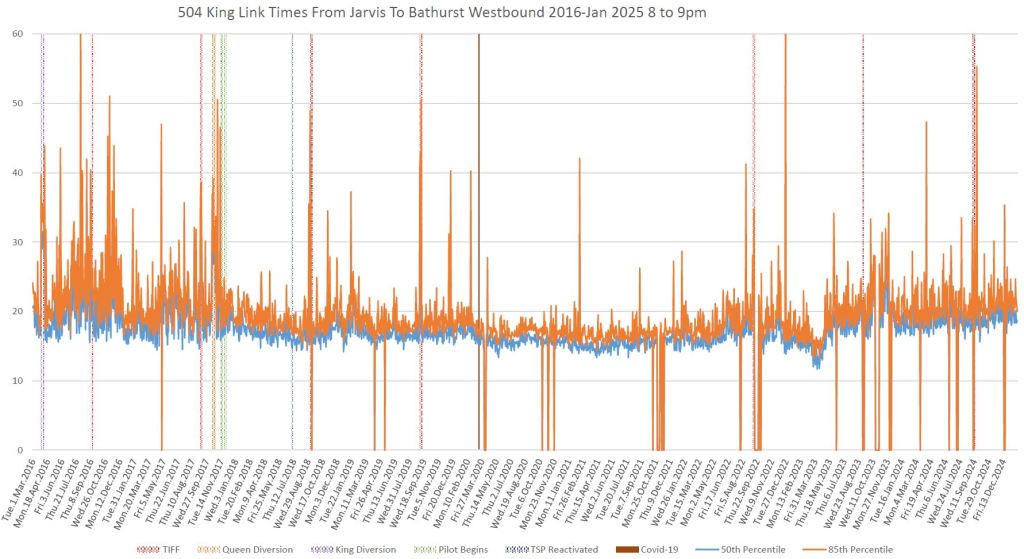
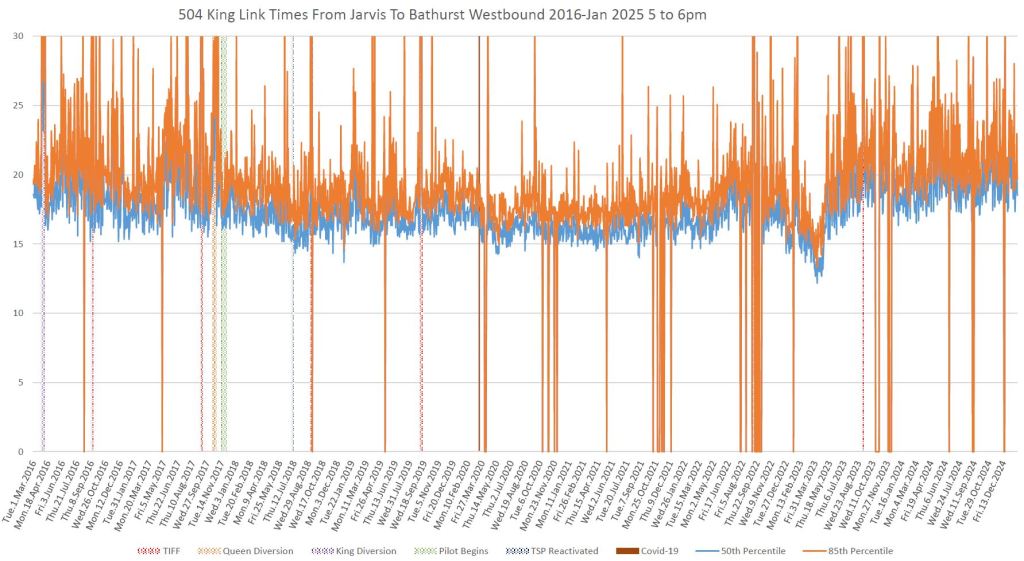
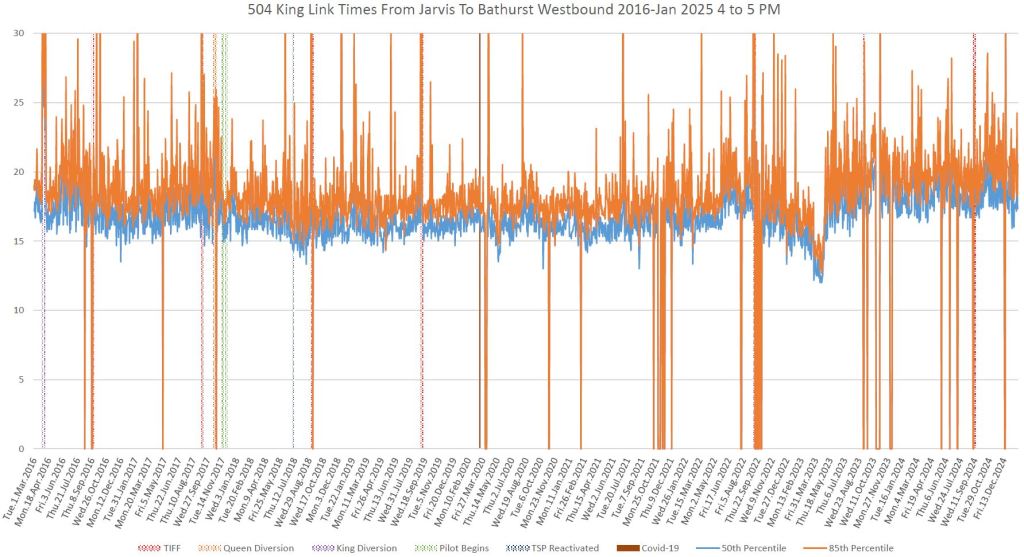
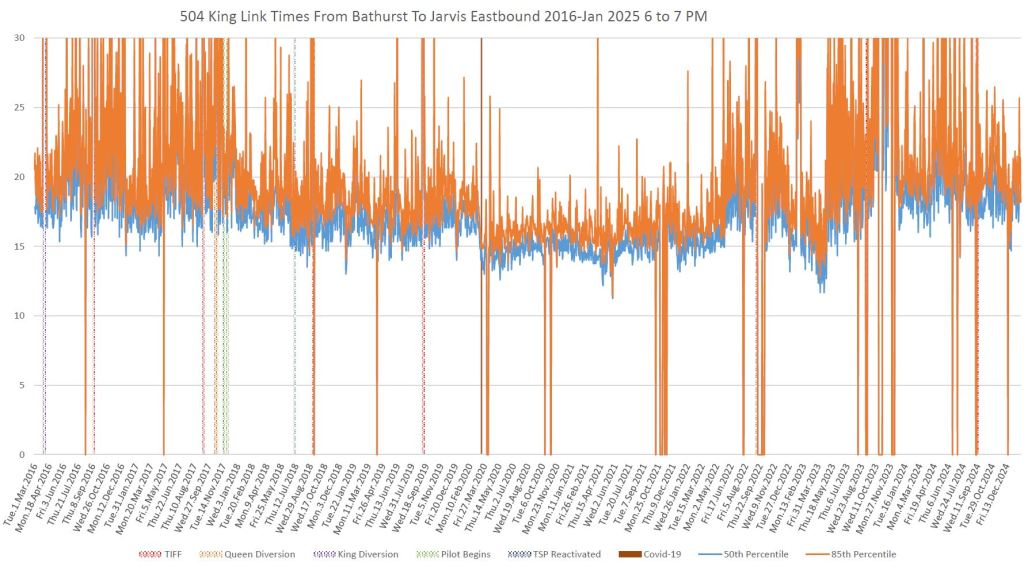
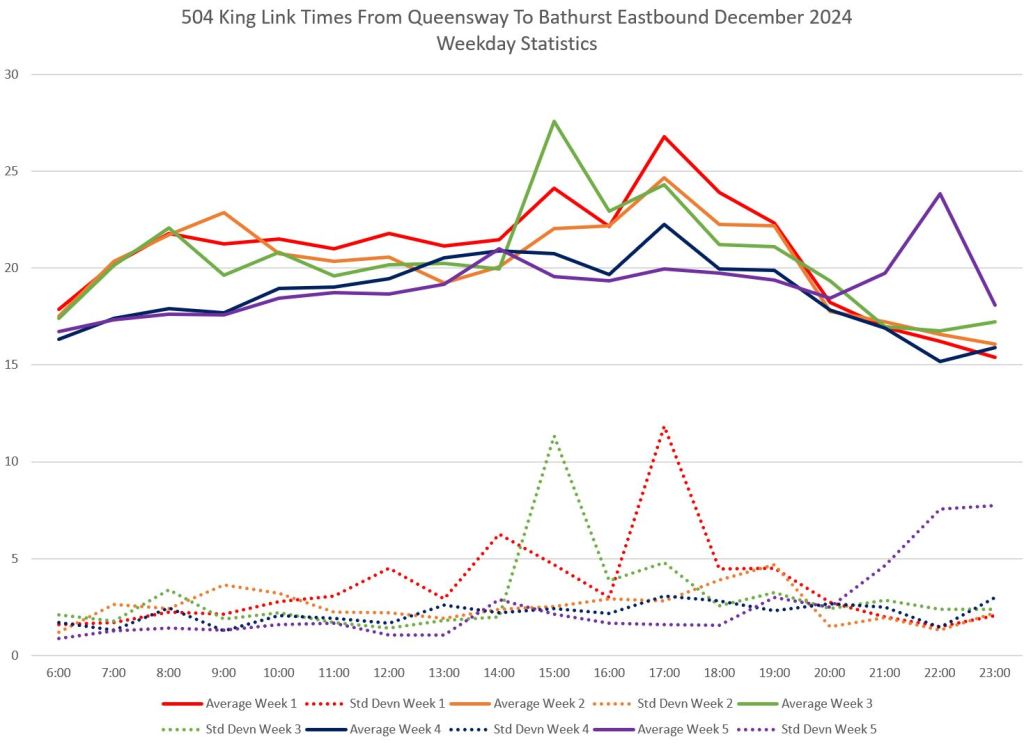
The Recent Past: May 2023 to January 2025
May 2023 marked the beginning of the Queen service diversion onto King Street for Ontario Line construction. For most of the period, the east side 501 service operated both ways via Church to loop via Wellington, York and King. For a brief period in fall 2025, anticipating the opening of a new diversion route via Richmond/Adelaide, the east and west halves of the 501 Queen were reunited, but operated via Church, King and Spadina. During this entire period, there was no transit priority signalling for turns eastbound at King & Church, and westbound at King & Spadina (as well as other turns on the Queen diversion).
Adelaide Street was under construction for utility relocations and, eventually, new track. This further constrained road capacity for eastbound travel.
Traffic agents were added mid-way through the period when congestion on King became intolerable. The combined effect of traffic diverted from Adelaide and Queen Streets, with the lack of signal priority for turning streetcars caused massive backlogs west from Church Street.
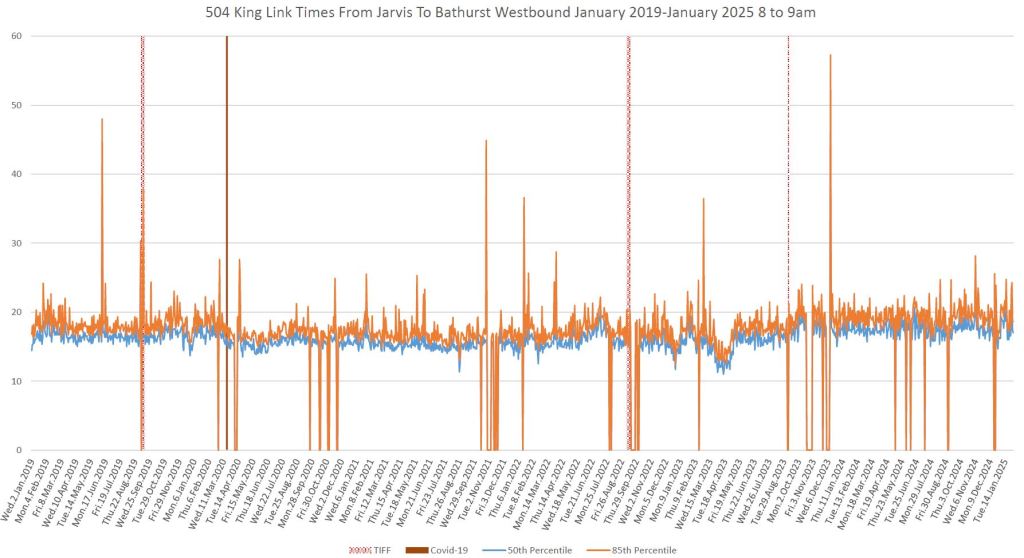
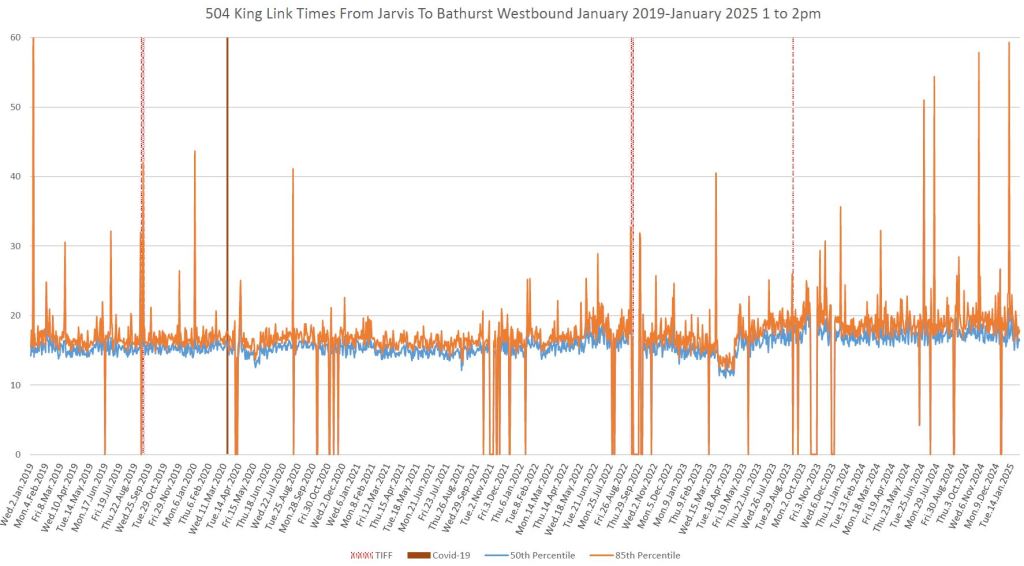
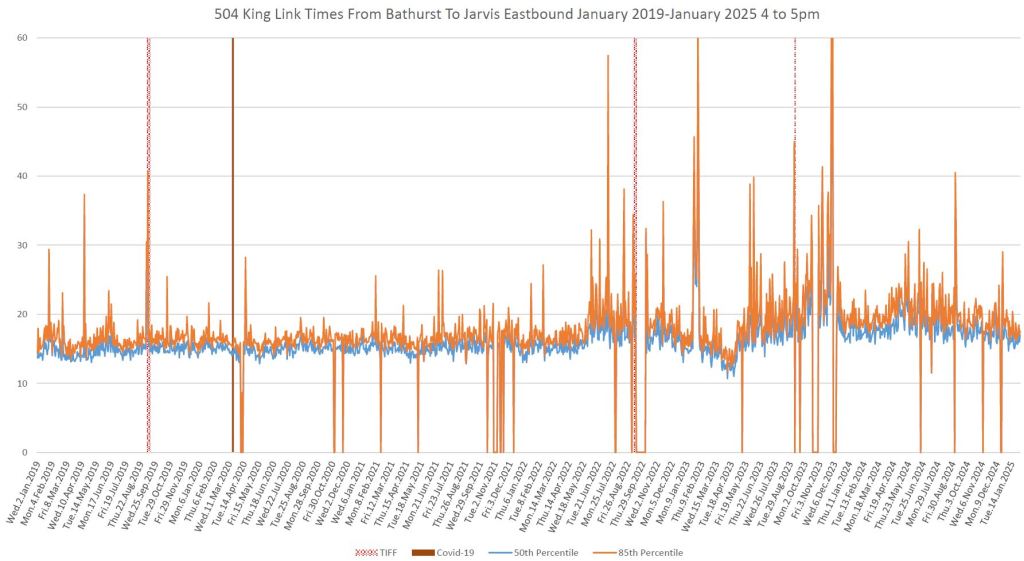
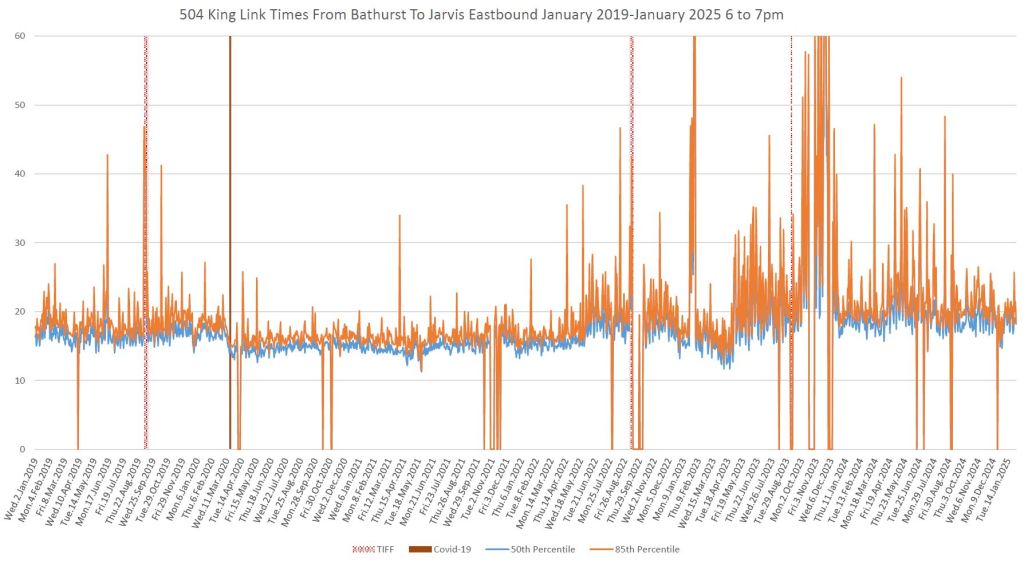
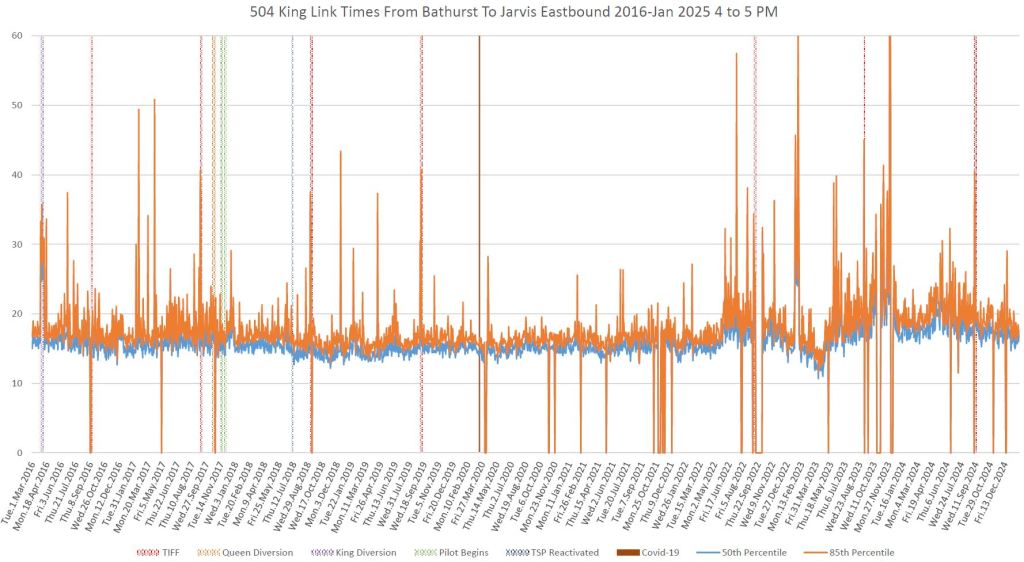
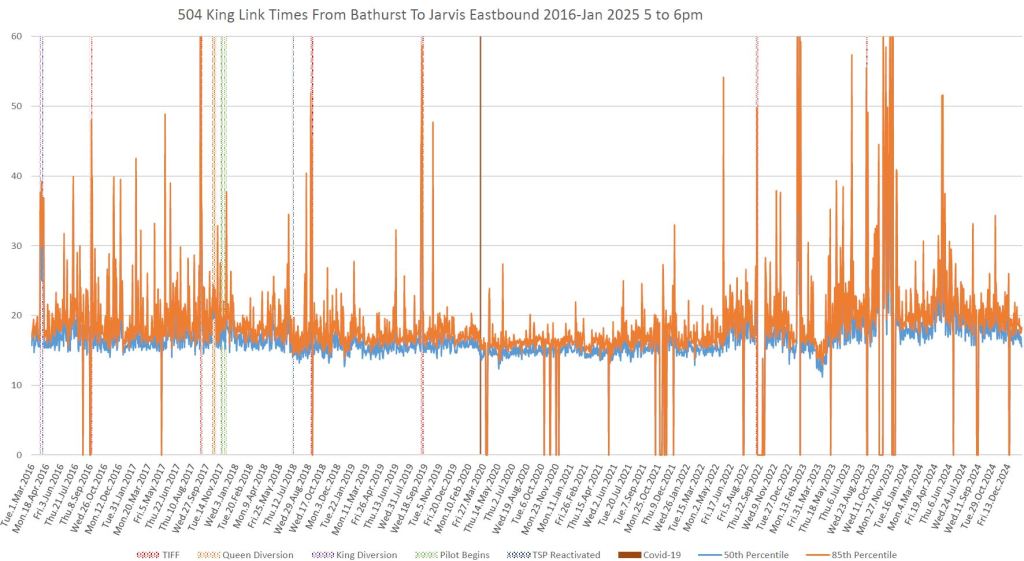
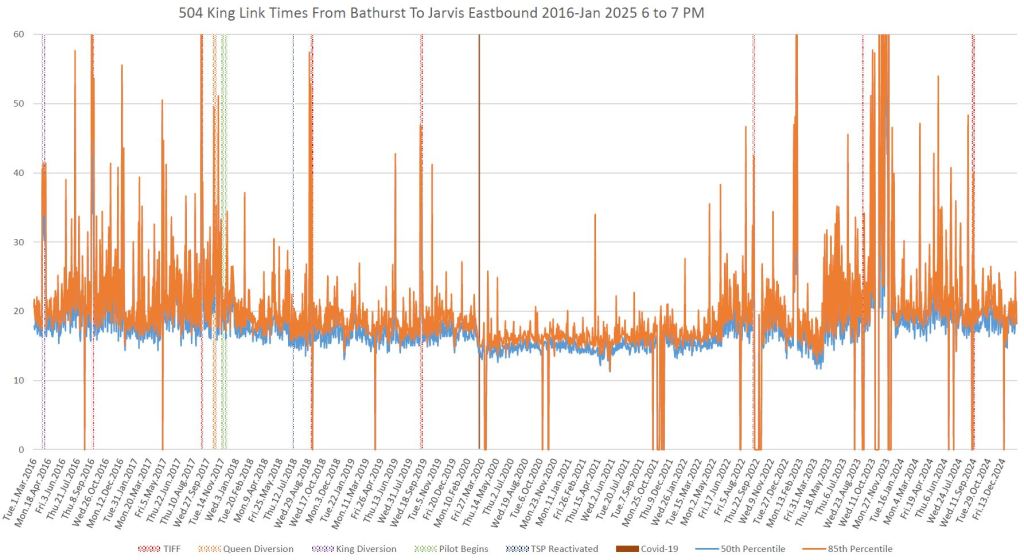
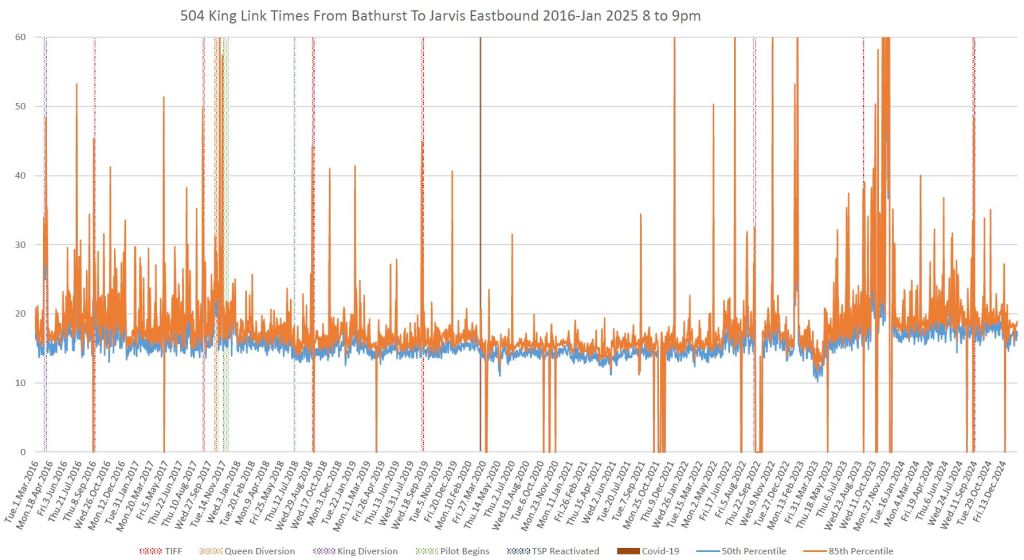
The gallery below (click on any image to open and browse) shows the eastbound (left) and westbound (right) travel times between Bathurst and Jarvis on weekdays by hour. For example, points along the blue lines show the median of travel times for all streetcars (and occasional buses) for a one hour period with each day’s data plotted separately. The orange lines show the 85th percentiles which stay close to the medians when all service is bogged down, or rise above the median when only a few cars are delayed.
Dates when there are zero values correspond to diversions or short term service interruptions when there was no continuous service between the two streets. Points of note:
- Except for the spikes corresponding to congested periods and delays, the values are consistent with a slight rise between May 2023 and January 2025.
- The congestion problems eastbound peaked in November 2023 when travel times above one hour were common. The contrast here between westbound and eastbound times is quite striking.
- The magnitude of the congestion problems shows the effect of a laissez-faire attitude by the City to traffic management until the situation raised media attention and public ire. This is not the “transit first” type of project planning we should expect.
- The periods starting at 8, 9 and 10pm are included to show the effect of the Entertainment District. The spikiness of the charts especially after 10pm reflects the day-to-day variation in travel times caused by theatre and club traffic especially after 10pm.
Notwithstanding the apparent stability of travel times looked at in average, service quality leaves a lot to be desired on King with bunching and erratic arrivals of the 504A Distillery-Dundas West and 504B Dufferin-Broadview services. Travel times might be under control, but savings on that account can be undermined by long waits for a streetcar to appear. I will turn to that in a future article.


PDF Chart Sets:
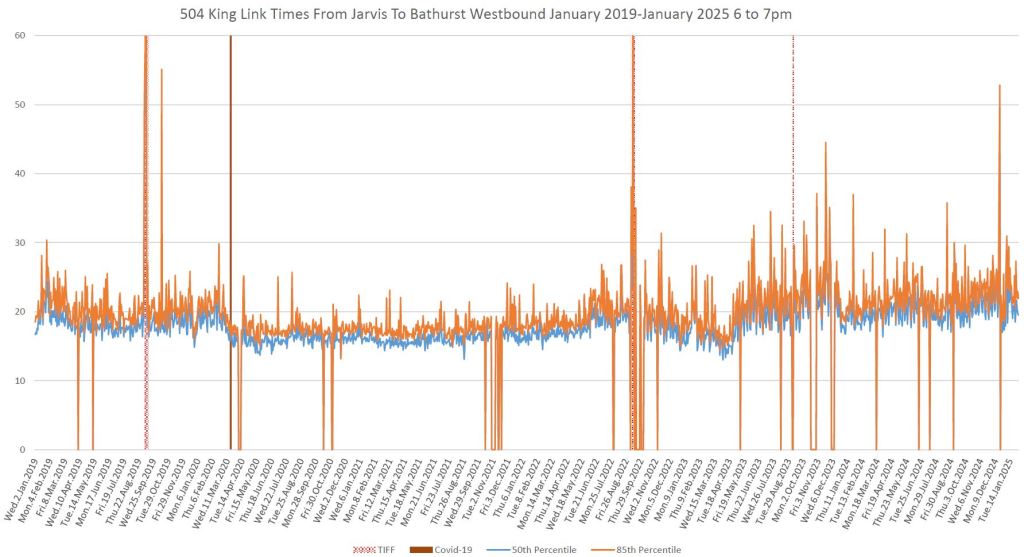
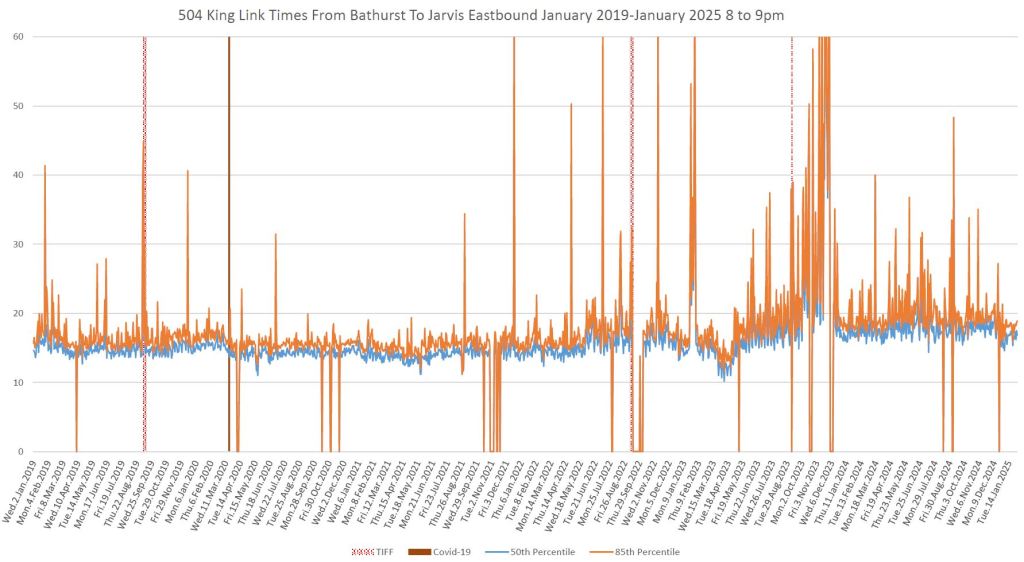
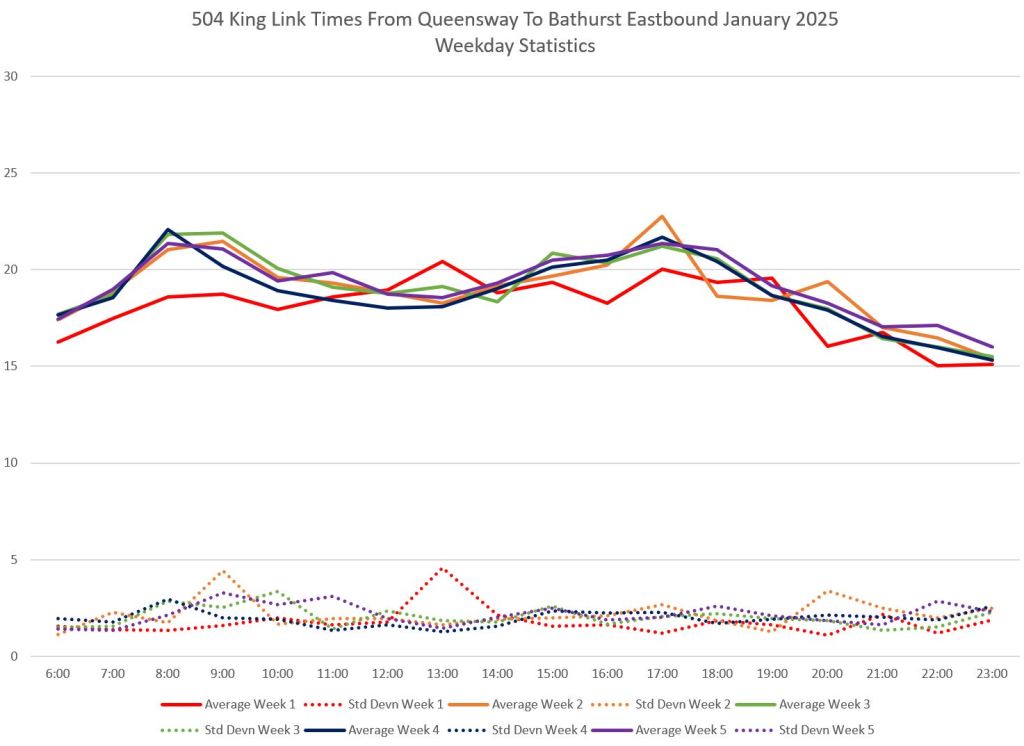
The Pandemic Effect: January 2019 to January 2025
The next set of charts include the period in the section above, but go back further to a time before the pandemic. Travel times across the TTC dropped in March 2020 because road traffic evaporated, and with lighter riding, stop service times fell too.
The significance of the drop of travel times early in the pandemic is this shows a “best case” for travel along a route with few or no obstructions.
- The charts here have a maximum Y value of 60 minutes compared to 90 in the charts above where I used a higher value to show the range of values during fall 2023 congestion problems. On the charts below the values above one hour are clipped.
- The vertical brown line on the left side of the charts marks the onset of the pandemic lockdown.
- The return to “normal” is evident from 2022 onward especially in the evening hours.
- There is a dip in travel times in April 2023 just before the Ontario Line diversions began. This corresponds to a period of bus operation. King street is beset by many track junctions where TTC rules require a stop and proceed, slowly, operation regardless of the condition of the track. Buses do not face these delays (four intersections within the area) and make better time even when the street is congested. The issue is a combination of deferred track maintenance and an overabundance of caution across the streetcar network.
- Generally speaking, travel times today are slightly higher than they were in 2019.


PDF Chart Sets:
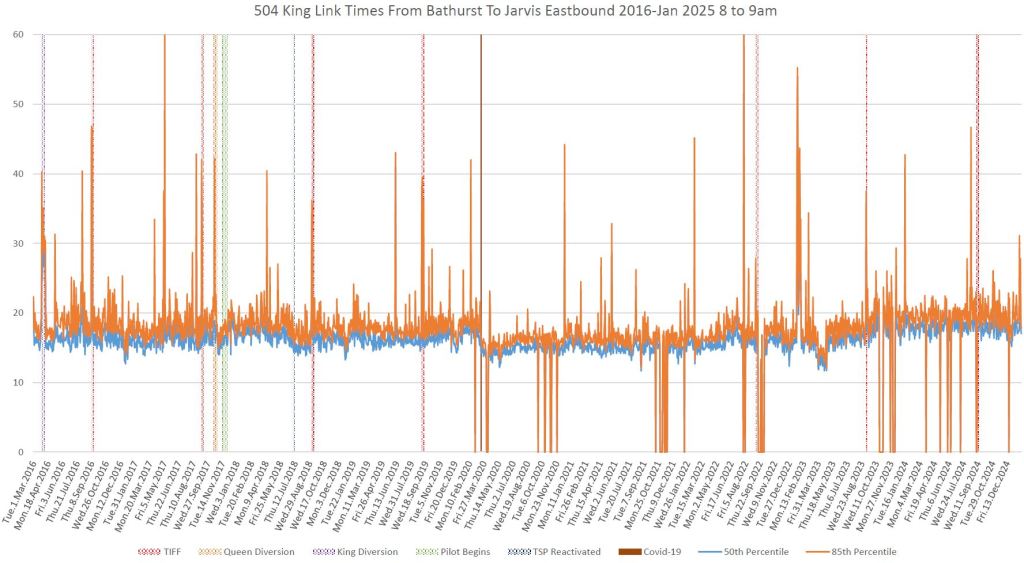
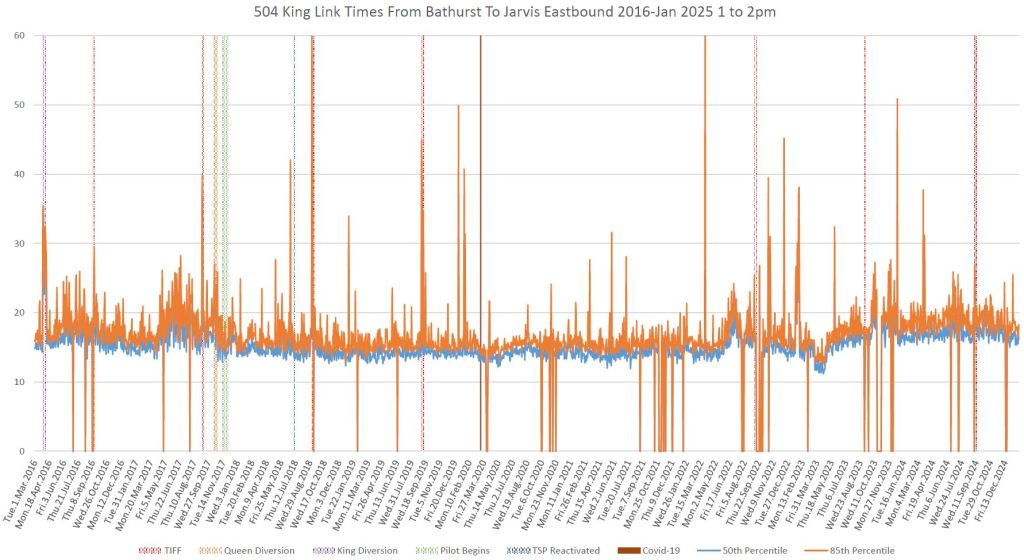
Implementing the Transit Mall
The next set of charts goes back further to March 2016 before the transit mall was in place. Also, 504 King was operated with the smaller and sprightlier CLRV streetcars in 2016 and did not complete the transition to the new Flexitys until January 2019.
The section left of the vertical green bar predates the transit mall. At the transition, the change in travel times is small at some hours, notably the 8am period when King Street was not congested to begin with. However, the reduced variation in travel times is quite clear later in the day when service quality improved a great deal.
However, some benefits of the transit scheme have been lost with travel times at or above early 2016 levels. Variability is better today, but this depends on the constant presence of traffic wardens to avoid blocked intersections.


PDF Chart Sets:
Update: Expanding the Charts to Show Variations More Clearly
The charts in the preceding section have a maximum Y value of one hour to make room for most of the spikes in the data. However, this means that variations in the averages which generally lie between 15 and 25 minutes are squeezed at the bottom of each chart. The following charts show the same data, but with a maximum Y of 30 minutes.


PDF Chart Sets:
- 2016-2025 Bathurst-Jarvis Eastbound (30 minute scale)
- 2016-2025 Jarvis-Bathurst Westbound (30 minute scale)
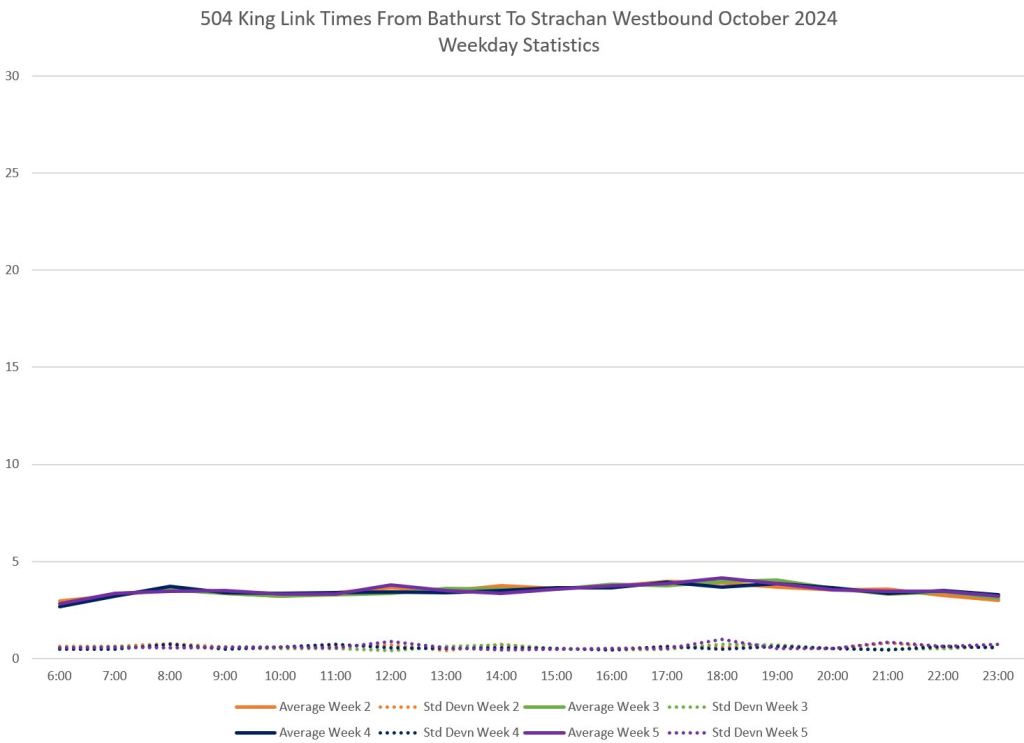
King West from Bathurst to The Queensway
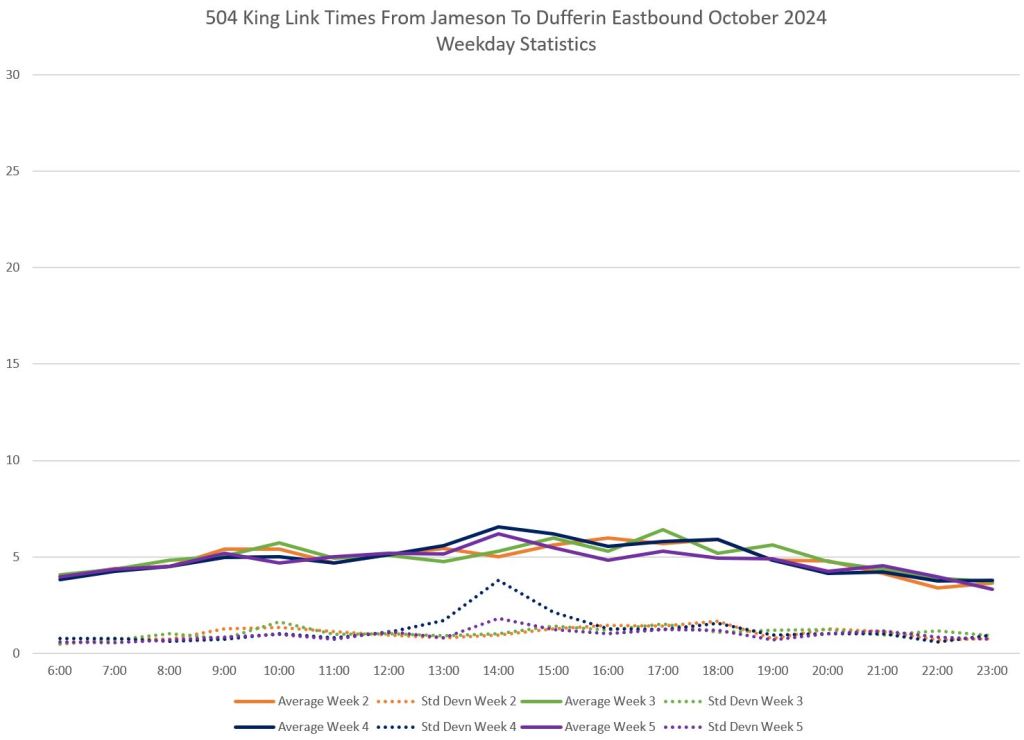
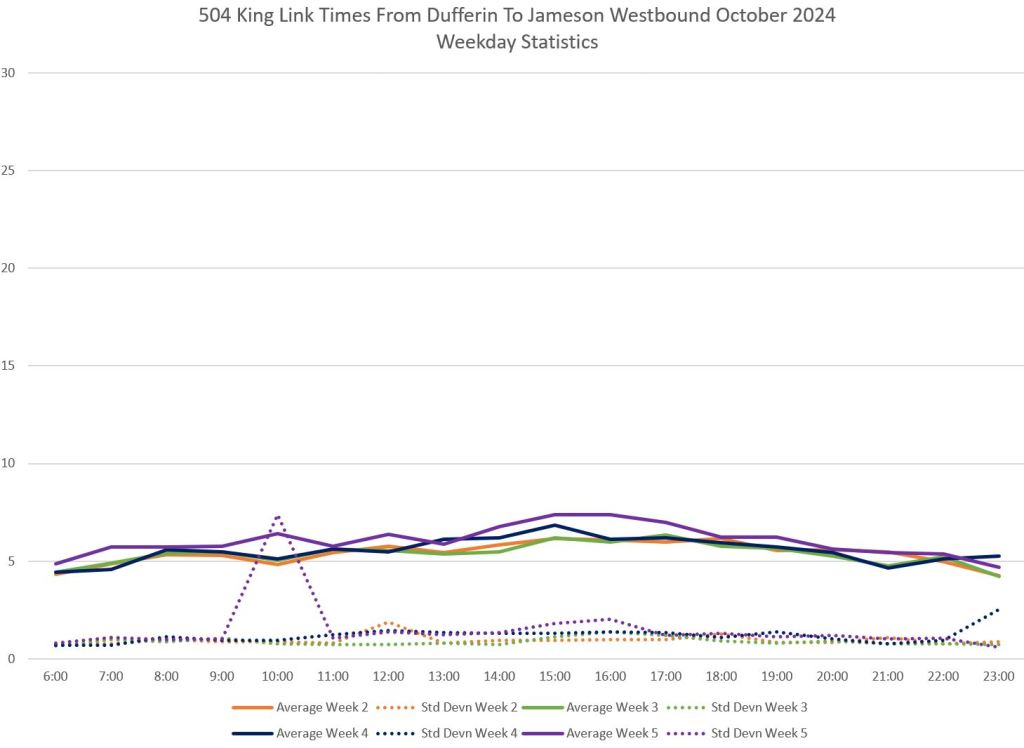
This section presents travel time data for recent months on the portion of King Street west of the transit priority area. Although I could produce a longer time series, there would be long gaps corresponding to construction projects that have blocked and rerouted streetcar service. Data from October 2024, when streetcars resumed operation on King West, are included below.


Looking at this in more detail, here are the travel times for shorter segments. The overall “hump” in the travel time charts above does not have a single origin, but is spread along the line. This implies that site-specific changes such as traffic signal timing could address travel times without the political upheaval of attempting to get full-time reserved lanes.
An important difference west of Bathurst is that there are no parallel streets to absorb diverted traffic as there are in the core, and the land use along much of this area does not lend itself to the same sort of cafe society found downtown.


Looking at later months there are spikes in some weeks which, upon closer examination are the result of major incidents or diversions.
There are certain locations (Jameson, Dufferin) where approaching traffic can queue because it is bound for the Gardiner Expressway. This will not be corrected with a transit priority lane and could, due to limited space, make the situation even worse.
Another issue is that only half of the King service runs west of Dufferin Street, and it is hard to argue for dedicated road space for a scheduled service every 10 minutes.


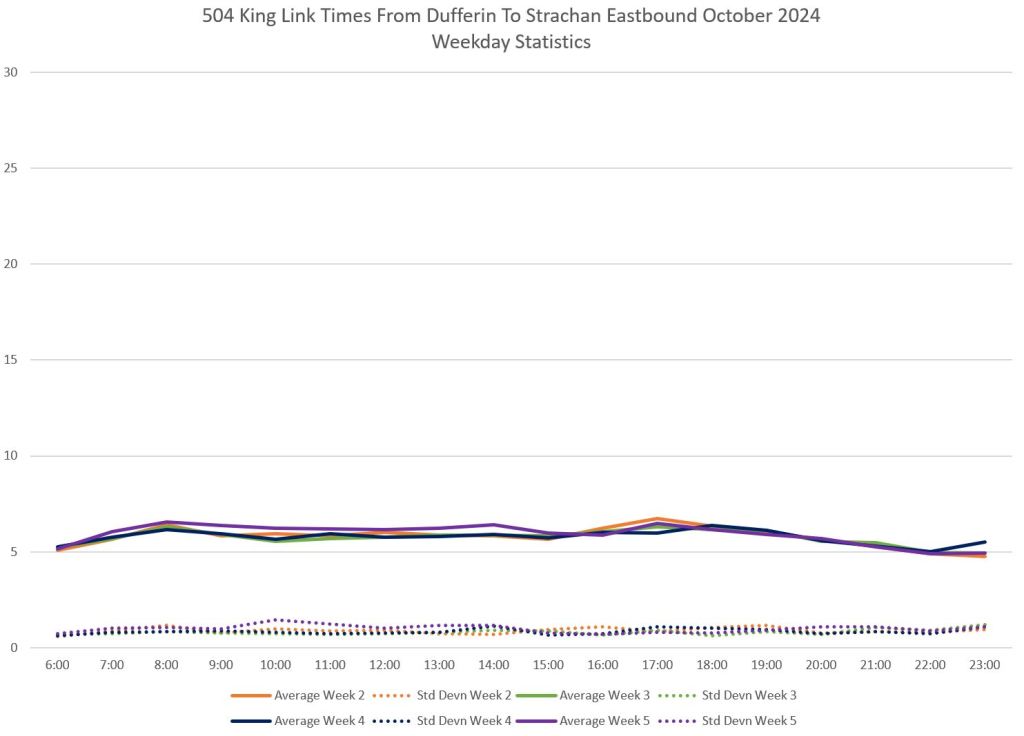
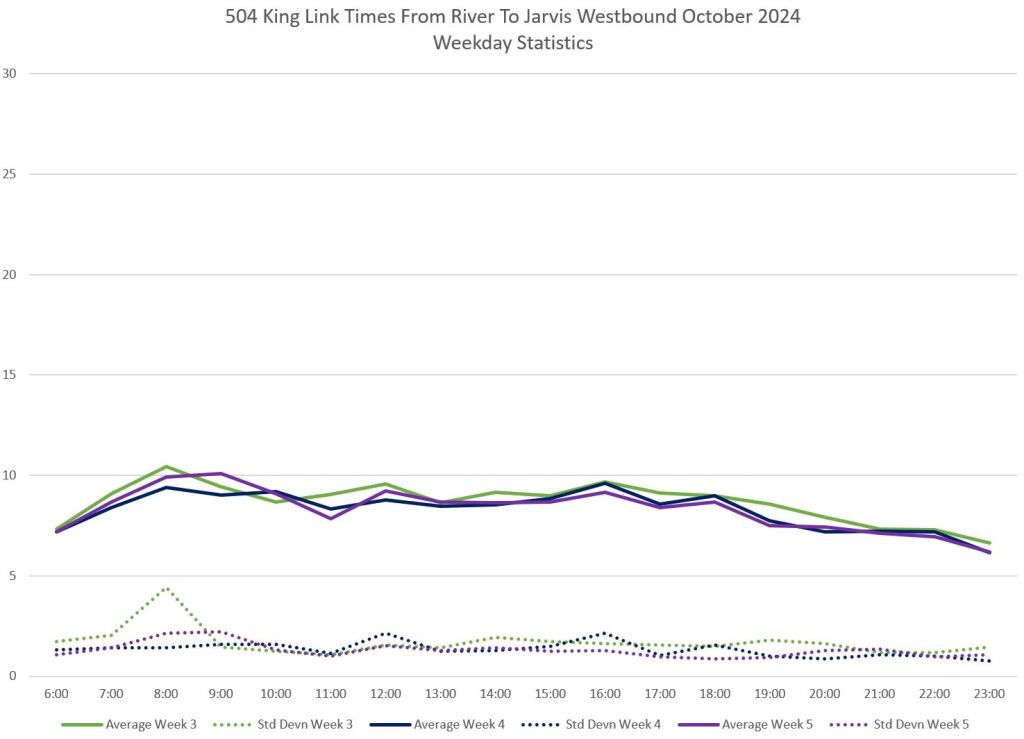
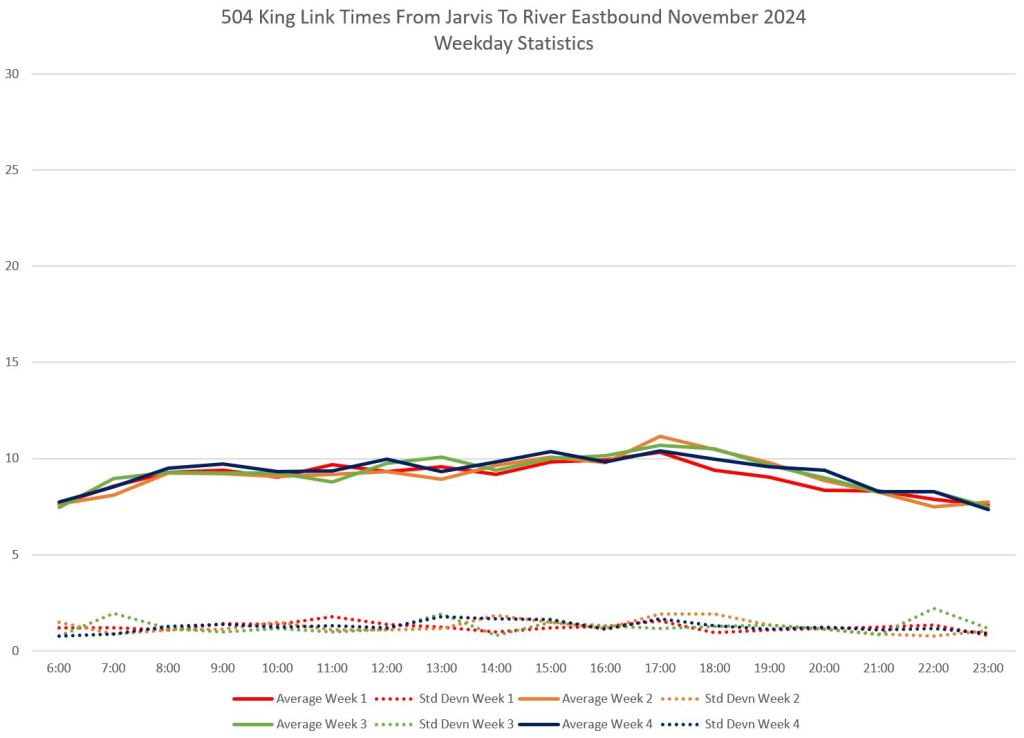
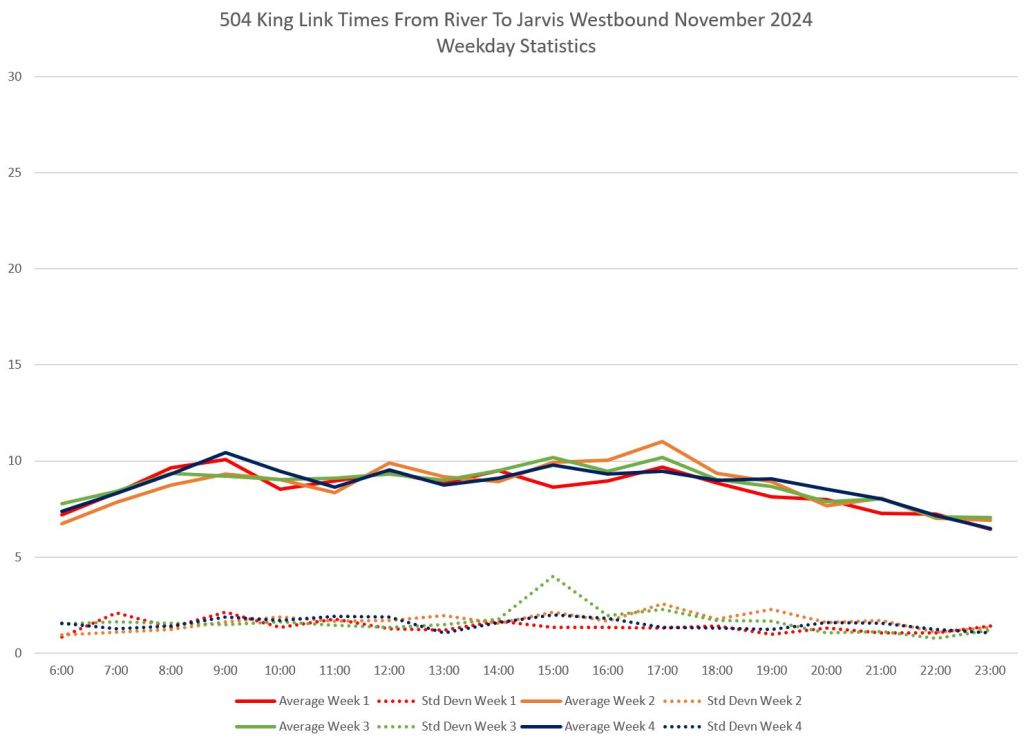
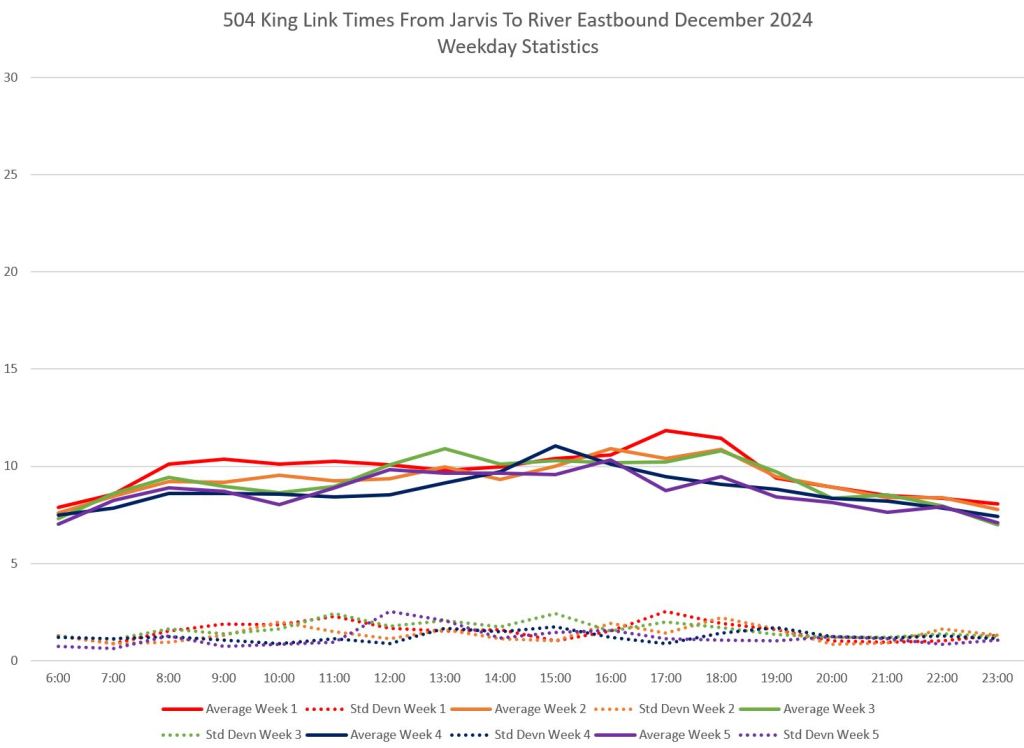
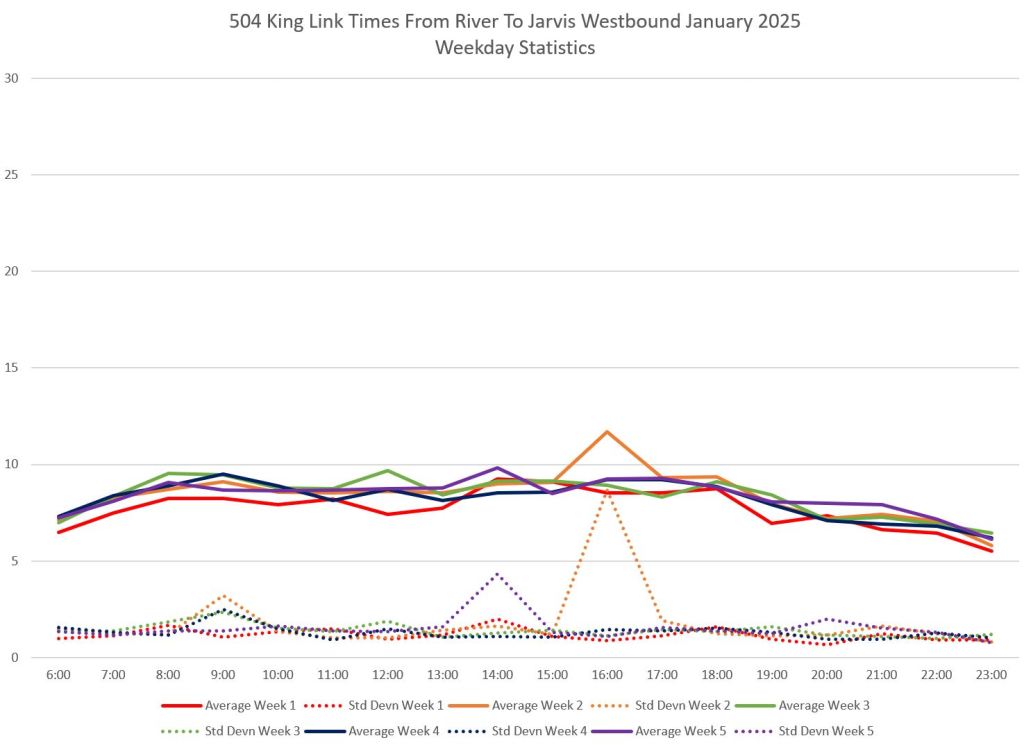
King East From Jarvis to River
Through service from Jarvis to the Don Bridge at the east end of King Street resumed in the third week of October 2024.
Travel times here are short and vary little as shown by the low values for the standard deviation (dotted lines). If there is anything that needs “fixing” here, it is the signals at Sumach Street by which streetcars and their riders are regularly held.


Ban the single-occupant, non-resident motor vehicle from downtown streetcar and bus routes. Ban on-street parking on streetcar and bus routes, build off-street garages behind new high-density buildings to compensate.
Would like to see “congestion fees”, but (Mayor) Doug Ford would veto that. Instead, impose a 30 km/h default speed limit across the city. Unless otherwise posted. For the safety of pedestrians, 30 km/h should be standard with street front shopping.
LikeLike
Might be worth noting that considering the general decrease in speeds across TTC surface system, maintaining 2016 performance is actually quite an achievement!
LikeLike
The King car can be faster going west if you get off before Young , walk up to University and get on 2 or 3 cars ahead , but you’re not allowed to do that on the same transfer .
Steve: You don’t know what you’re talking about. “Transfer”? The two hour fare on Presto means you can get off and on as much as you like. Also, you cannot out-walk cars from Yonge to University. Average travel time in January 2025 wa about 3.5 minutes peaking at 5 minutes around 5pm. It is 586m from Yonge to University and even the 5 minute time translates to 7km/h. The 3.5 minute time translates to 10km/h. Your walking speed would have to be superhuman.
LikeLike
I’ve been starting to wonder if maybe the whole transit mall is more of a pre-pandemic idea. With so much of downtown gummed up with traffic due to construction, it might make sense to throw pedestrians under the bus for a couple of years. Remove the on-street parking and bulb-outs on King. There should be one exclusive streetcar-only lane and one full traffic lane that allows drivers to go straight through or turn right only. This would help prioritize movement as much as possible while removing things that can block the streetcar like cars turning left or cars blocking the streetcar lane. Like the transit mall, it should be doable pretty cheaply with some red paint and the removal of the old transit mall barriers.
Steve: There are far more pedestrians than cars. Your priorities are clear. Unfortunately, the motorists and their cars will not fit under your bus.
The whole point of the bulb-outs is to provide a safer and faster boarding area for passengers who do get on and off a lot in this area.
LikeLike
The redesign of King can’t come soon enough. Every day I’m seeing streetcars moving slowly because there is a bicycle ahead trying to fit in the space between the sidewalk cafes / other furniture and the streetcar tracks. People biking need a continuous corridor that is between the streetcar platform and the sidewalk, and appropriately designed around sidewalk cafes. I don’t know if that would save a minute or several on each trip but it would help and the street would like much nicer.
Signal priority is also long overdue.
Better headway management will help trip times too, not just from more even loading but also from cars not needing to wait an extra light cycle due to an occupied stop.
LikeLike