
From time to time, a discussion arises about the makeup of the TTC’s surface fleet, how it is utilized and the effect on service levels. This article presents details broken down by vehicle type to show variations across the system.
My apologies to readers if this seems a tad nerdish, but any discussion of future service requires an understanding of the fleet’s makeup and how it is used. Any fundamental differences between vehicle types will affect future planning, but equally there are inherent differences in types of routes and schedule designs that have nothing to do with the vehicles.
The charts in this article are based on tracking data accumulated by Darwin O’Connor at TransSee for the months of November and December 2024, less a few days around Christmas when the site was offline.
First, a basic question about how many vehicles were actually active over the two-month period. The chart below shows the daily count of vehicles that were observed in service by the TTC’s tracking system and TransSee during the period.
The peak number of buses (blue) is higher than the peak service requirement shown on the Scheduled Service Summaries for these months. The difference is due both to “Run as Directed” buses which do not show up in the assigned vehicle counts, and to buses that only work for part of the day and are replaced by other vehicles for various reasons.
The situation for streetcars (red) is similar, but with a smaller difference because there are few “RAD” streetcars and most cars stay in service all day, as shown in the detailed stats later in the article. Another important difference for streetcars is that weekend service is close to weekday service in terms of the number of vehicles used.

The bus fleet is in flux as old vehicles are retired and replaced by new deliveries. If anything, this should increase availability by removing the least reliable vehicles from service. The streetcar fleet is growing with deliveries of new cars that will continue through 2025. Service levels for both modes have yet to catch up with fleet size and availability, although some improvements are planned later this year.
The remainder of this article looks at the stats for individual vehicles, grouped by type.
Active Fleet Size by Vehicle Type
The table below shows the various groups of vehicles ordered by motive power and model.
- Diesels: 1159 diesel buses were tracked during the two-month period. Note that none of these groups is officially in a retirement phase although some of them have passed their 12-year marks.
- Hybrids: 788 hybrids were tracked. Within this group, retirement of the Orion VII buses is in progress due to age.
- Battery electric: 56 vehicles were tracked. Large orders for these buses have just begun to arrive, and they will mainly replace the oldest buses in the fleet.
- In total, 2003 buses were active during the two-month period.
- Streetcars: 220 cars were tracked. An order for 60 new cars is in delivery to expand the fleet.
A key issue here is the timely delivery and reliability of the new battery bus fleet. These are intended to replace older hybrid and diesel buses, and their availability will affect the TTC’s ability to field service. Also unknown at this time is the overhead in vehicle requirements and service to allow for recharging vehicles. The effective replacement ratio with battery buses is not yet known.
(For the eagle-eyed fleet watchers, yes, the TTC is using the same numbers for new eBuses as are already allocated for subway trains and Metrolinx LRVs.)
| Vehicle Type | Fleet Numbers | Purchased | Observed | Total |
|---|---|---|---|---|
| LFS Diesel | 3100-3369 | 2018 | 268 of 270 | |
| 8400-8504 | 2015-17 | 105 of 105 | ||
| 8510-8617 | 2015-17 | 106 of 108 | ||
| 8620-8964 | 2017 | 341 of 345 | ||
| 9200-9239 | 2018 | 40 of 40 | ||
| LFS Diesel Artic | 9000-9152 | 2013-14 | 150 of 153 | |
| Orion VII NG Diesel | 8100-8219 | 2010 | 56 of 120 | |
| 8300-8396 | 2011-12 | 93 of 97 | ||
| Subtotal Diesels | 1159 of 1238 | |||
| Orion VII Hybrid | 1000-1149 (*) | 2006 | 25 of 150 | |
| Orion VII NG Hybrid | 1200-1423 (*) | 2007-08 | 145 of 224 | |
| 1500-1689 (*) | 2008 | 40 of 190 | ||
| LFS Hybrid | 3400-3654 | 2018 | 251 of 255 | |
| 7000-7133 | 2023-24 | 129 of 134 | ||
| Xcelsior XDE40 Hybrid | 7200-7333 | 2023-24 | 132 of 134 | |
| Xcelsior XDE60 Hybrid Artic | 9400-9467 | 2023-24 | 66 of 68 | |
| Subtotal Hybrids | 788 of 1155 | |||
| Xcelsior XE40 Battery (demo) | 3700-3724 | 2019-20 | 24 of 25 | |
| Catalyst BE40 Battery (demo) | 3725-3749 | 2019-20 | 13 of 25 | |
| BYD K9M Battery (demo) | 3750-3759 | 2019-20 | 10 of 10 | |
| Xcelsior XE40 Battery | 6000-6203 (**) | 2024- | 8 of 204 | |
| LFS SE+ Battery | 6600-6735 (**) | 2024- | 1 of 136 | |
| Subtotal Battery | 56 of 400 | |||
| Flexity Streetcars | 4400-4603 | 2012-19 | 196 of 204 | |
| 4604-4663 (**) | 2023- | 24 of 60 | ||
| Subtotal Streetcars | 220 of 264 |
How Many Days Were Vehicles In Service?
The points on the chart below show how many days each vehicle reported data to the tracking system. Many of them show a full count of 58, the highest possible value given that three days’ data are missing in the 61-day interval. These vehicles show lower mileage on some days, but if they were out of service for routine maintenance, it was only for brief periods.
The data points are graphed with three symbols:
- On the left, diamonds are used for diesel buses.
- In the middle, dots are used for hybrids.
- On the right, triangles are used for electric vehicles (battery buses and streetcars).

The change from diesels to hybrids occurs about half way across the chart showing the current status of the shift to hybrids and electrics.
Each type of vehicle has its own colour and they are ordered by type, not by fleet number sequence. Therefore, the lowest-numbered bus, 1000, a hybrid, lies in the middle of the chart among the few Orion VII Hybrids (yellow dots) that are still in service.
The battery buses lie to the right of the hybrids, and left of the streetcars (red triangles), and they generally show activity on fewer days than other buses. Note that vehicles with no activity are omitted.
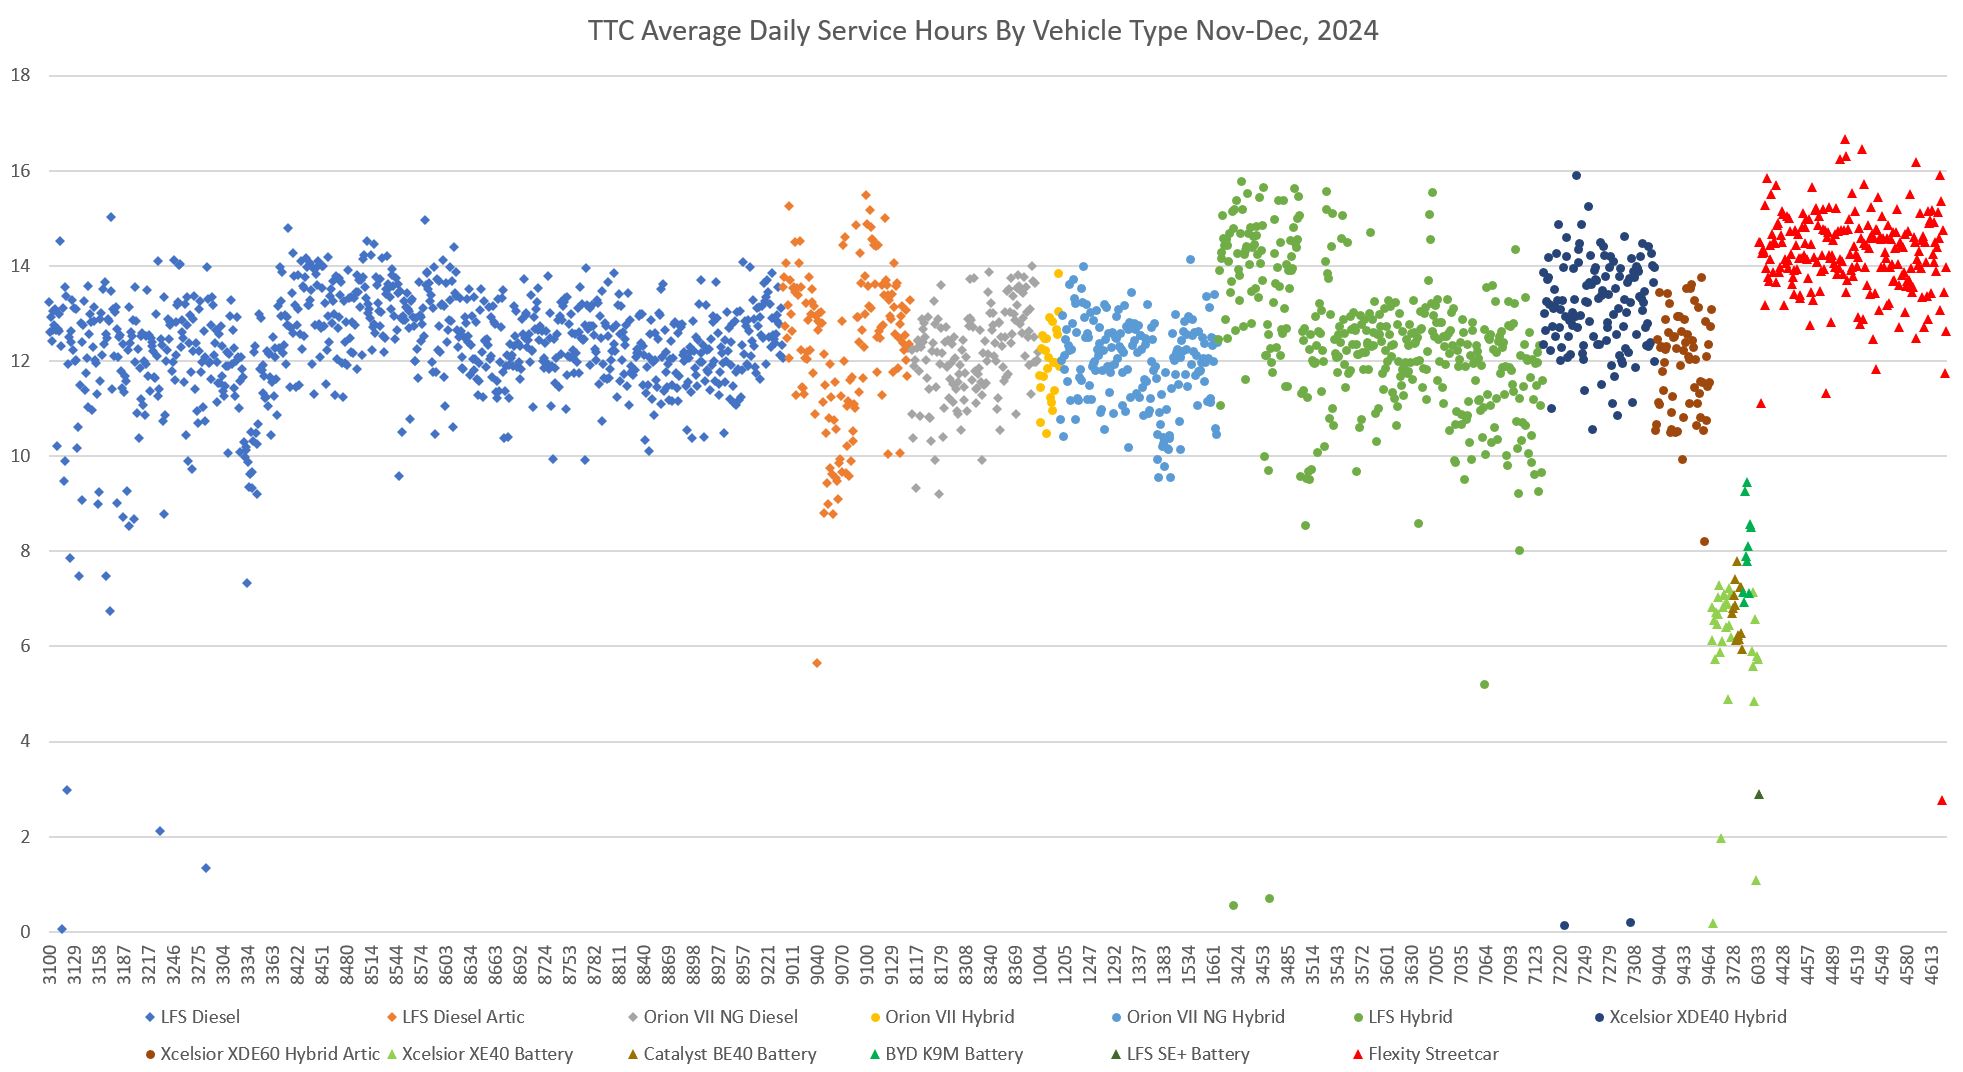
How Much Were Vehicles Used?
The following chart has the same format as the one above, but it shows the average hours of service per day. The values range from 10-16 with the streetcar fleet holding top position. This reflects the higher ratio of offpeak-to-peak service on the streetcar network where many vehicles are out all day, not just for peak periods.
The daily hours for the battery bus fleet are notably lower than for most other vehicles.
How Far Did Vehicles Travel?
The chart below shows the distance travelled by each vehicle. The values partly reflect different utilization rates, and partly the average speed of routes served by each garage. Streetcars are affected by the lower operating speed within their territory, and the battery buses by a combination of low service hours and the nature of routes to which they are assigned. There are a few buses with high mileages in the LFS Diesel group. These are the buses assigned to the Airport Express. (They also show up as outliers in the average speed chart below.)

How Fast Did Vehicles Travel?
The average daily speed of vehicles directly reflects the nature of routes served by each garage. Collections of vehicles with similar route characteristics have similar speeds over the two months.
Note that “speed” is calculated by dividing kilometres travelled by hours in service, including recovery time at terminals. Scheduled speeds excluding recovery are higher, but this varies from route to route.

This chart illustrates another aspect of the debate about measurement of service quantity using either vehicle hours or kilometres. The amount of service provided by a vehicle depends a lot on where it operates, and an hour of bus service on a fast suburban route is not the same as an hour on a slow city route.

is this a reliability issue or something else
– could it be a a reluctance to operate the battery bus fleet.
– or special training required to operate these that operators have not been provided with
– or just a reluctance by operators itself
or it’s just that there are so many buses, and they prefer to use the ones they are most comfortable driving?
Steve: Reliability, limits on range, difficulty of maintaining due to parts availability.
LikeLike
I suppose I’m not the only one who will be writing this. There are some non existing units just don’t exist.
The 8400-8617 range lumped together in the service summary includes 2 batches 8400-8504 and 8510-8617 totalling 213 buses in which one has officially retired in a collision (8573) leaving 212 active units.
Also the Nova articulated bus 9003 has officially retired leaving 152 units that can be in service in the best cases I’m not sure if it’s fair to say the unit is missing since it has prematurely retired and will never see service again.
Steve: Yes, I know there are gaps from retirements and other various reasons. My main purpose is to illustrate how many vehicles were active over November-December 2024, and their typical operating conditions. I will fix the table to distinguish between the two number ranges. Thanks for catching this.
BTW bus 8519 in that series also did not record any mileage during the period.
LikeLike
It would be interesting to note the change in how much more/less they use the artics with most of them (disappointingly) gone from McNicoll since 939 went back to standard buses on Jan 5. This board 927 uses artics on weekday daytime runs and it seems 41 is using them all to the time (to use the new artics that were sent back from?) I wonder if the 927 or 935 will be converted soon since 939 and those select 36 runs aren’t using them.
LikeLike
The Chinese giant BYD is the only manufacturer 100% of whose buses are still working. It is no surprise then that BYD is the world’s largest manufacturer of electric vehicles.
Steve: Flyer has 24 out of 25 active in that two-month period which I would hardly flag as a major failing versus 10 out of 10 for BYD. Also, the BYD fleet is small because they could not deliver vehicles, and there have been problems with getting spare parts.
LikeLike
The buses in Scarborough are normally empty and service levels are too frequent. Cuts are in order.
Steve: That does not line up with the loading data the buses report from automatic passenger counters, and experiences reported by riders.
LikeLike
Detroit in the USA is buying 40+ years old retired SRT trains to build a modern fifth generation transit system while the former SRT infrastructure is being retrofitted to house a modern 6th generation BRT system to serve Toronto’s largest borough, Scarborough. I heard that this BRT is delayed and won’t open until about a year after the Scarborough subway extension.
Steve: The cars going to Detroit are for spare parts which Detroit cannot otherwise obtain, not to expand the system. Also the demand on the Detroit system is much lower than the SRT and there is less wear and tear on their cars.
The BRT is expected to be operational in 2027. That is much later than it should have been, and the delay is thanks to foot dragging by the TTC. The subway extension will not open until at least 2030.
LikeLike
Steve, can you do an article on the slowdown that ATC has caused on Line 1?
Trains crawl and limp into stations and accelerate at a snail’s pace, doors have a noticeable delay in opening/closing, trains are limited to 75 KM/H when it was 80 before ATC compared to the human operators (even before the slow zones).
Line 2 now feels like a rocket compared to Line 1, and line 1 probably has an average speed on par with Line 2 now.
ATC has definitely caused an increase in travel times on Line 1, and its hilarious how ATC is worse than human operators…
What happened to the supposed benefits of ATC that the Toronto public endured years of weekend closures for?
Steve: I think that the problem is not ATC, but management decisions about how trains are run. There is the question of general track condition that is probably related to running at a lower top speed. The spec for the new trains includes 55mph capability with 50mph as the service running speed. I know that the original intent was to run the trains faster and closer together once ATC was in place, but a combination of the pandemic and a lot of bad decisions under Leary and his crew have not left things in good shape.
LikeLiked by 1 person
@James:
IIRC the SRT was shut down early because a reaction rail ripped its mounting bolts out of the concrete base. The entire reaction rail would probably have to be remounted which would have cost a lot of money and delays.
Steve: Yes. Inspection revealed that similar problems existed at several other points on the route. Just fixing the problem area where the train derailed would have left an unsafe operation. Complete replacement would have been required.
LikeLiked by 1 person
Regarding “ATC’s” comment on various performance issues allegedly caused by ATC – the frustration is misplaced.
While ATC is the last link in the chain in constraining performance such as acceleration, speed limits, station approach, and so-on, the performance specifications are decided by the TTC. As for whom at the TTC decides this, perhaps Steve could enlighten us.
Generally speaking, ATC as a technology should (and likely is, in Line 1’s case) be robust enough to perform close to the operating limits of the trains themselves in most circumstances.
Acceleration and braking performance is dictated by the customer. Assuming ATC is capable of meeting stopping accuracy performance at much higher acceleration/deceleration rates (which it should), then the TTC has likely requested lower acceleration and braking rates to reduce component wear and power draw.
Furthermore, ATC should have few problems working at low speeds. The “crawling” and “limping” into stations occurs when the headways between trains is not large enough, assuming an RSZ is not present. This demonstrates both the benefits of ATC and the TTC’s poor line management.
Whereas in the past trains would sit at a signal until the next block would be free, now trains will continue moving up the line until their minimum spacing is reached. In fact, this reduces travel times as, it eliminates the unnecessary headway that is produced while a train exits a block in a “fixed-block” system. However, these train backlogs are a result of delays or poorly managed headways – proper management of which is the TTC’s responsibility and not a symptom of poor ATC performance.
Lastly, regarding slow door opening, this could be a result of OPTO. OPTO requires trains to establish a connection to cameras in the station so that the operator can receive a video feed for the whole platform. Whether a door opening delay is caused by lengthy connection times or due to the operator themselves is unclear, but perhaps Steve could investigate this.
LikeLiked by 1 person
Increase the average speed of each vehicle even by just a few mph and riders and traffic will be happier and unions and management will be upset for obvious reasons. Keep it all moving.
Steve: Stay tuned for an article about comparative speeds of major routes over the past decade.
LikeLiked by 1 person
I’ve seen express buses engine brake just to slowly come to a halt on the last 10 seconds on the countdown, while a dozen vehicles passed by the bus before the light turned yellow.
And on major connecting routes, buses comes in triplets and quadruplets, and the next bus is slowly arriving in 25 minutes.
LikeLiked by 1 person
Steve: Stay tuned for an article about comparative speeds of major routes over the past decade.
——————————————————————————
SPOILER SPOILER SPOILER SPOILER SPOILER SPOILER SPOILER SPOILER
They have slowed down.
SPOILER SPOILER SPOILER SPOILER SPOILER SPOILER SPOILER SPOILER
——————————————————————————
Steve: [feigns innocence] No, tell me it isn’t so!
LikeLiked by 2 people
I spent 6 months in the Delhi National Capital Region area in India. They have a vast metro network (Delhi Metro + Noida Metro + Gurgaon Metro + Delhi-Meerut RRTS + Meerut Metro), an interconnected network of over 500 km and a daily ridership of over 7 millions. The system is run very efficiently. I didn’t experience even a single delay in my 6 months. There are no slow trains orders, the doors function just fine, platform access doors are there, some lines are run perfectly with driverless trains, everything is so amazingly clean; why can’t the TTC do the same? The TTC should send a delegation to New Delhi to see how things are run so smoothly and efficiently over there.
Steve: There was a time when the TTC could lay claim to being among the best transit systems around, certainly by comparison within North America, but they dined out on that self-image for decades. Now that Toronto has a large number of residents who have actually seen transit systems elsewhere, and know what is possible, TTC practices don’t look quite so good.
Over 40 years ago, during the fight to get monthly passes, the TTC used the classic “it will never work here”. The Hamilton, lowly down-at-the-end-of-the-lake Hamilton, got monthly passes, and the TTC was forced to implement them. “Policy” analysis has been like that for decades, and the pols are willing to accept substandard performance.
LikeLike
I must add comment on what DavidL_Engineer posted about “ATC’s” post. He said:
I love the “slow” door opening on Line 1 trains! The trains all stop with one final jerky bump that could throw someone elderly like me to the floor, so I remain seated until complete stop. Then, I have plenty of time to get up & go the door.
Steve: The delay before the door opening existed before OPTO and the handshake with the station monitoring gear. It’s how the trains were designed to operate, and has nothing to do with ATC per se, rather with the policy of implementation.
I must remind readers that “acceleration and braking performance” is nowhere important to the passenger as is their safe comfort. Lurching, jerking and swaying are to be avoided. A few weeks ago I squeezed into a northbound Yonge train at about 6:15 pm. It was a crush. I had nowhere to hold on to. The train made quite a lurch leaving the station and I fell over, knocking over a person standing next to me, who in turn knocked down a third and fourth person – like dominos. I was immediately offered a seat! The train lurched out of every single station along the way and made extra-jerky stops entering stations. Was that ATC?
Steve: The spec for the new trains has acceleration and braking tables in it that are supposed to match existing TRs. As for jerky operation on Yonge, I suspect you were in a slow zone, and possibly the train was being driven manually.
LikeLiked by 1 person
Let’s buy new high-tech trains from the China Railway Rolling Stock Corporation Limited (CRRC) while Bombardier/Alstom is still trying to figure out how to open and close doors.
LikeLike
You don’t have to go to New Delhi to witness efficient operation and thoughtful details. Just take the train a few hours east to Montréal.
The Métro doors open briskly and are fully open when the train actually stops. The new(ish) Azure rolling stock has a posh interior design, that makes Toronto’s TR interior look like slightly upmarket Ikea stainless steel wastebasket with a nice hygenic plastic lining. Multiple screens along the platform show actual train arrival times and the approximate loading of each car in the approaching train. There is, as far as I could see, someone in a booth at each station. A variety of fare options are offered, from single trip to passes of varying duration and system coverage.
As a clueless tourist wandering somewhat randomly about, I appreciated that bus stop signage includes not just the route but also the Métro station the route is heading to.
None of these are rocket science. The TTC Commissioners should take a little field trip and see what can be done.
Certainly there are negatives. Métro accessibility is sketchy to non-existent, and the basic design of the stations will make this very difficult to fix. I witnessed a bus driver being very reluctant to even kneel the bus for someone with apparent mobility issues; I [wonder] how that operator would feel about deploying a ramp. But there are definitely good things that Toronto would do well to learn and adopt.
LikeLiked by 2 people
Melbourne Australia had complaints about their “slow” trams (AKA streetcars). Turns out their trams were not the “slowest” in the world. Toronto has the distinction of being the “slowest” in the world.
Melborne’s most recent average of 15.5 km/h is far better than Toronto’s at 10.7km/h.
See this article from August 29, 2024.
Steve: Coming soon, an article on changes in travel times on buses and streetcars. The lion’s share of extra time over recent years has gone to terminal recovery time, not to driving time.
LikeLike
TTC has a unique gauge, otherwise we would have been able to buy second hand vehicles for cheap. India also has a unique gauge (broad gauge which is the widest gauge in use in railway history) but India is a manufacturing powerhouse able to manufacture to whatever gauge requirements. May be the TTC should convert to standard gauge.
Steve: The gauge is immaterial, and vehicles are regauged commonly. TTC bought used PCCs from other cities (Cincinnati 52, Cleveland 75, Birmingham 48, Kansas City 30) and converted them to TTC gauge in the 1950s. Some of these were sold by the TTC after retirement and changed back to standard gauge.
This is a non-issue. Converting to standard gauge would require the entire system to be rebuilt, a huge upheaval that could not be justified.
LikeLike
The grass is always greener …
LikeLike
Because it is. In 2014, Kathleen Wynne promised to electrify the GO transit and UPX (a mere couple of hundred kilometres of tracks) but not a single kilometre has been electrified and it has been 11 years already. In contrast, India has nearly 100% electrified its vast railway network.
In 2015, Justin Trudeau promised a high speed rail connection between Toronto and Montreal. It’s 2025 now and where is it? In contrast, the high speed bullet train connection between Mumbai and Ahmedabad in India (similar distance as that between Toronto and Montreal) is nearing completion.
My point is this: if we want Canada to remain prosperous, then we need to start building world class infrastructure like India and China instead of empty promises as mentioned above.
Steve: There is a fundamental problem here, and it does not matter which party is in power. Projects like this are expensive, and governments don’t want to commit the funds to build them. There is a belief that somehow the private sector will come along with bags of money to “invest” thereby getting something for nothing. This infects just about everything Metrolinx does, and a huge bill will come due when all those “partnerships” start actual operations and send bills to recover their costs. As for the Feds, again there is an idea that a private investor will build the Toronto-Montreal corridor line. The plan gets warped by the need to touch more towns along the way for political support.
In both cases, the work is seen as an investment tool, job creation scheme, and a way to give work to the government’s friends, notably consultants. The idea of actually moving people and the economic benefit that brings is secondary.
UPX started out as a Federal proposal, but they dropped it because it didn’t make economic sense. McGuinty picked up the ball, but Ontario has fumbled it ever since including trying to save money with poorly designed infrastructure especially at Pearson.
I would modify your conclusion simply be saying “we need to start building” rather than making empty promises. I will give Doug Ford credit for actually starting projects, but even these have a lot of political pork, project management cock-ups, and very long lead times.
LikeLike