
This article reviews the quality of service and crowding on the 129 McCowan North bus in September and October of 2024.
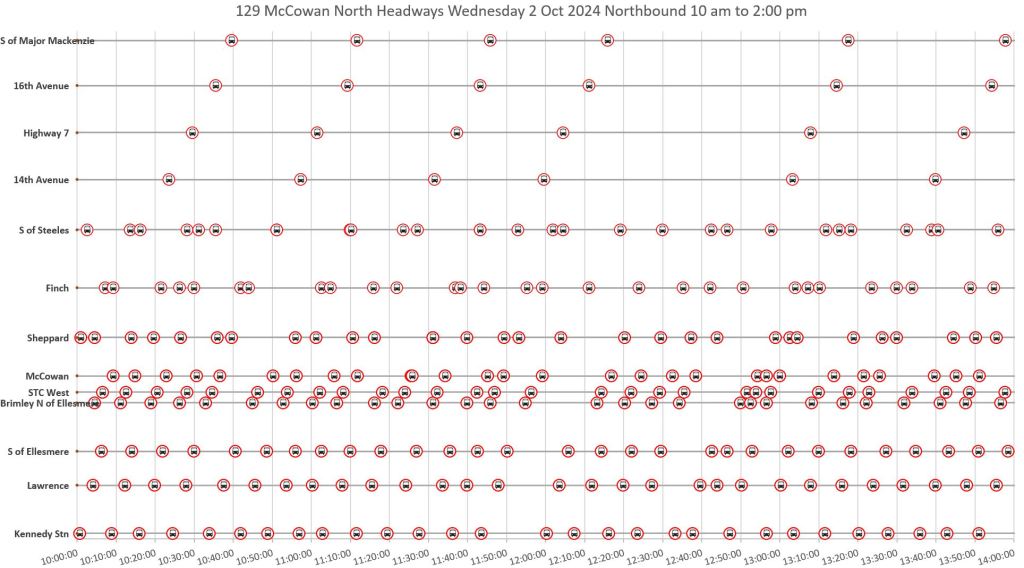
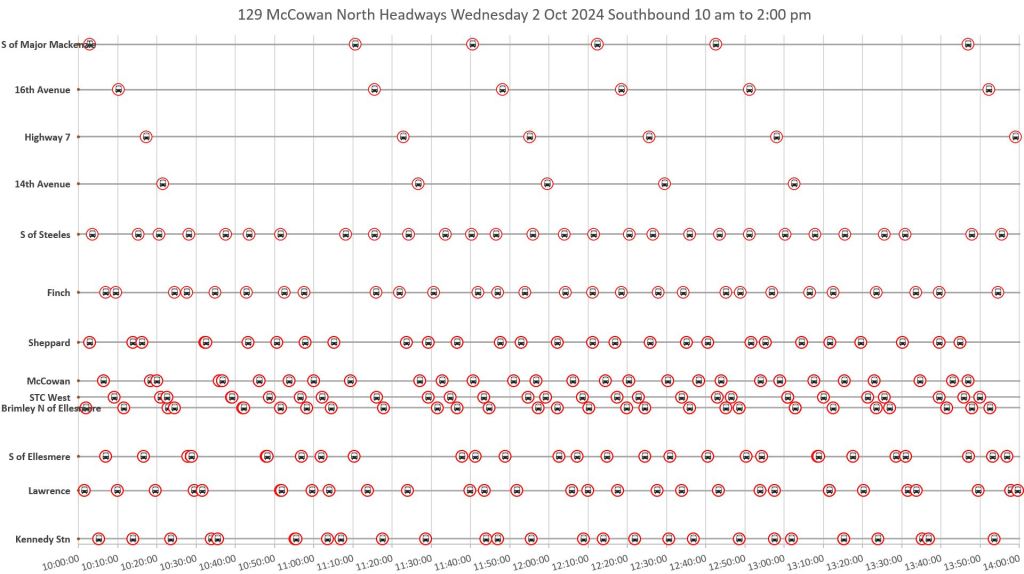
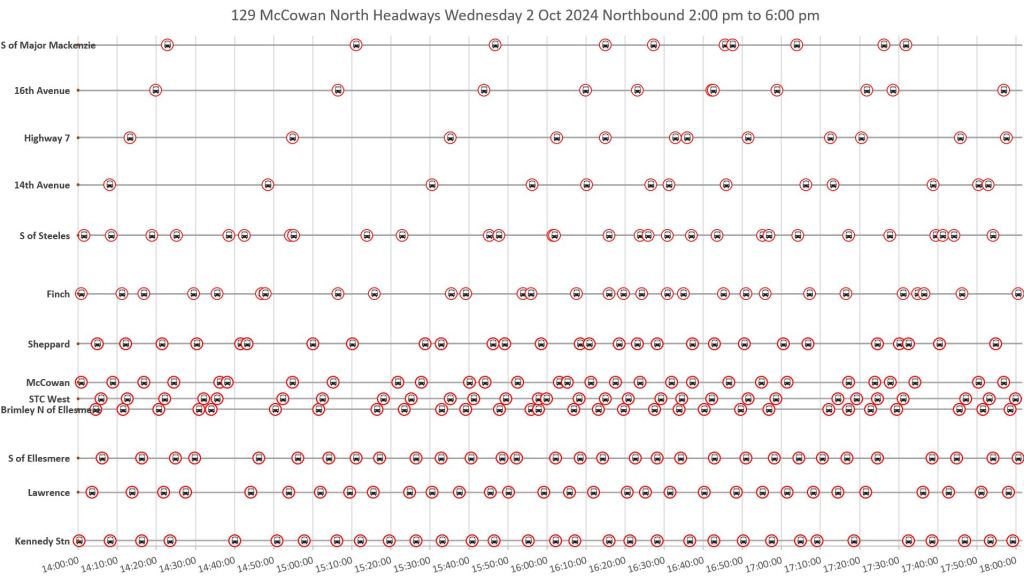
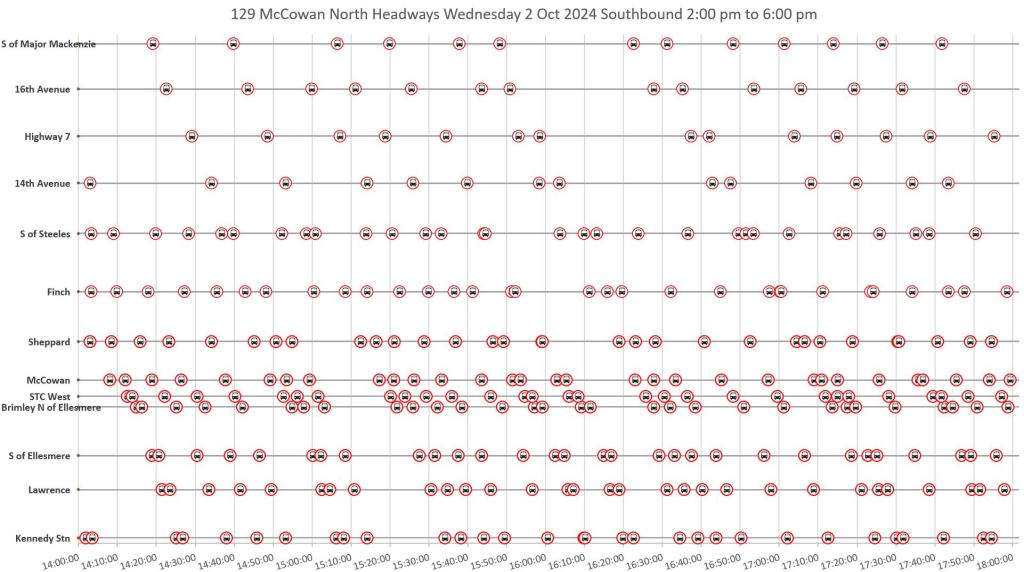
Updated Nov . 18/24 at 5:00 pm: Bus spacing charts were omitted in the original posts, and they have been added. Also, crowding and spacing charts have been added for Wednesday, October 2 as an example of route behaviour before the October 6 schedule change.
Summary
This route has two branches:
- 129A operates north of Steeles under contract to York Region to Major Mackenzie Drive.
- 129B operates to Steeles Avenue.
In the September schedules, much of the 129A service was provided as an “every nth” through bus on the Steeles service. This changed on October 6 so that the 129A and 129B services operate independently, and the 129B service changed from regular-sized to articulated buses. Service in peak periods is scheduled to be uneven even if it is “on time” by TTC standards.
With a combination of bus sizes and uneven headways, the effect on crowding can be severe if a smaller bus is travelling on a headway designed for a larger one.
Details of the scheduled service are in the main part of the article.
Construction at Sheppard severely affected travel times for much of the last two weeks in October. In turn, there was more bunching and gaps, and headway reliability declined considerably.
The segment of the route where bus crowding is most reported lies between STC and Steeles, and extends into York Region.
Service leaving Kennedy Station northbound shows a small range of headways only with the September schedule which had regular departure intervals. From week 2 of October onward, and compounded by effects of construction, headway reliability at Kennedy Station was poor. The situation was worse further north on the route. Southbound services merging at Steeles did not do so on a controlled basis even though the schedule purports a “blended” service.
Service north of Steeles can be quite erratic northbound. Southbound service benefits from recovery time at the Major Mackenzie terminus, but can still be uneven.
The remainder of this article contains many charts for readers who like the detailed analysis.
Scheduled Service
The 129B Steeles service operates with articulated buses effective October 6, and the combined service is less frequent than in September.
During peak periods the headways do not blend evenly. In the AM peak there is a 129A every 15 minutes, and a 129B every 30 minutes. This is shown on the schedule summary as a combined 10 minute service, but the actual pattern is a 129A every 15 minutes, with a 129B in between every other pair of 129As.
This produces headways of 8-7-15-8-7-15 minutes over the course of an hour. There are six buses/hour with an average headway of 10 minutes, but that is not what riders see if the route is “on time”. Similarly, the PM peak pattern is 7-7-14-7-7-14 minutes. The service is scheduled to be uneven.

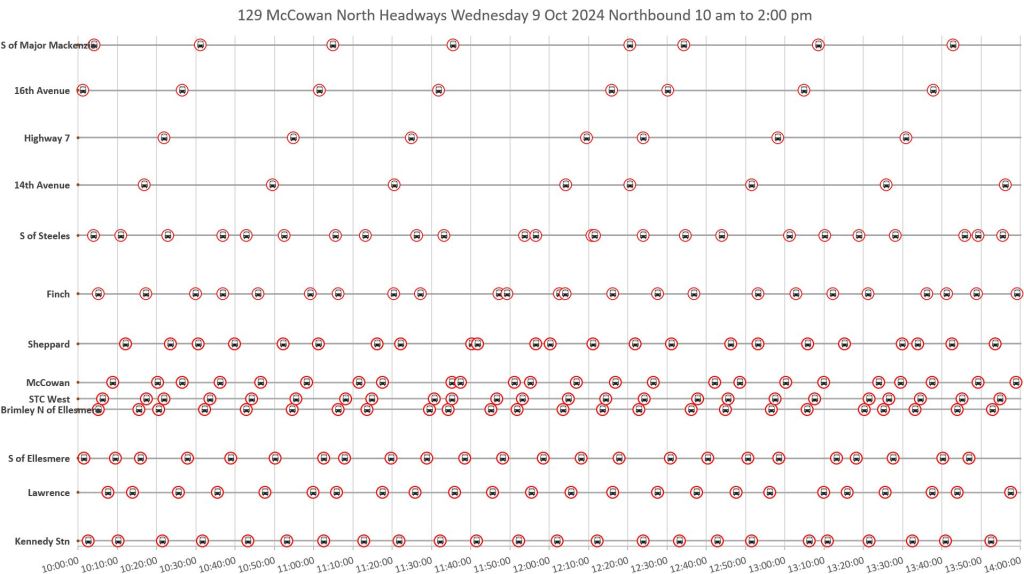
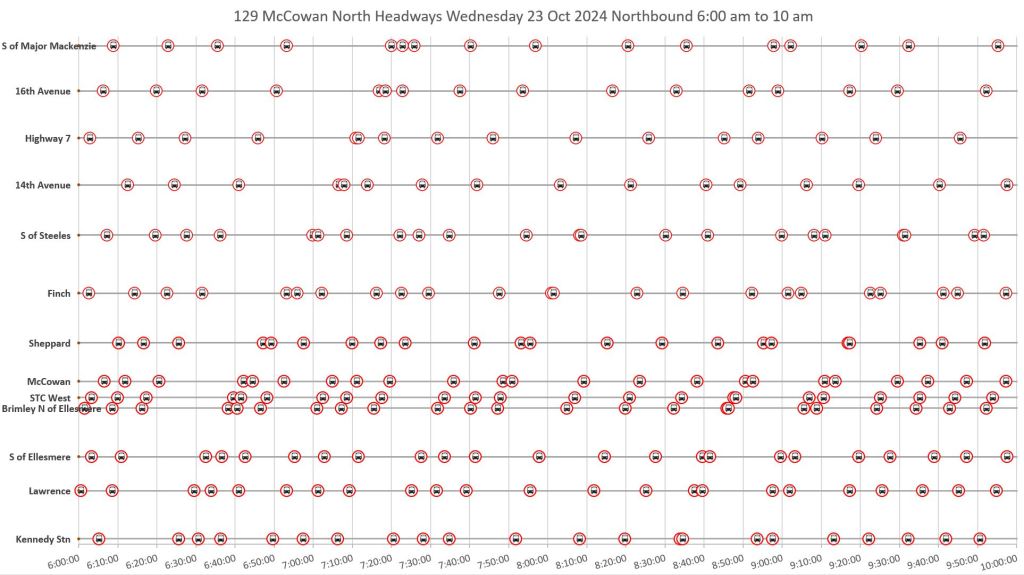
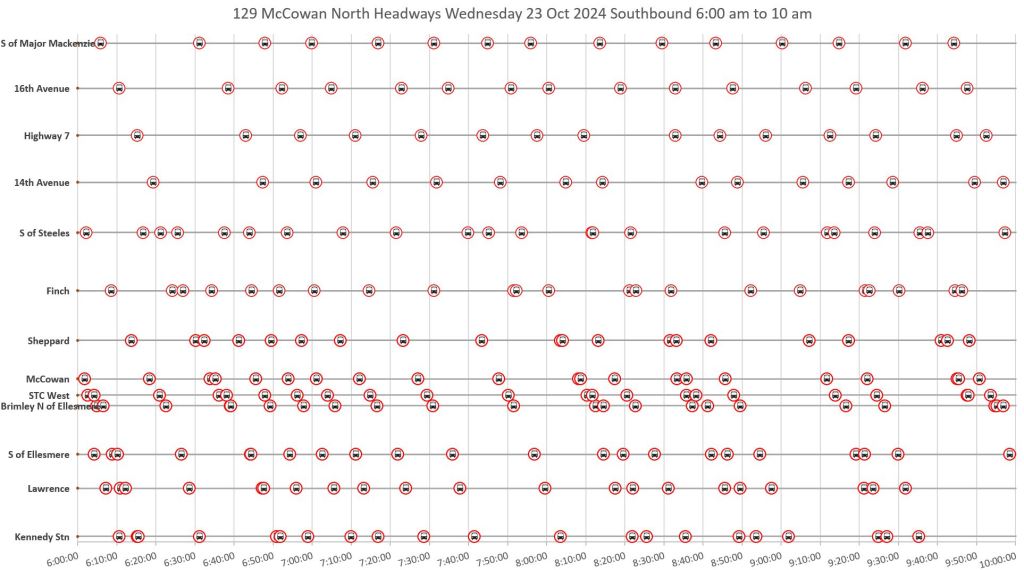
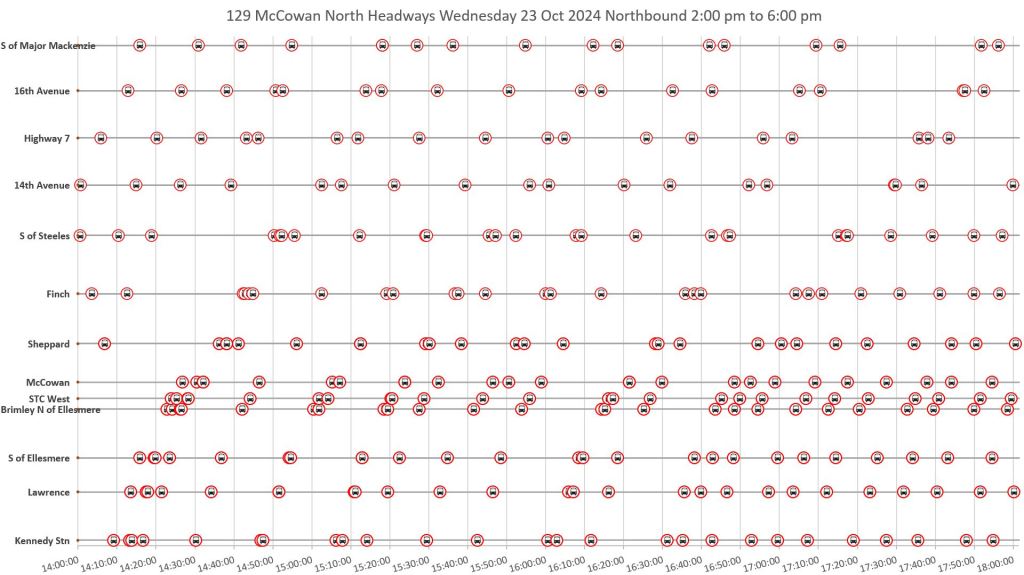
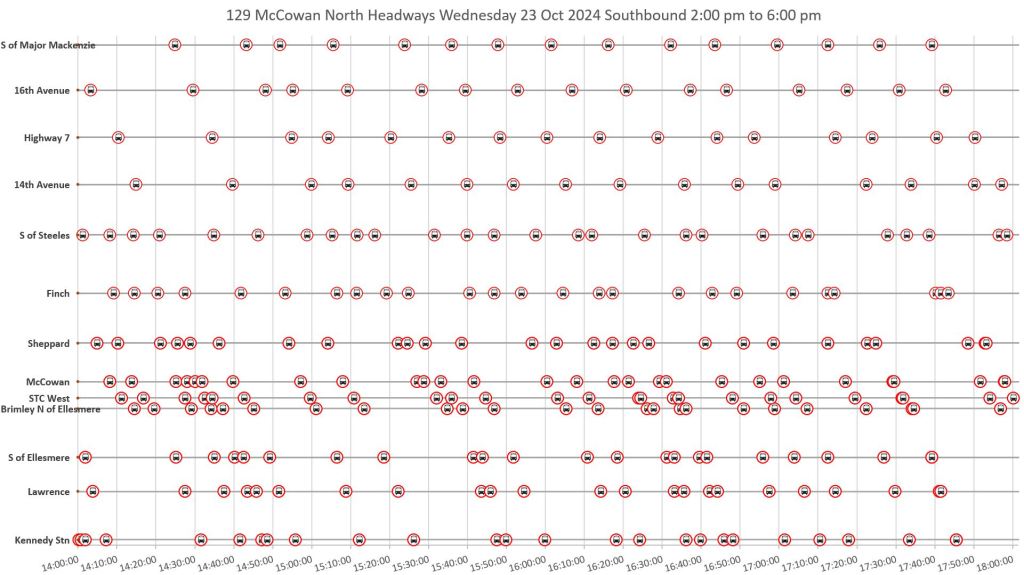
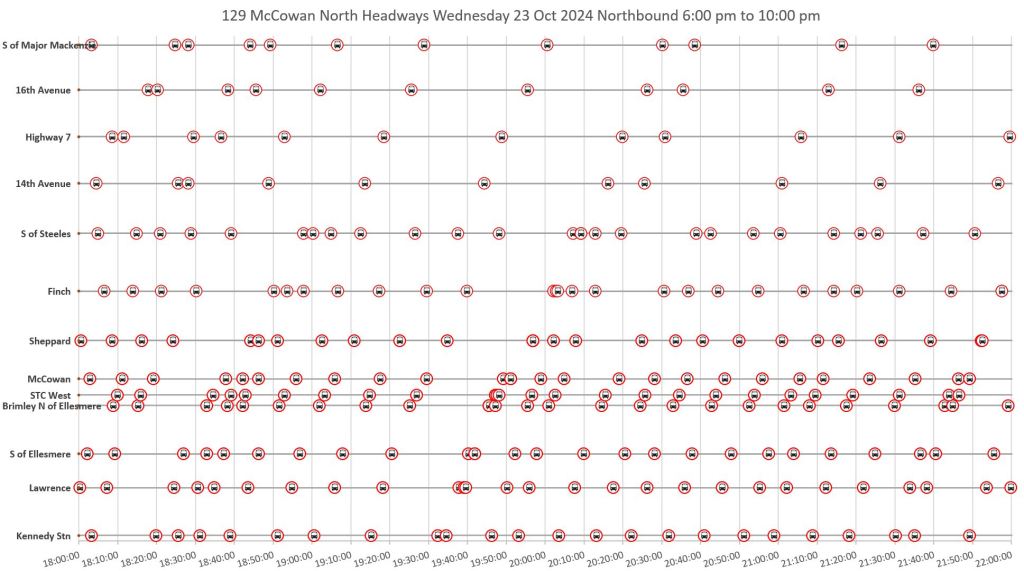
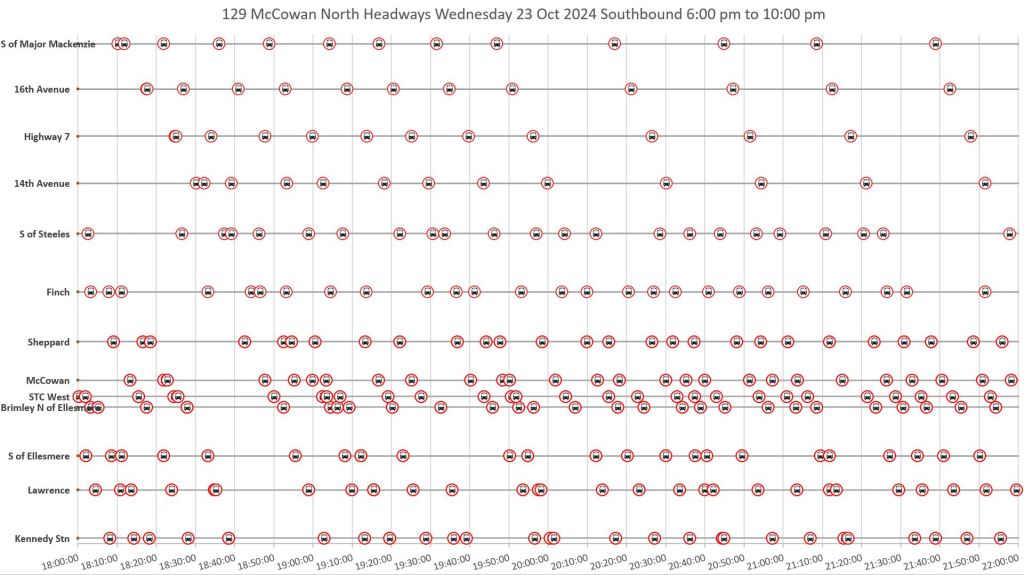
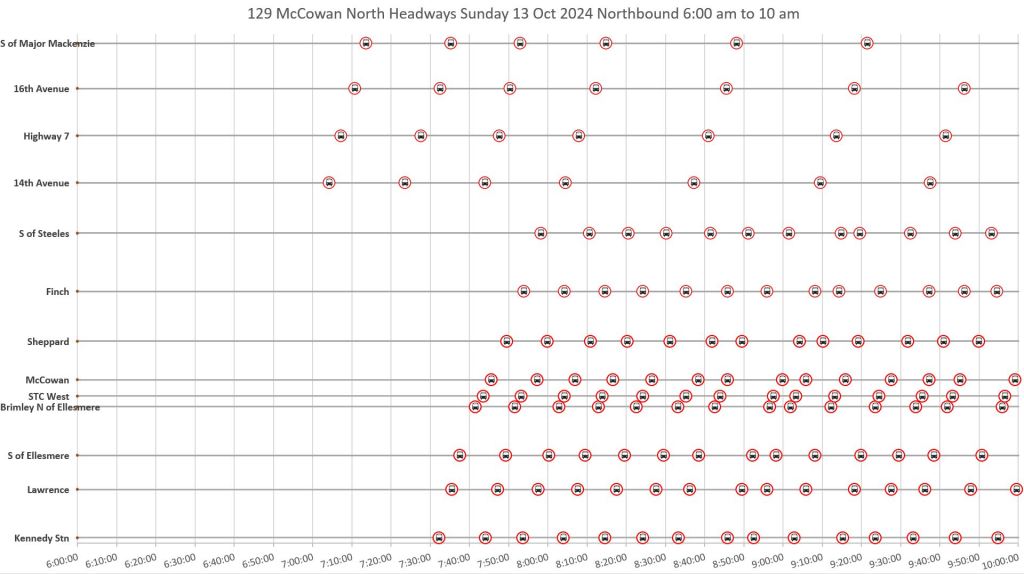
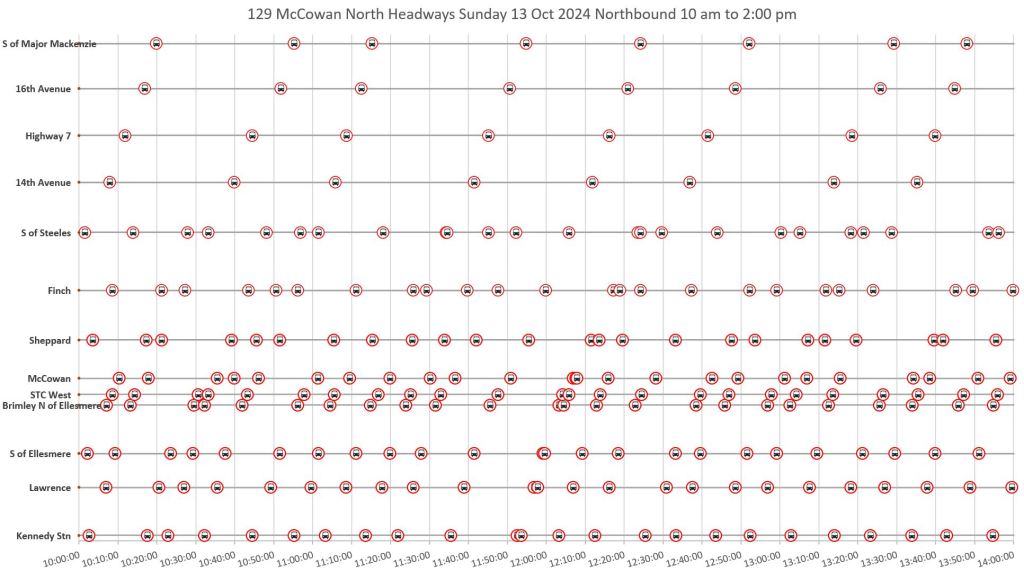
Headway Reliability
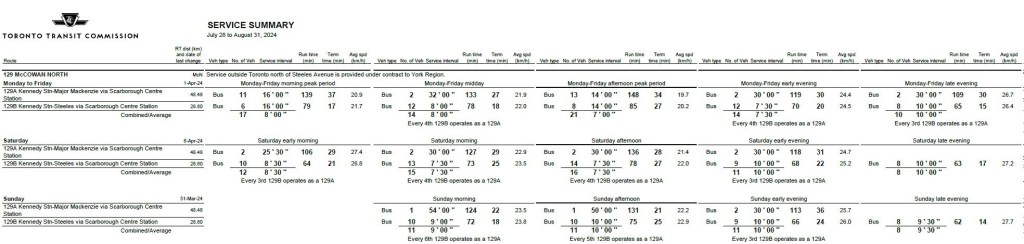
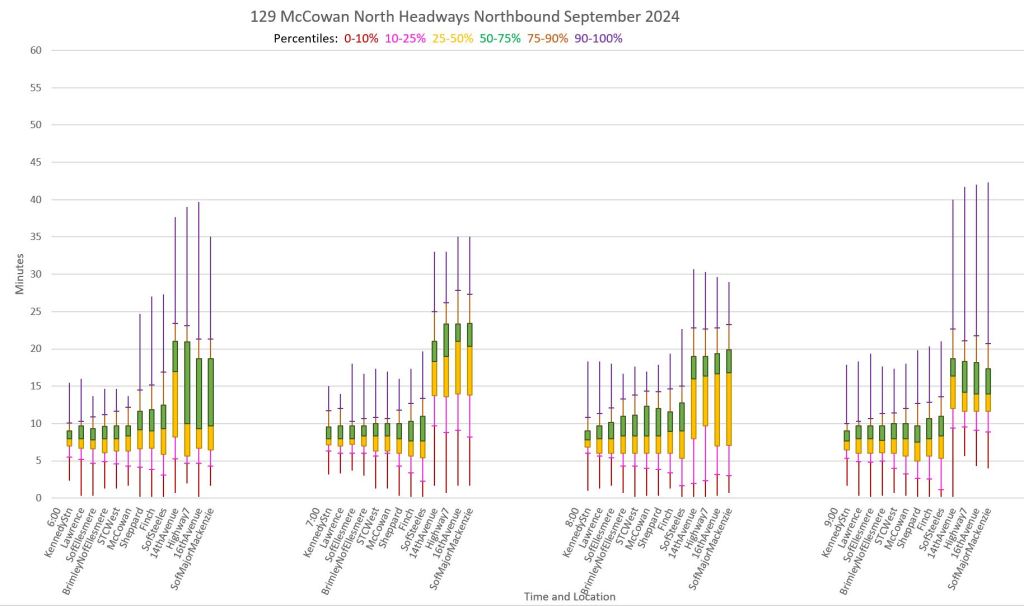
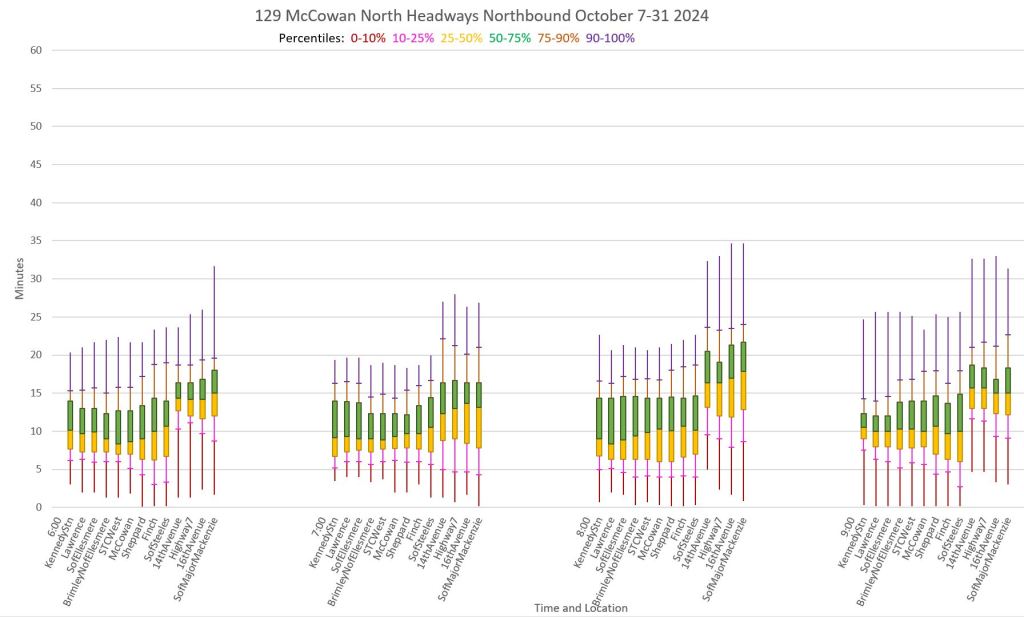
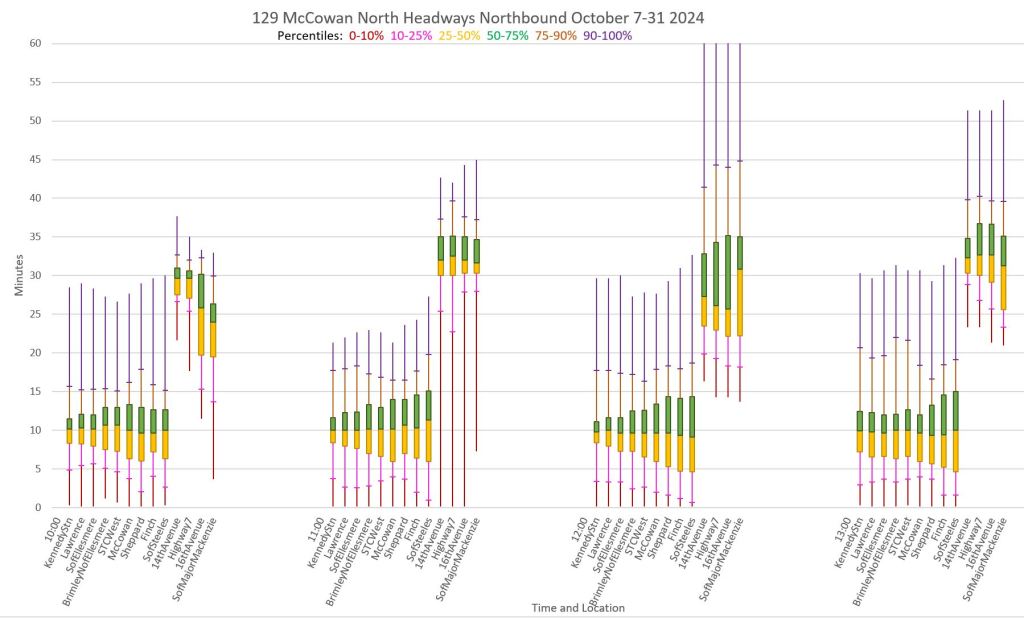
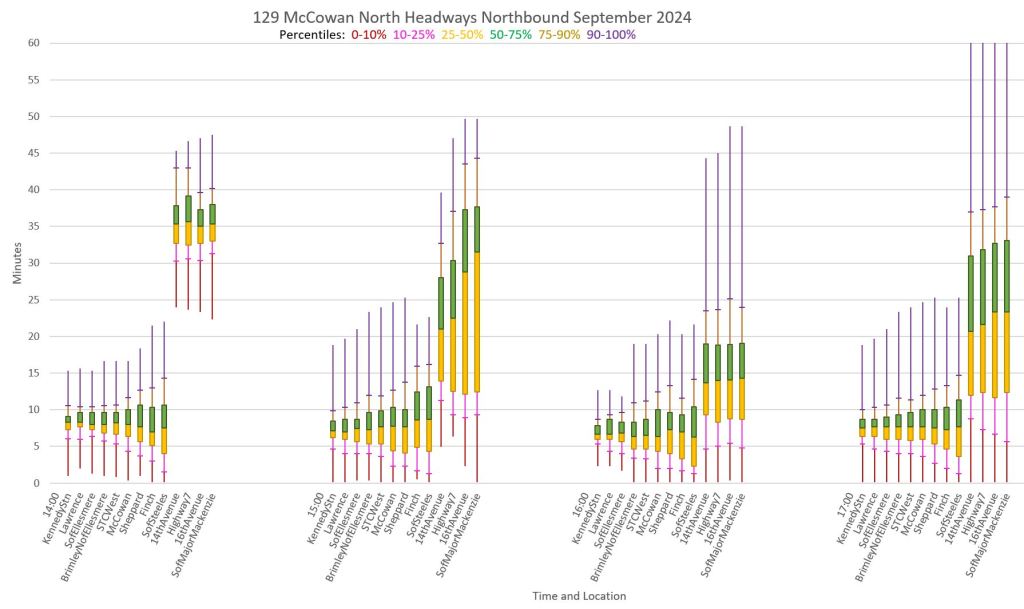
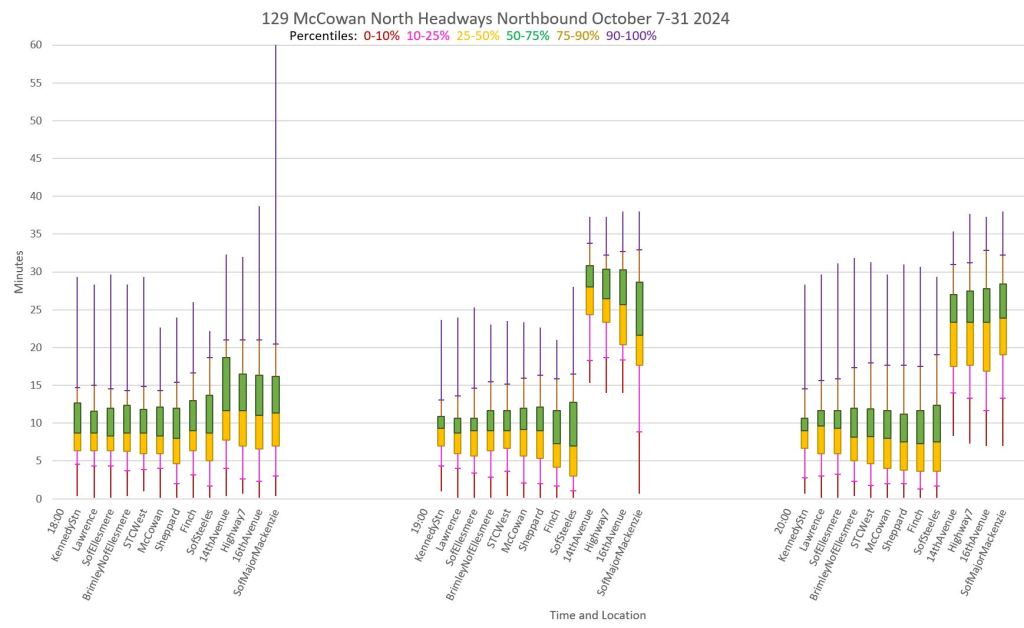
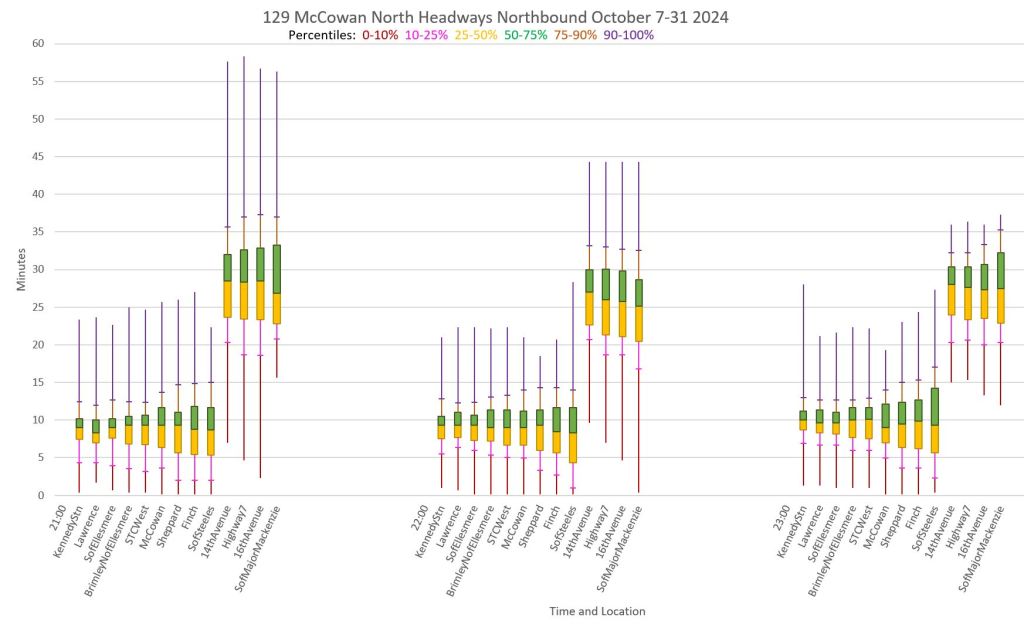
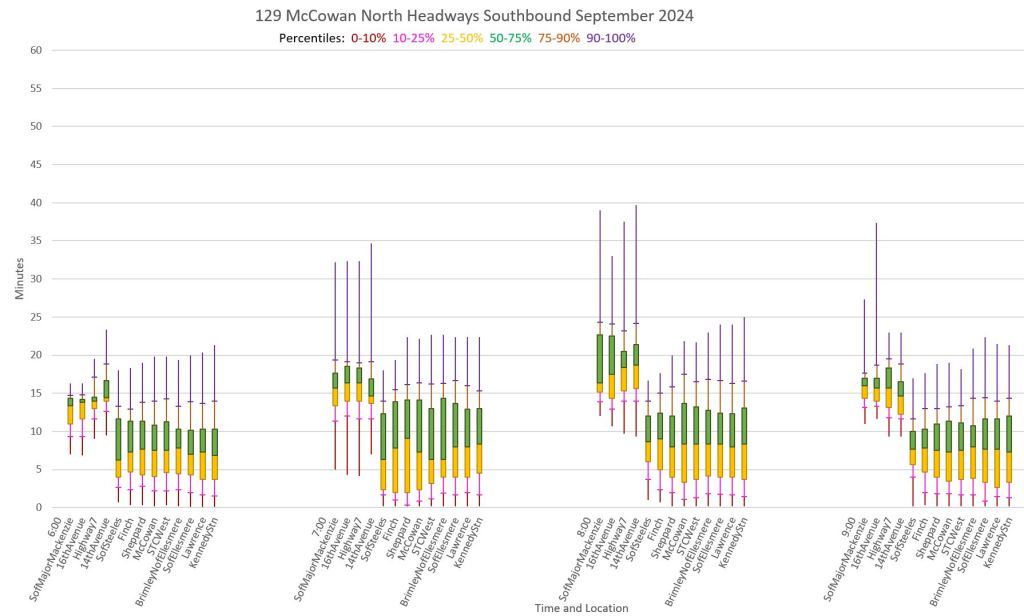
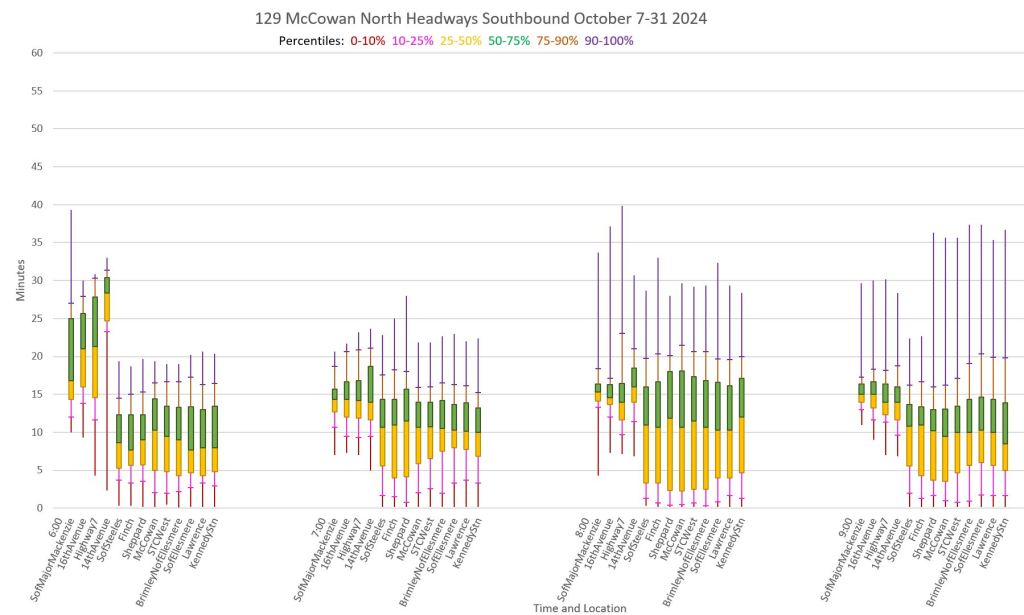
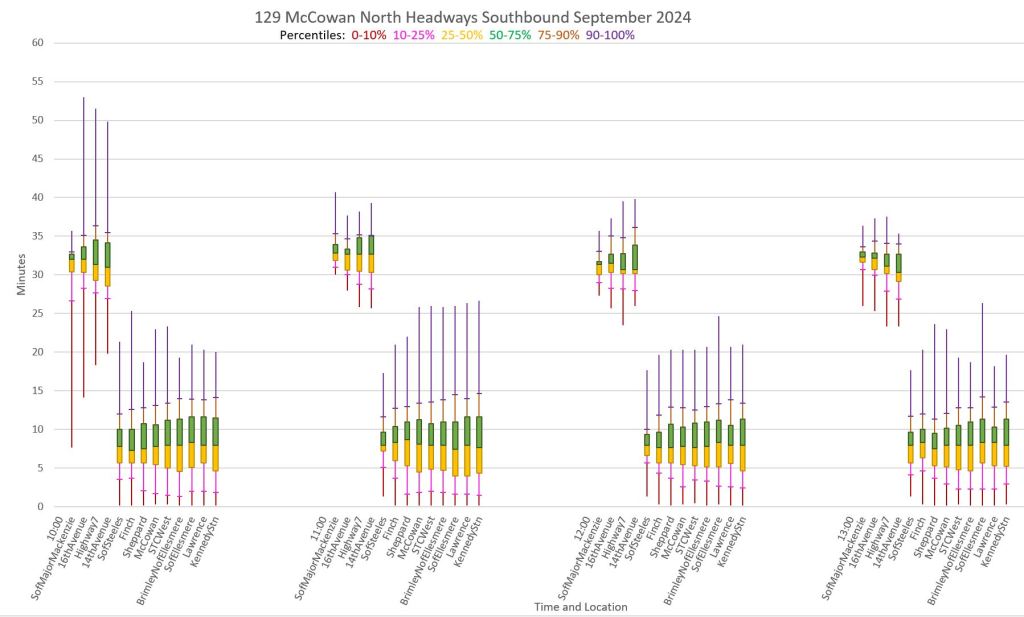
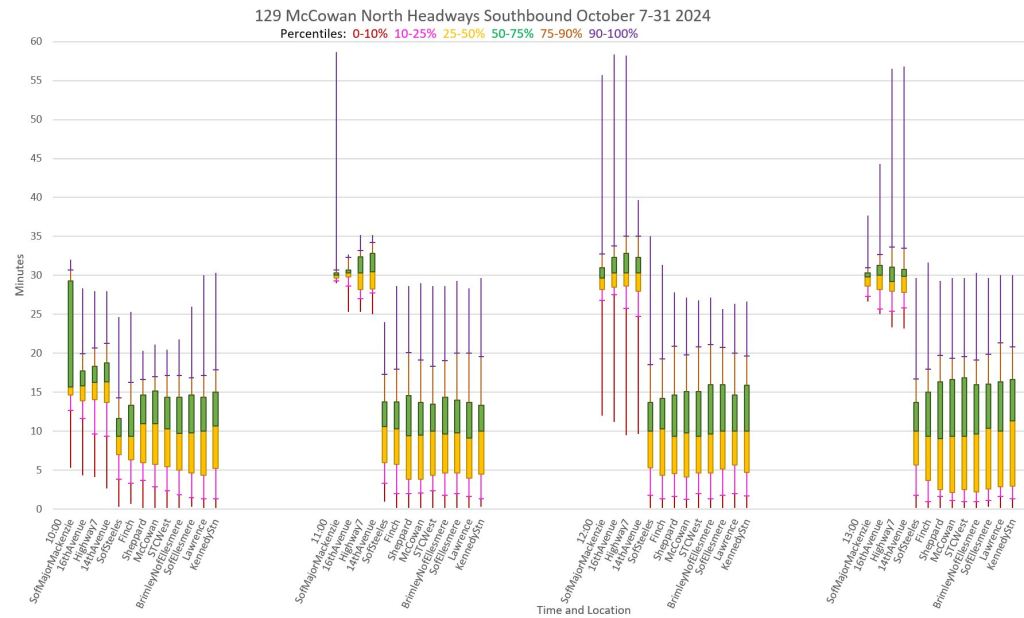
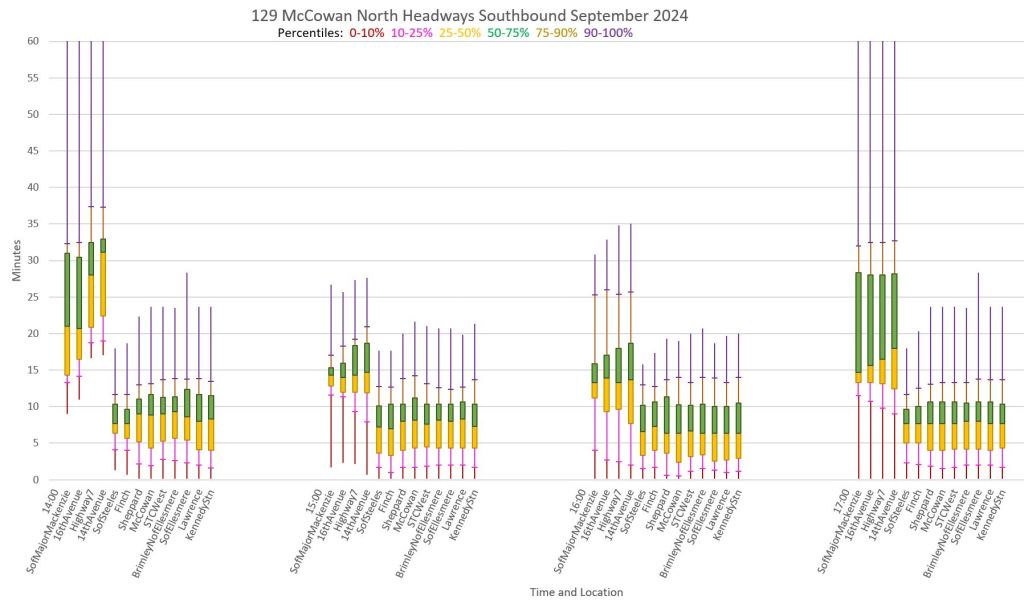
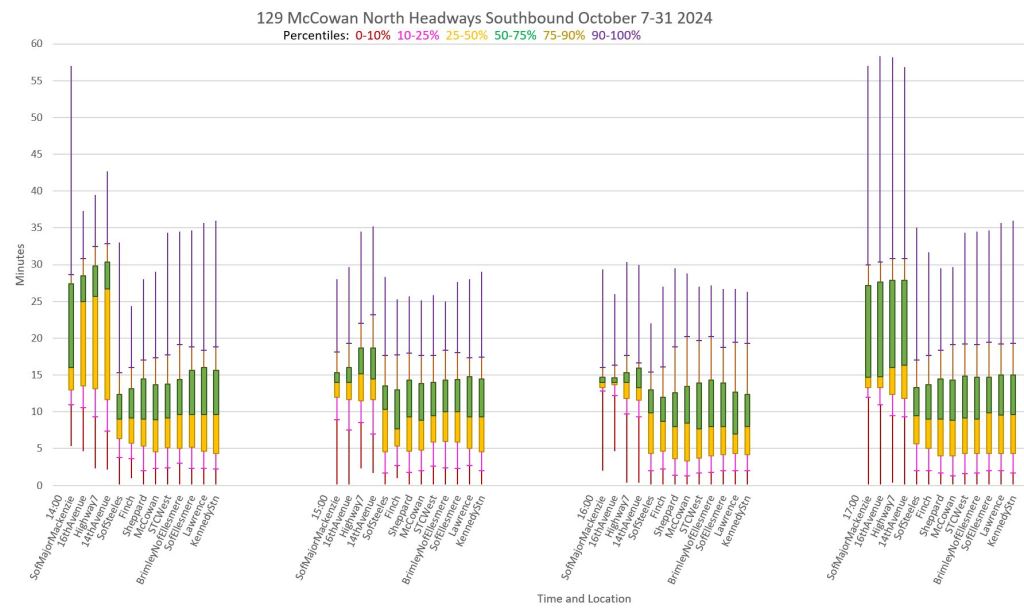
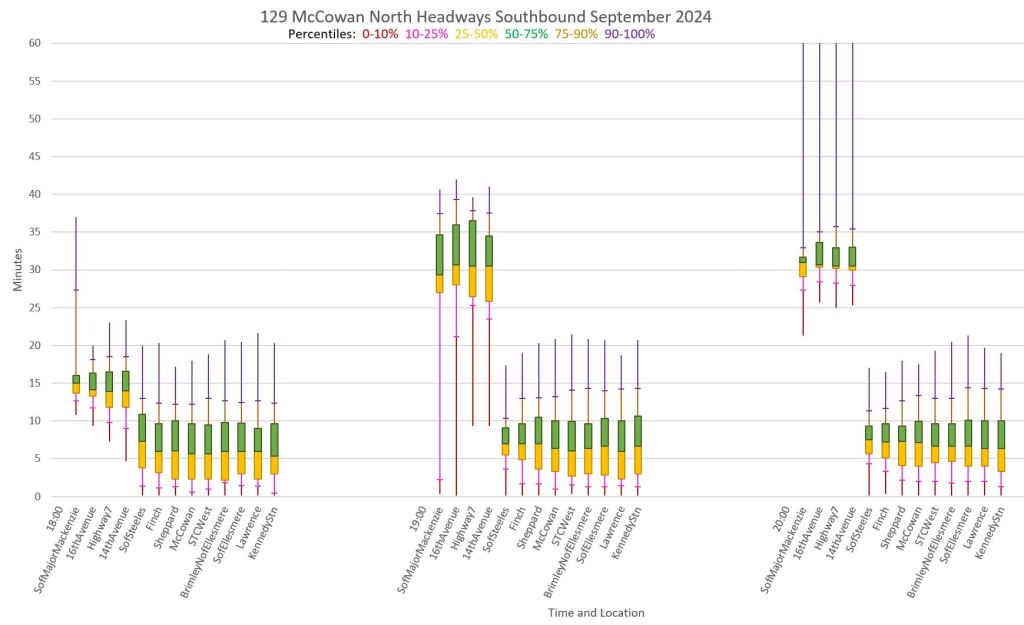
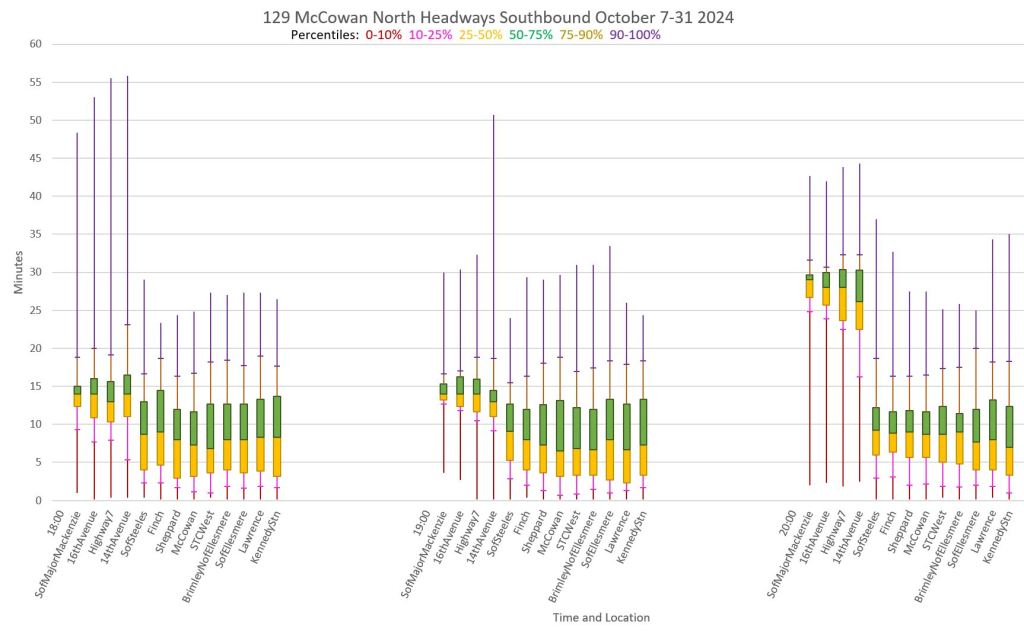
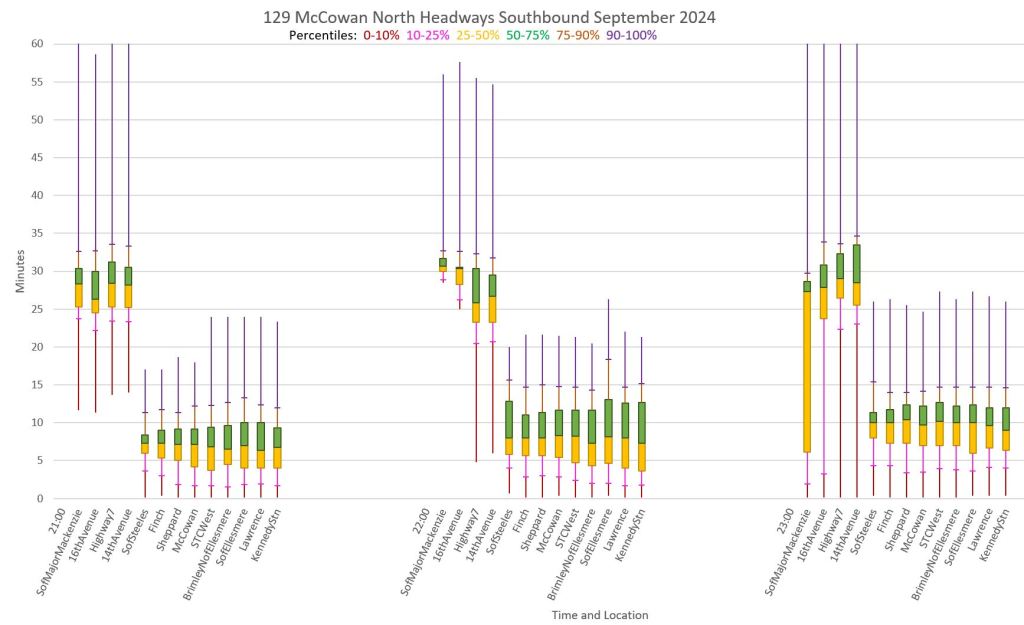
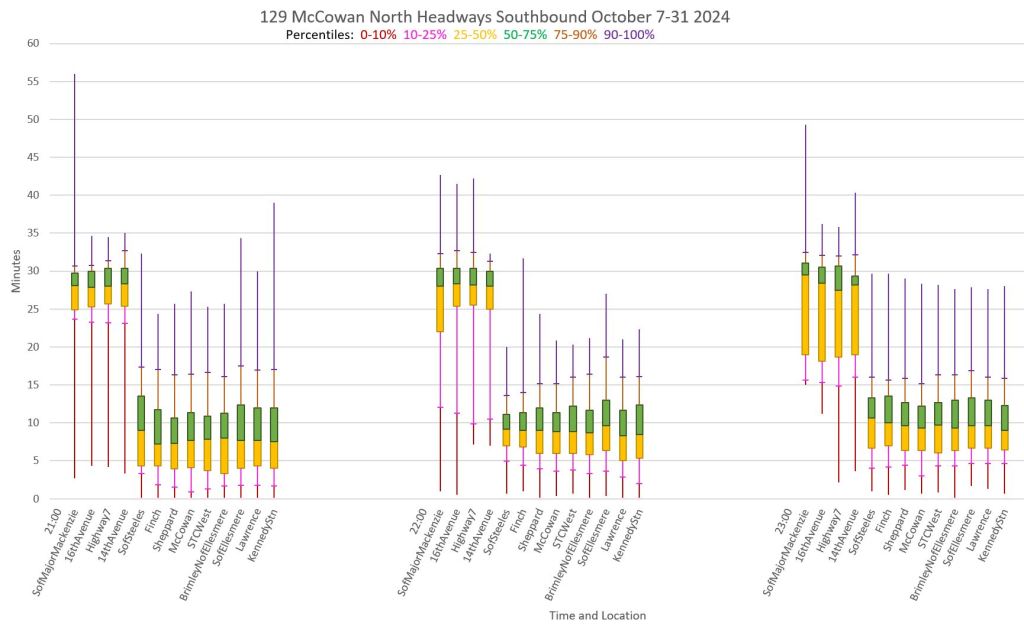
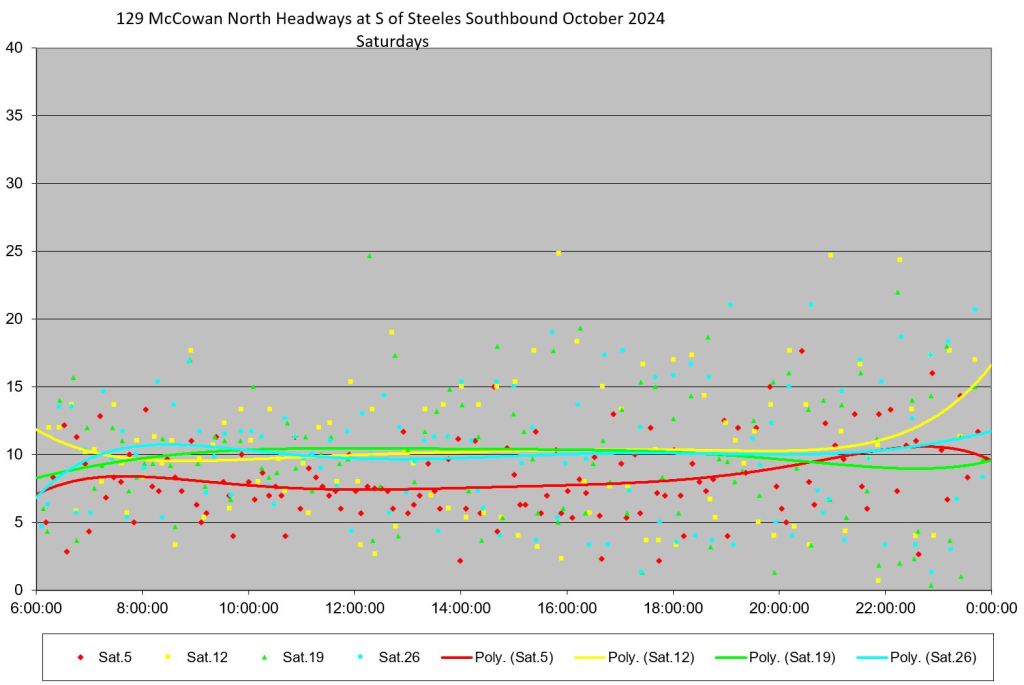
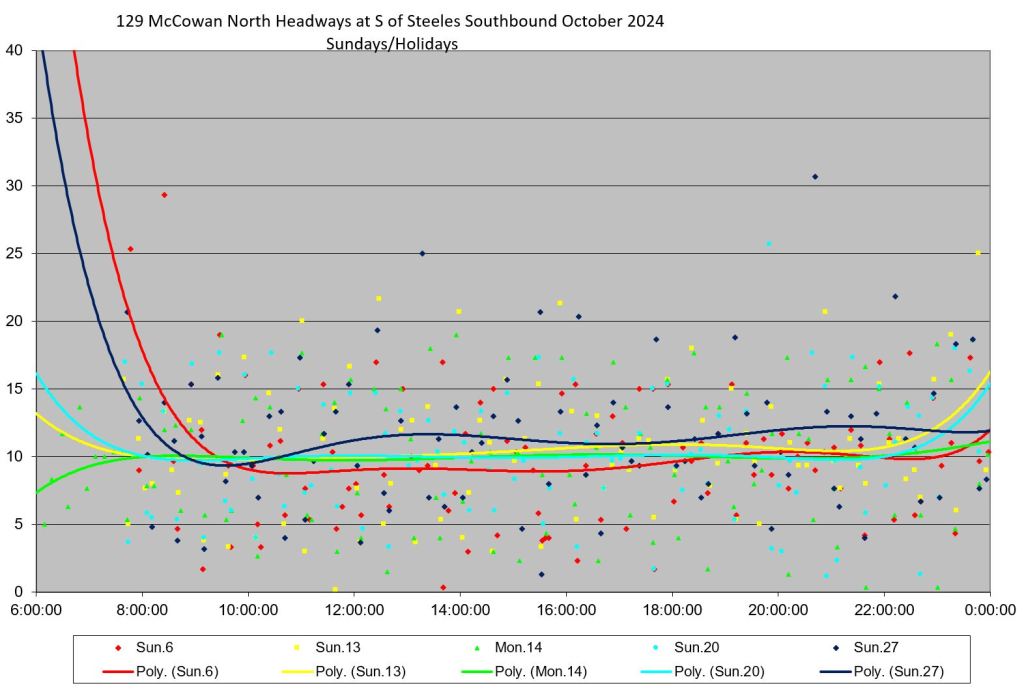
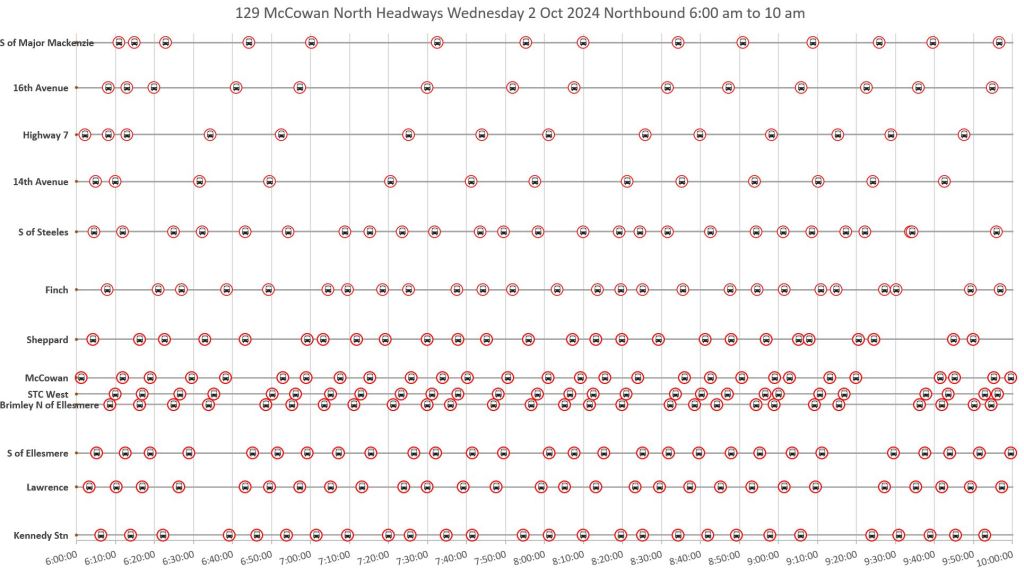
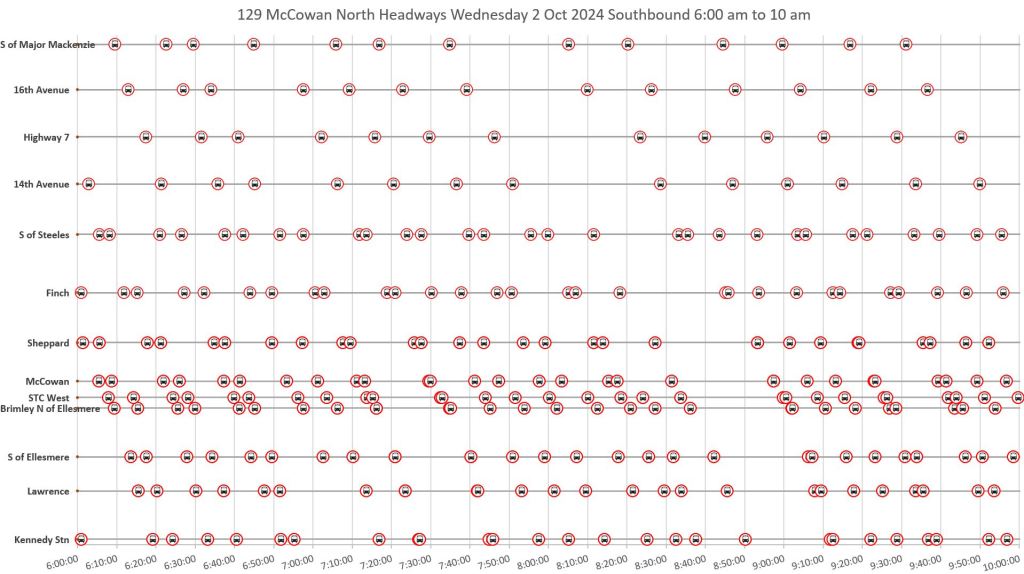
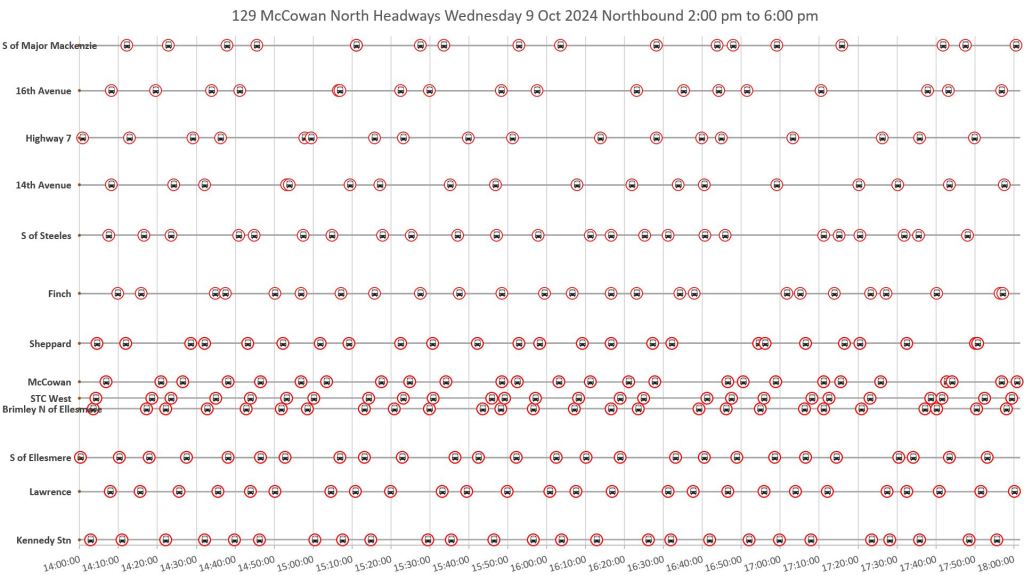
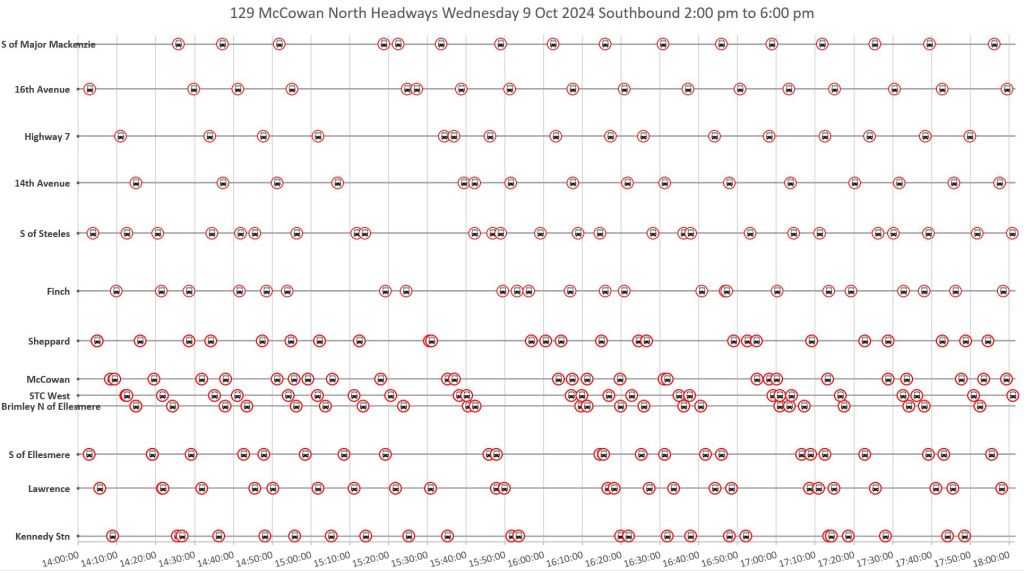
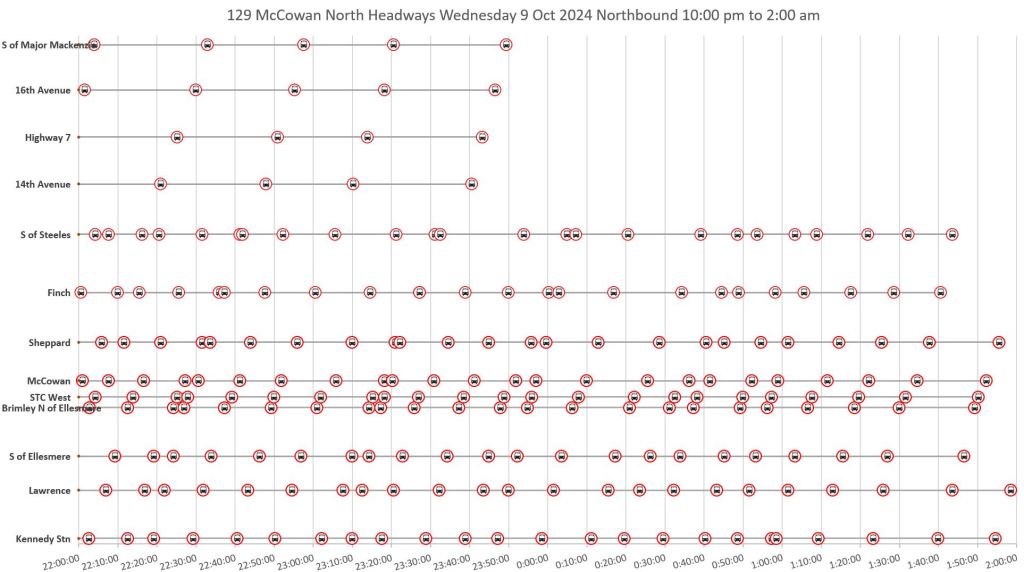
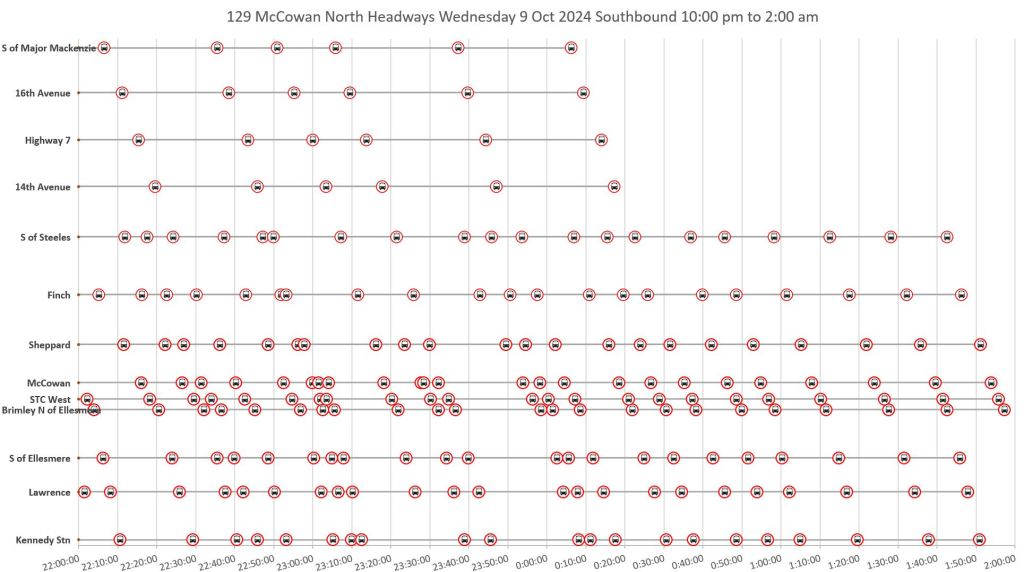
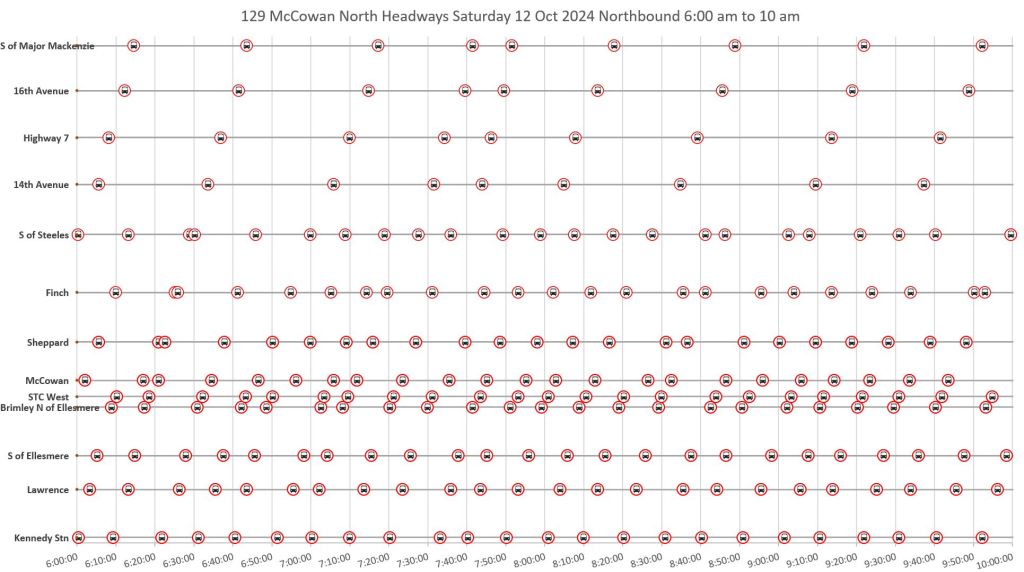
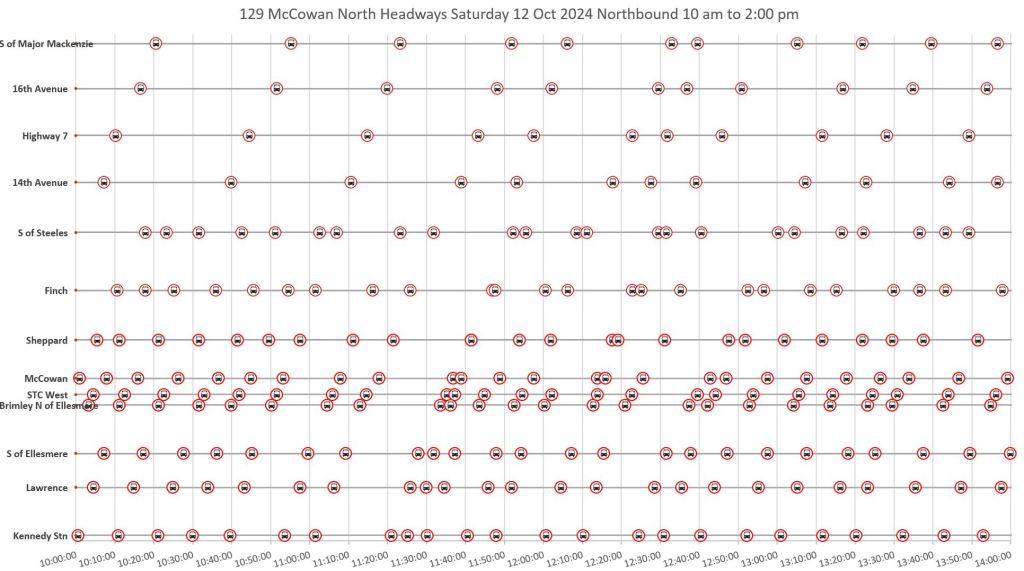
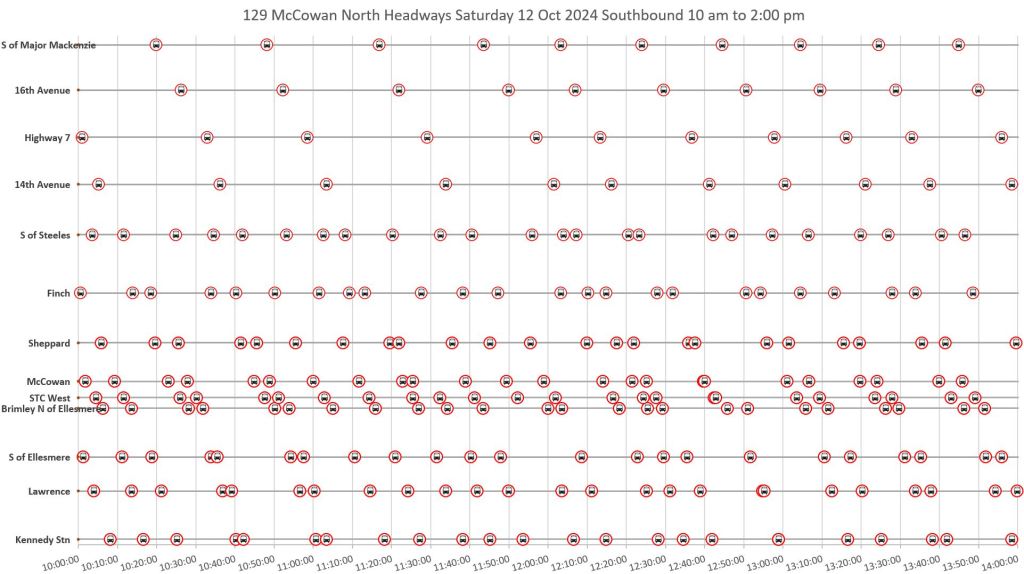
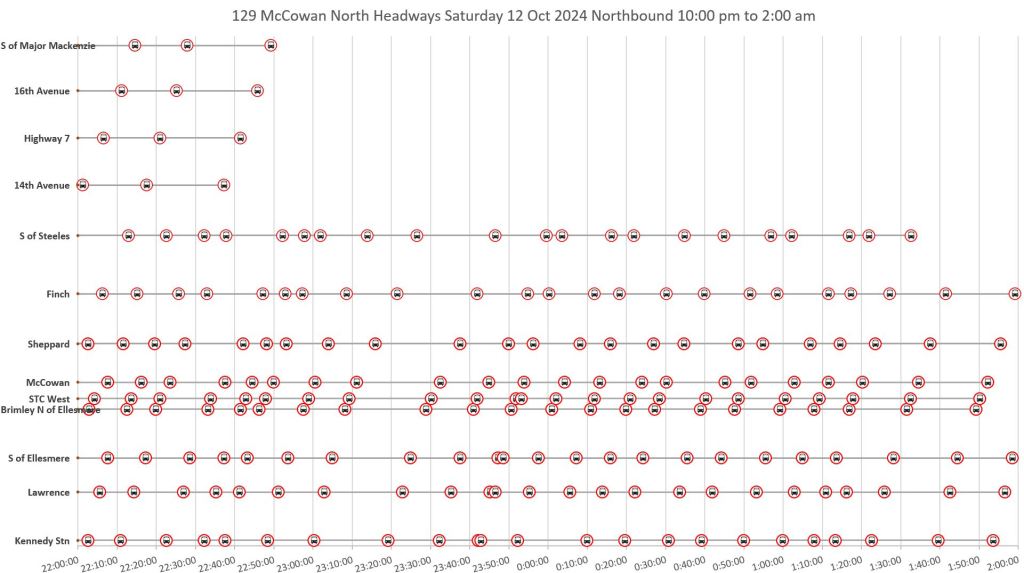
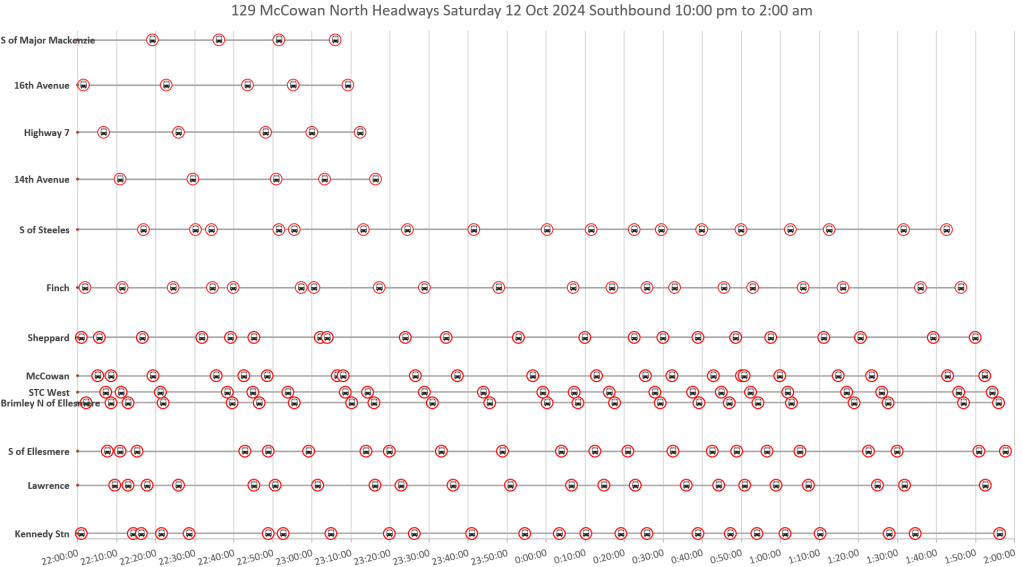
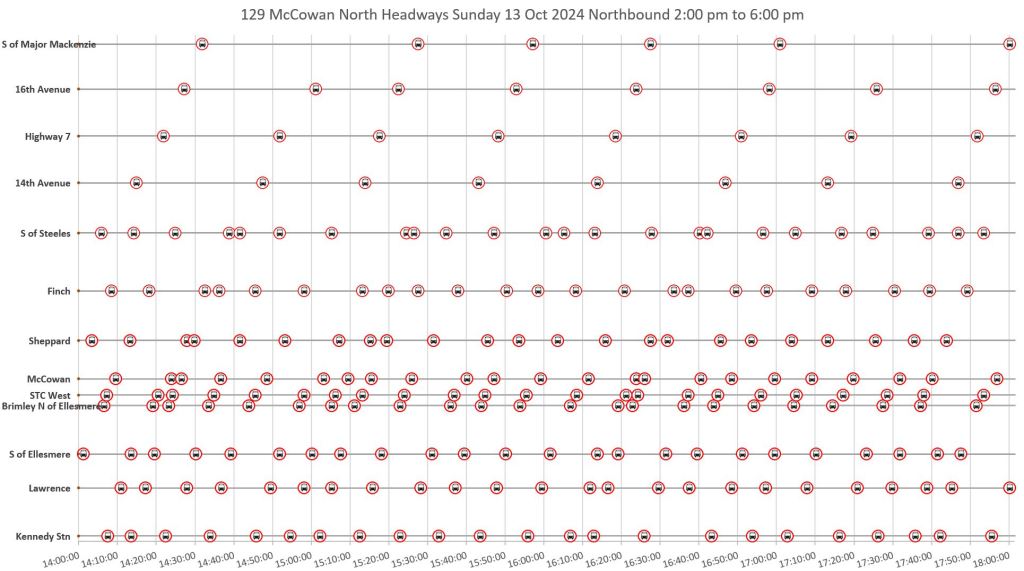
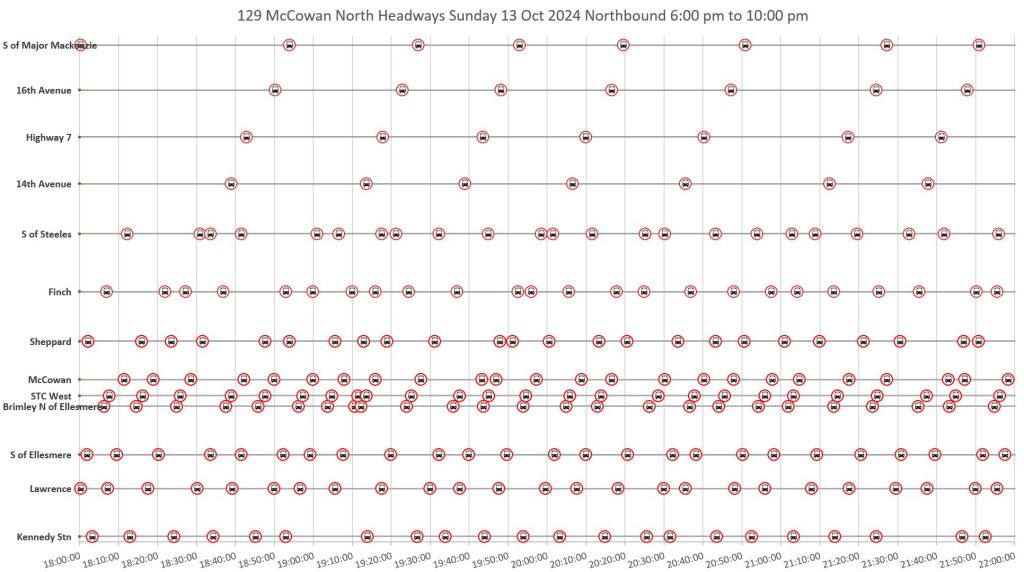
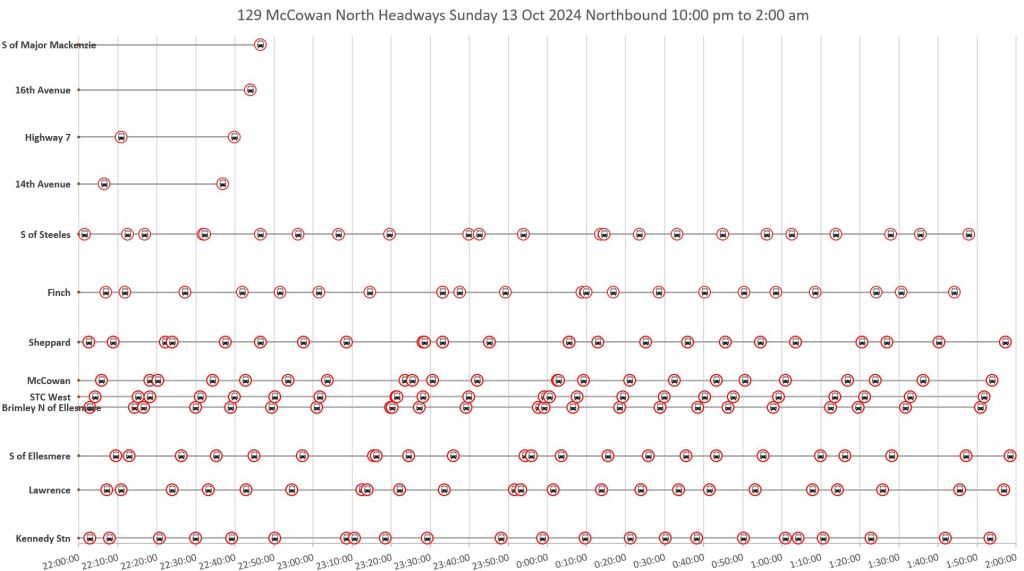
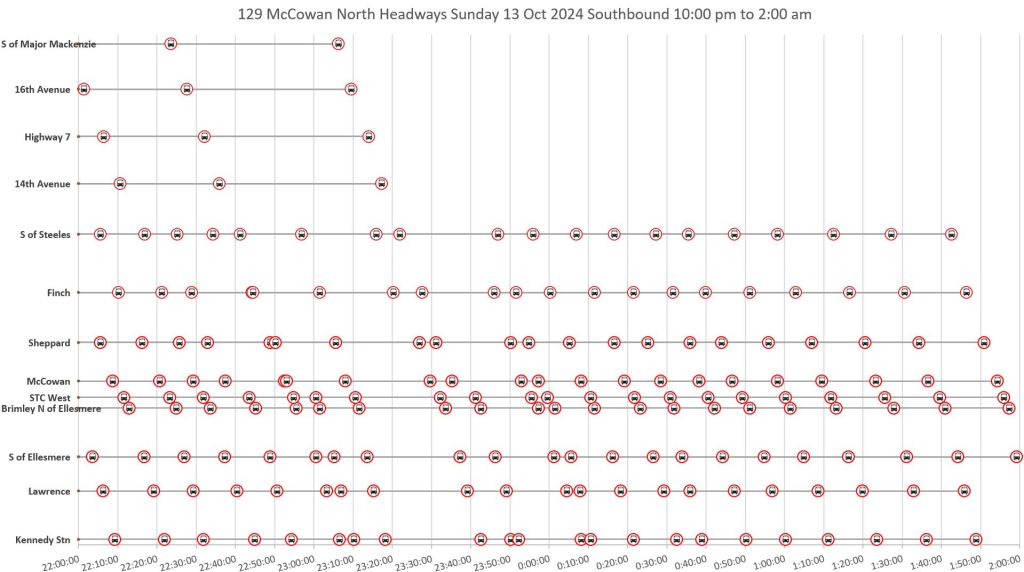
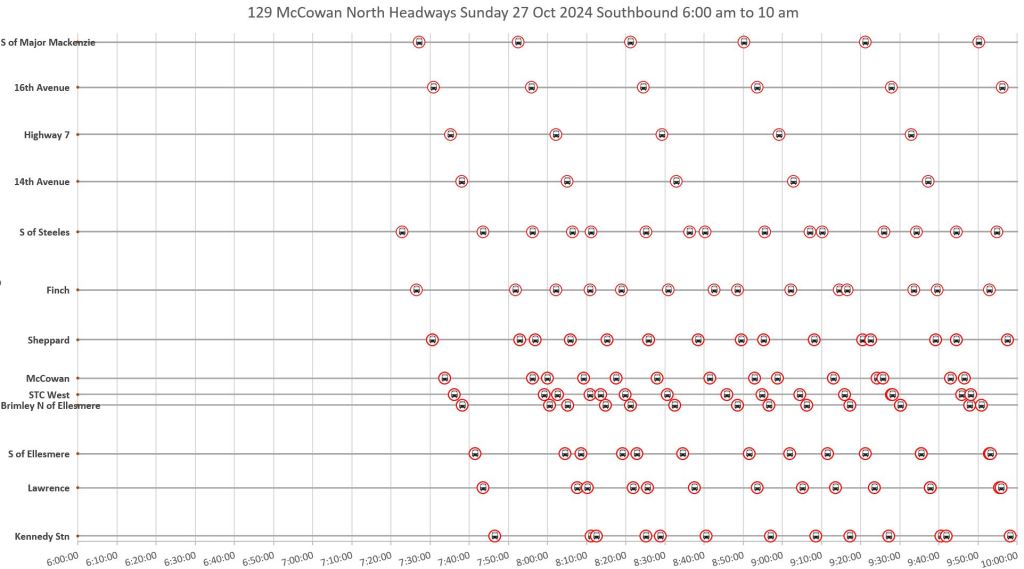
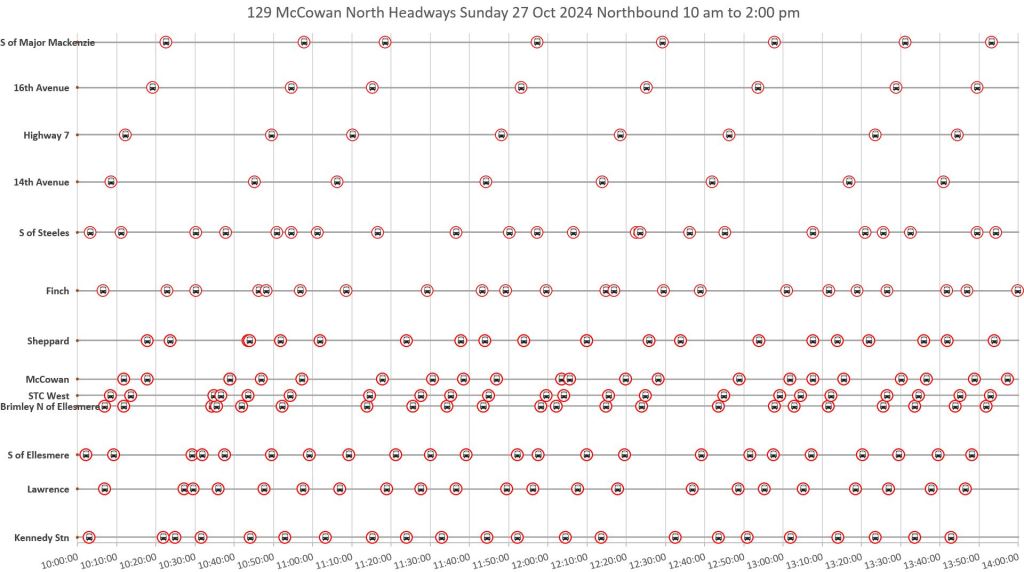
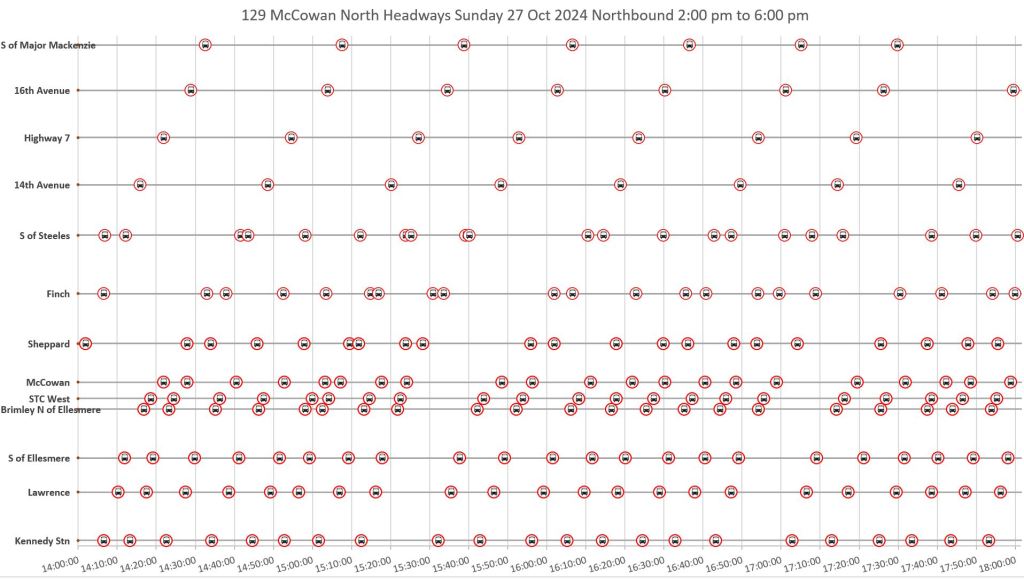
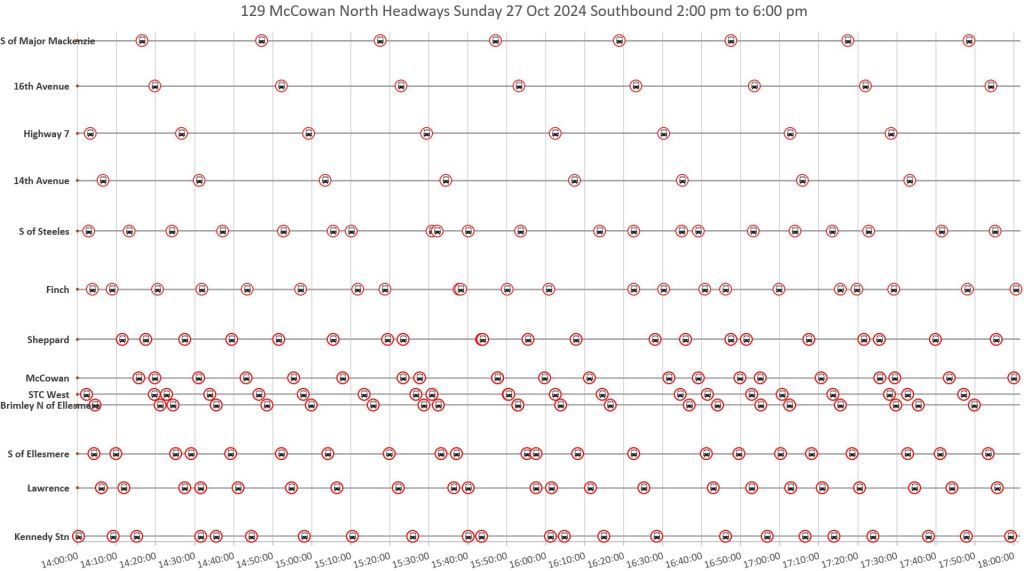
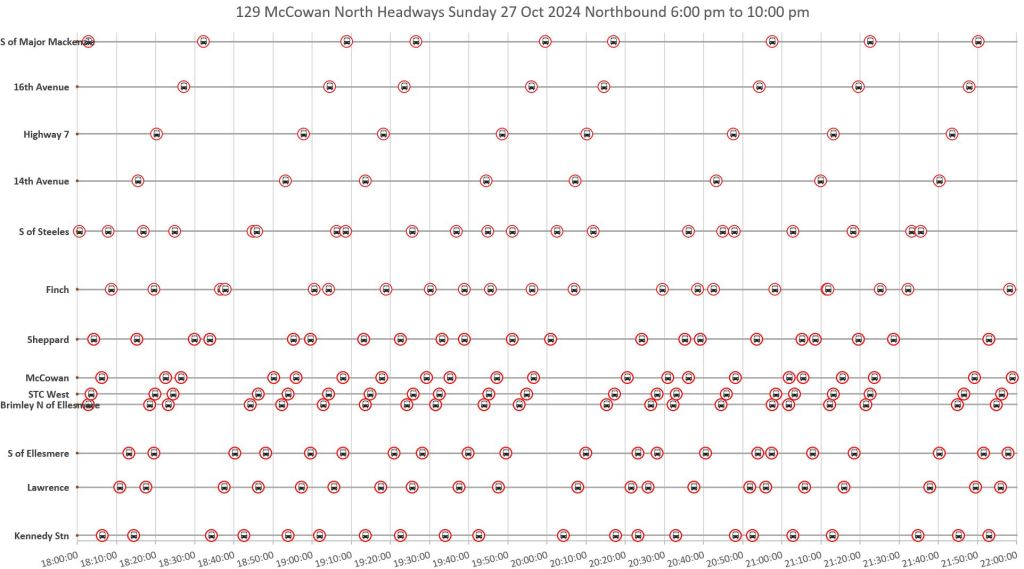
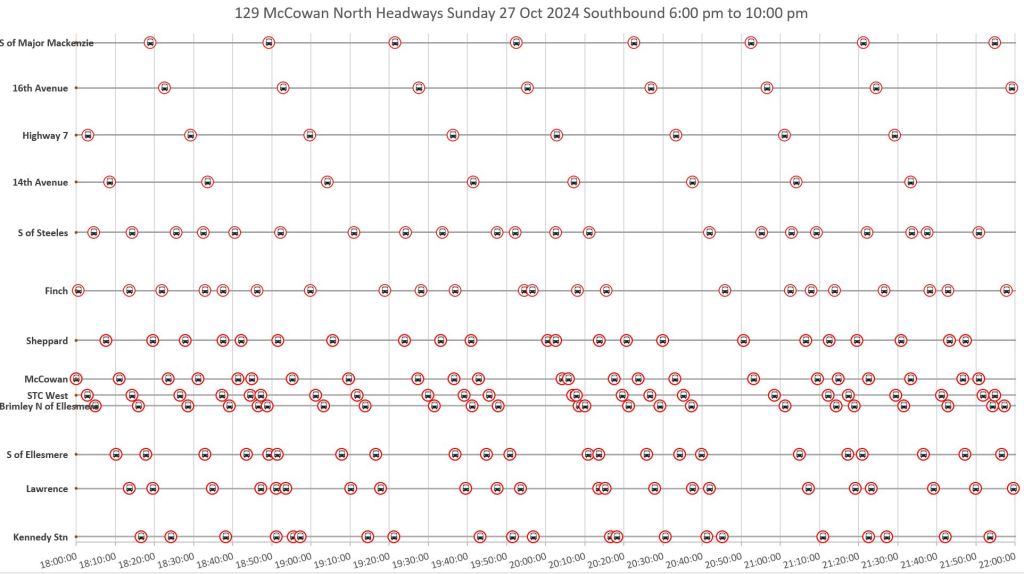
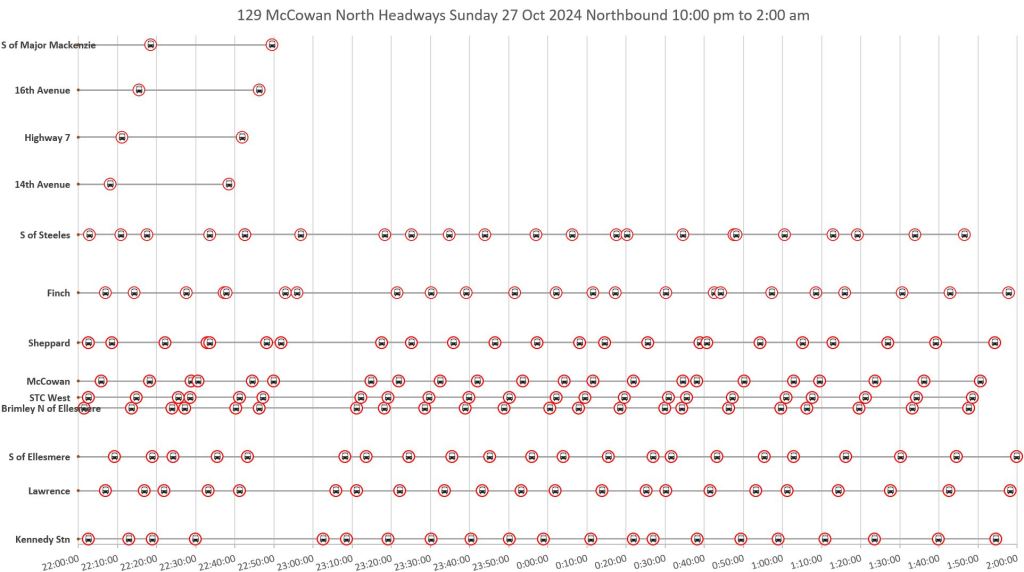
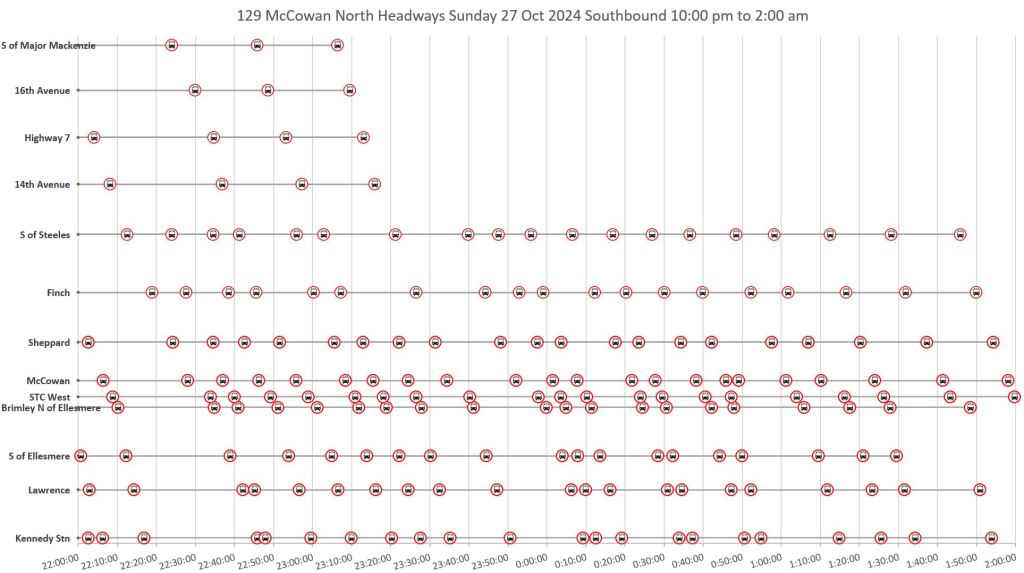
The charts below present headway reliability data for September and for October 6 onward showing the actual distribution of headways at various points along the route.
The northbound data for each month are presented side by side, followed by the southbound data. Each cluster of columns contains data for one hour (e.g. all 6-7am data for weekdays within the month) summarizing the actual headways. The central yellow and green boxes contain the middle 50% of observations (the 2nd and 3rd quartiles), while the tails above and below contain the other 50%. The horizontal bars on the tails are at the 10th and 90th percentiles.
The spread of headways riders actually saw at each location along the route are indicated by the length of the bars and tails. Note that values during the peak periods in October are generally more spread out than in September because of the uneven scheduled headways described above.
80 percent of headways lie between the horizontal bars with the other 20 percent above and below. Note that more riders will experience the upper 10 percent because more people accumulate at a stop in a wide service gap.
The spread of headway values was actually worse than these charts show for part of the month when construction near Sheppard increased running times. This effect will be seen in a later section showing detailed weekly breakdowns of the data.
Northbound
The spread in headway values on the rightmost columns of each set is for the service in York Region from Steeles to just south of Major Mackenzie. The headways, and the spread in headway values are much larger there. Not only is the service less frequent, it is considerably less reliable.
The spread in headways in October is wider than in September because of the new schedule with fewer buses, and with scheduled uneven headways in the peak periods. North of Steeles Avenue riders can wait up to 60 minutes for buses that are supposed to arrive at most half hourly.
In a pattern seen on other routes, the central 50% block of headways widens along the route during many time periods as gaps widen and bunching is more prevalent. This illustrates how stats from terminal locations, the point used for all TTC “on time” measurements, can present a best case scenario that does not match what most riders encounter.
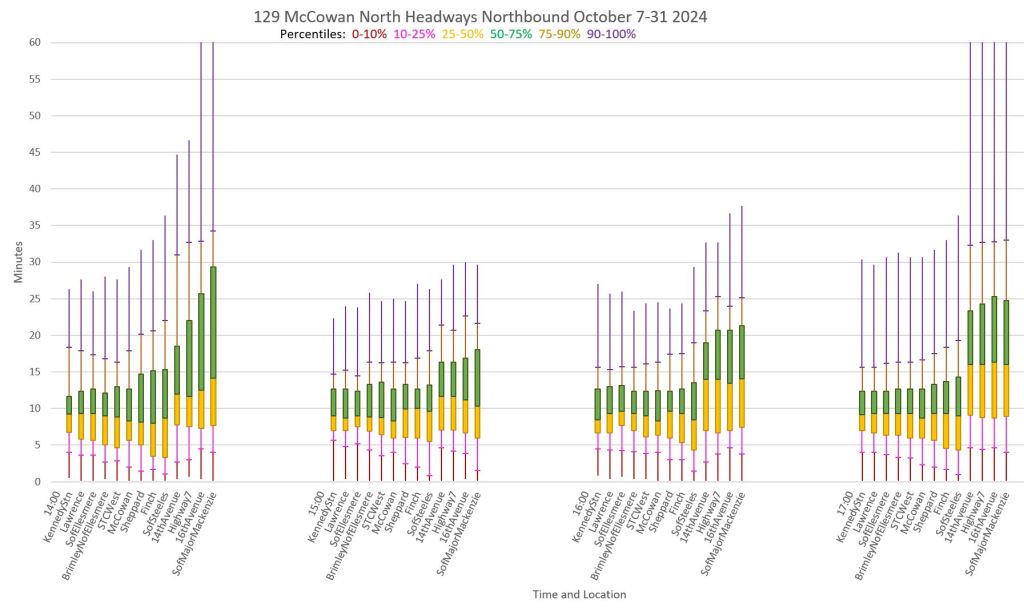
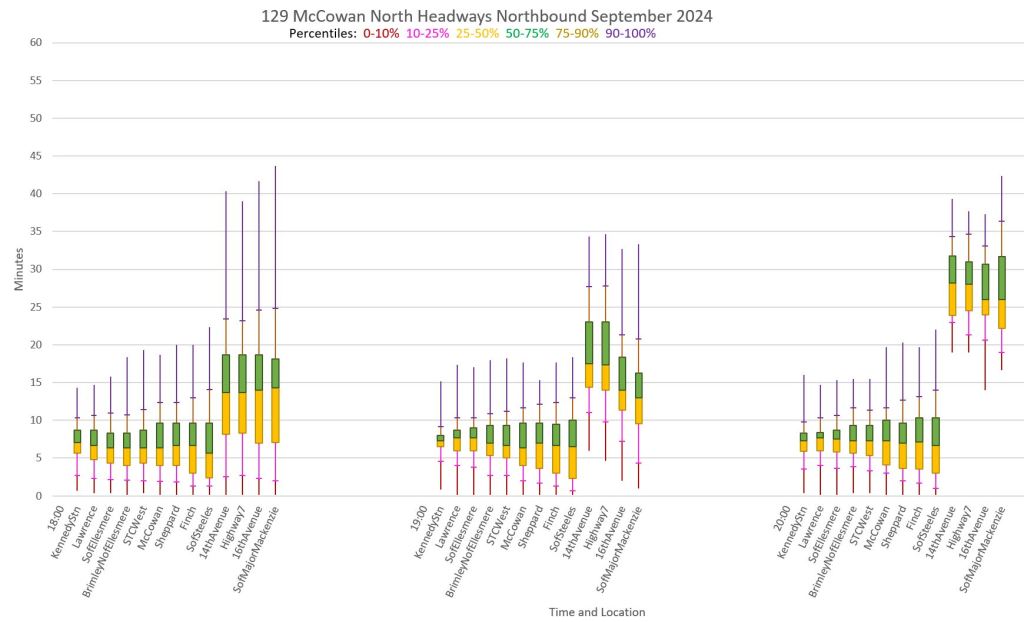

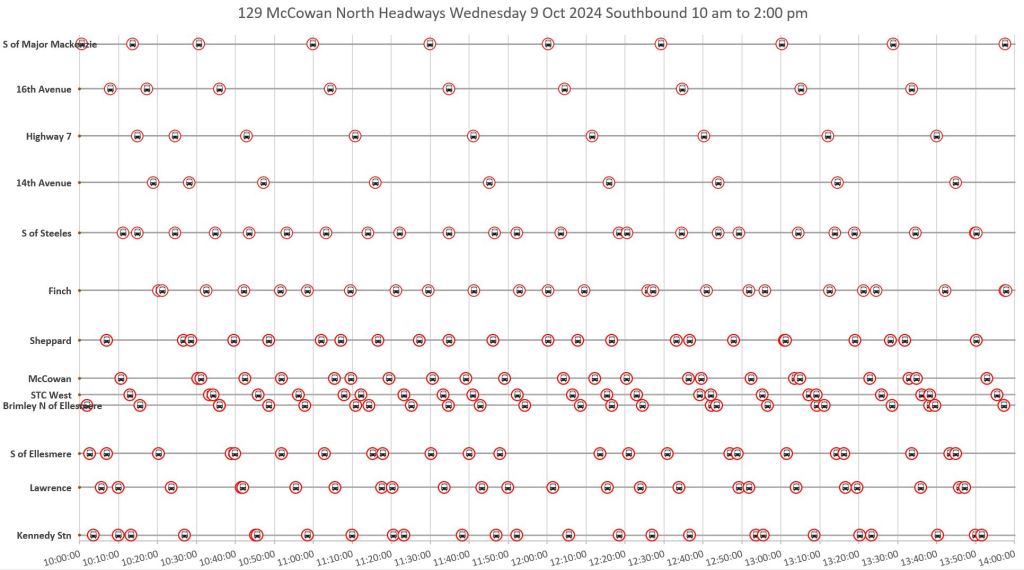
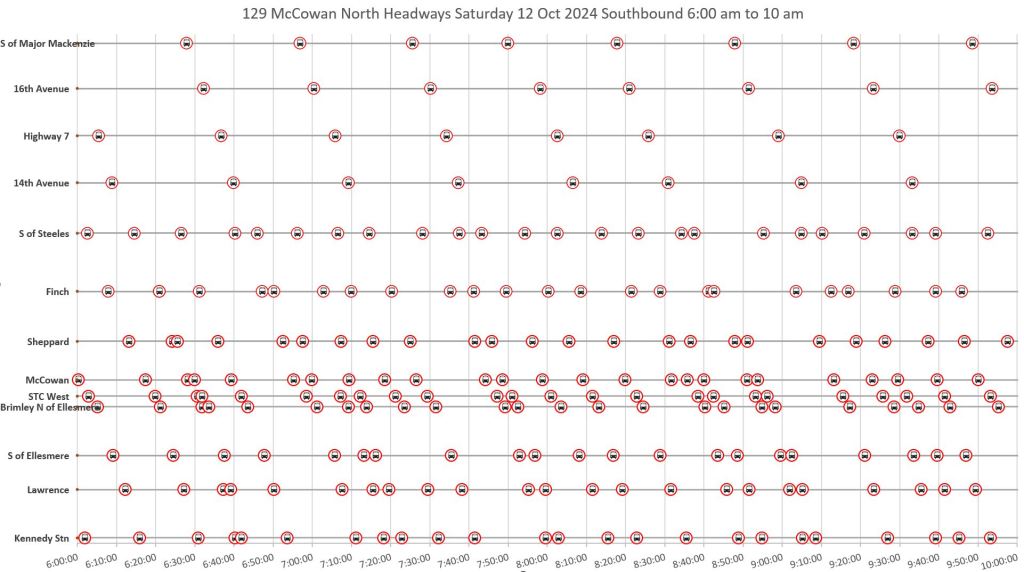
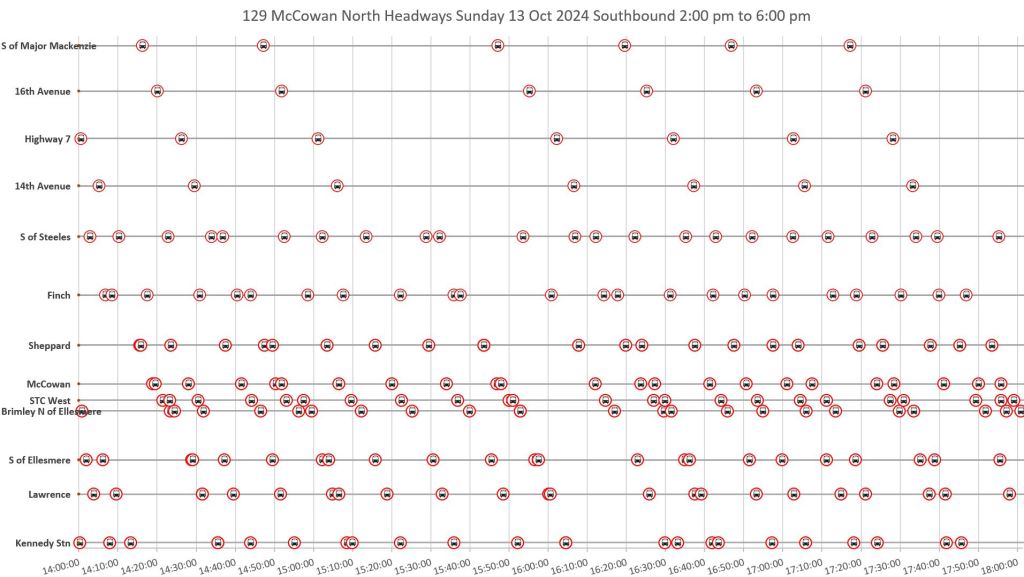
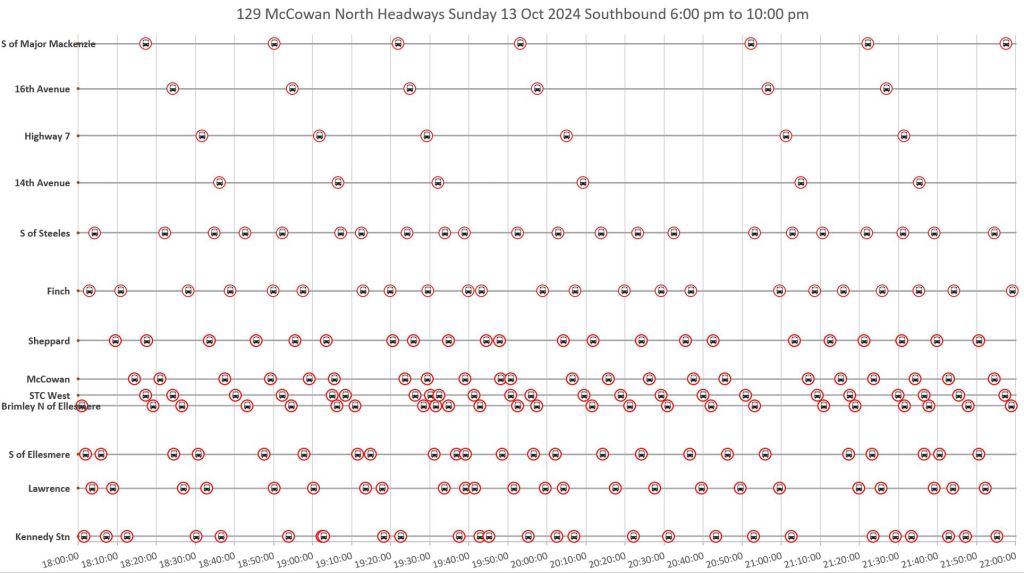
Southbound
The southbound charts show September and October in the same arrangement as the northbound charts above, but with the Major Mackenzie screenline on the left of each group. Like the northbound service, southbound buses in York Region can be erratic. Although some periods have a very concentrated central 50% of headway values, there are still many outliers. The service is less ragged than northbound because buses recover some of their spacing for southbound trips with recovery time at the north end of the route.
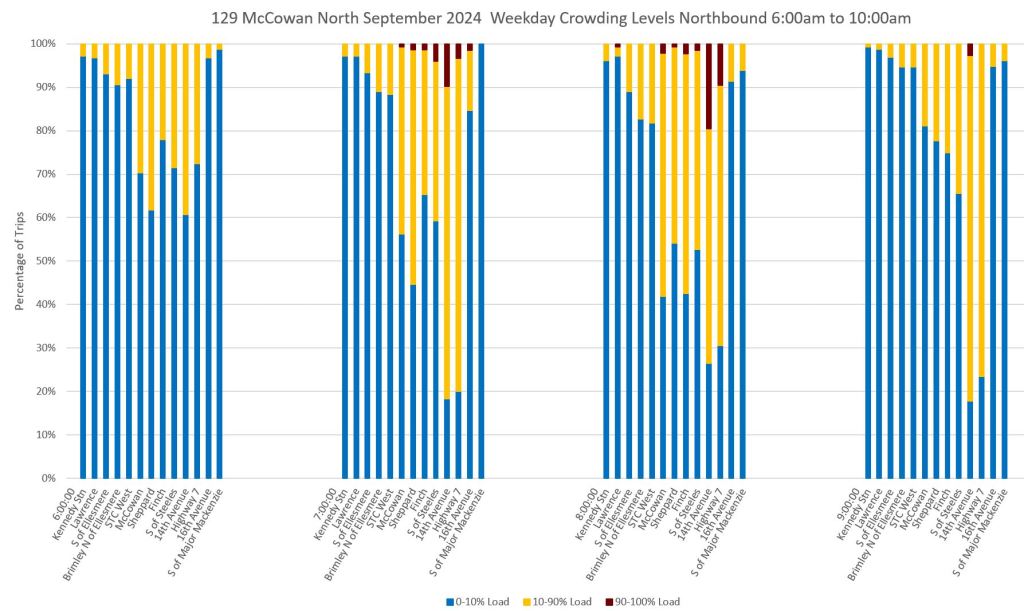
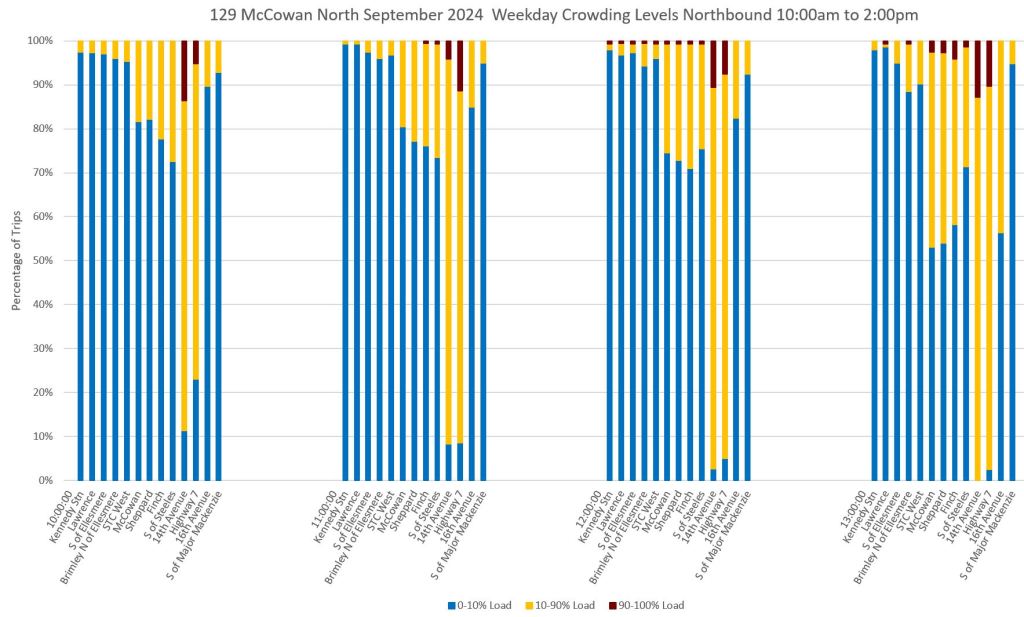
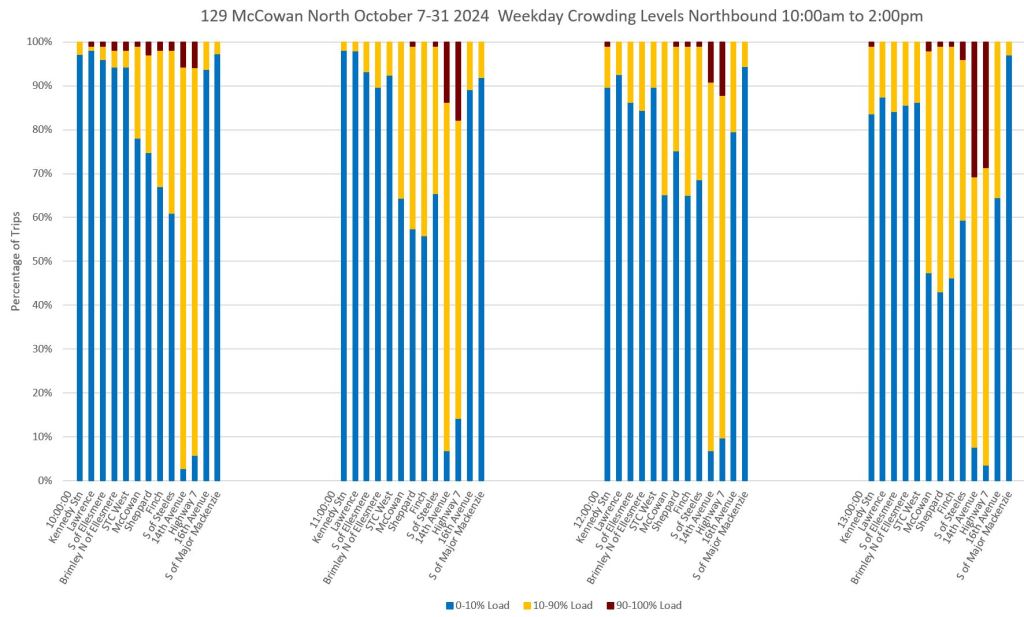
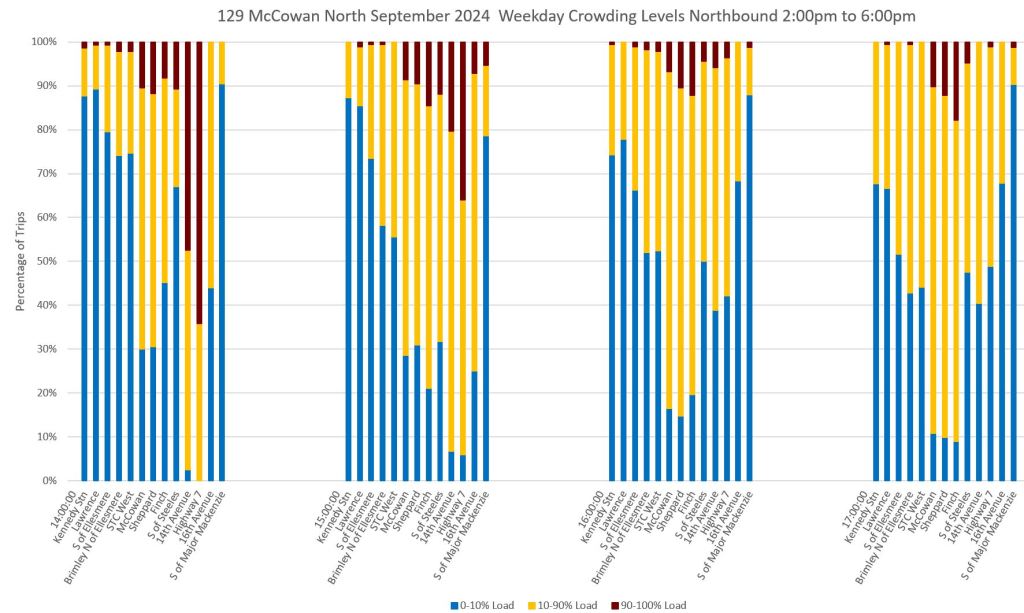
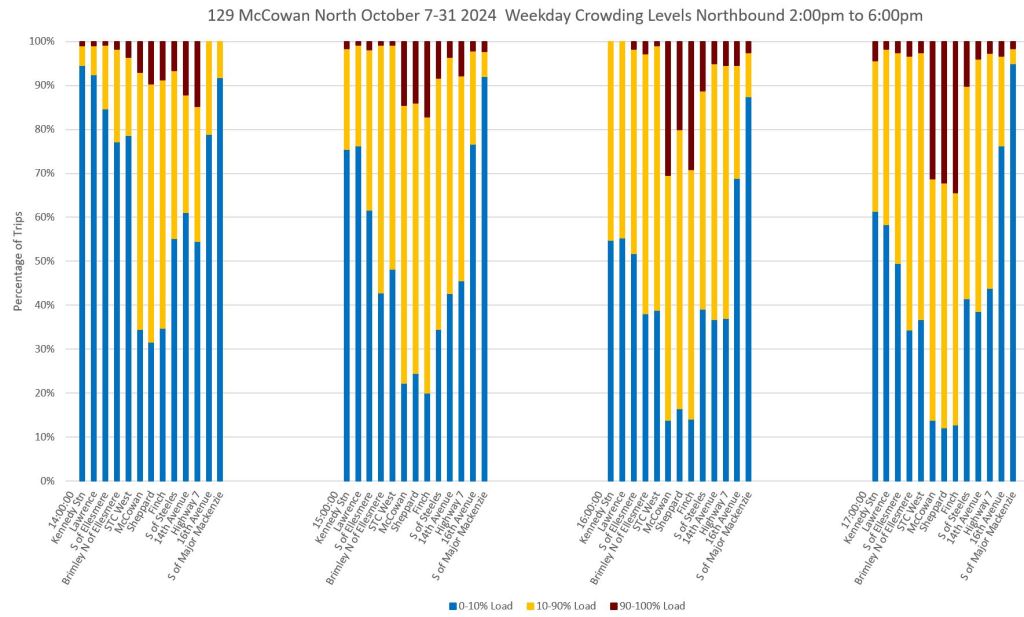
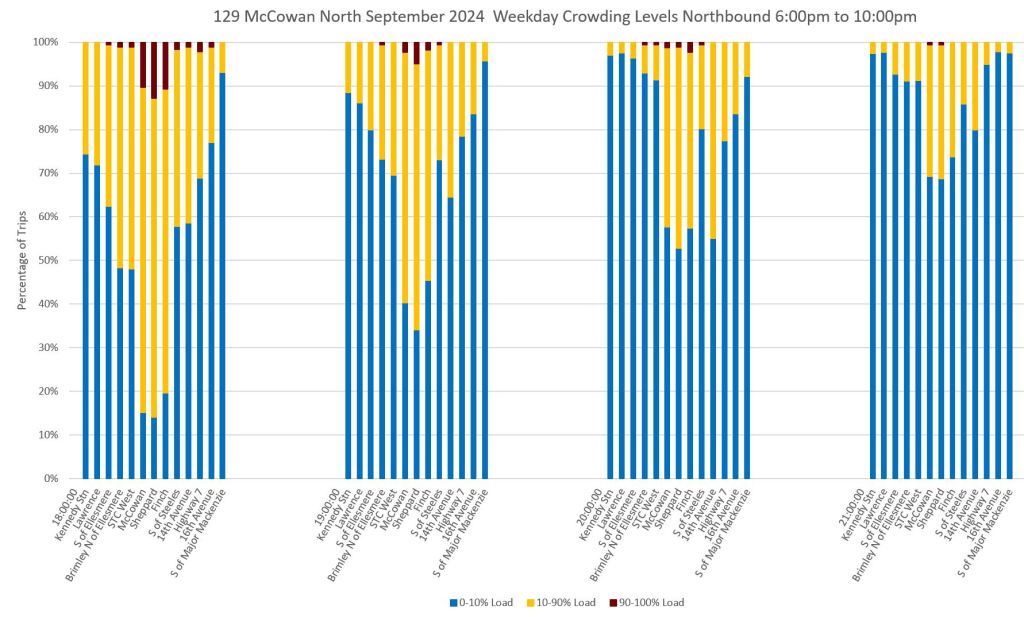
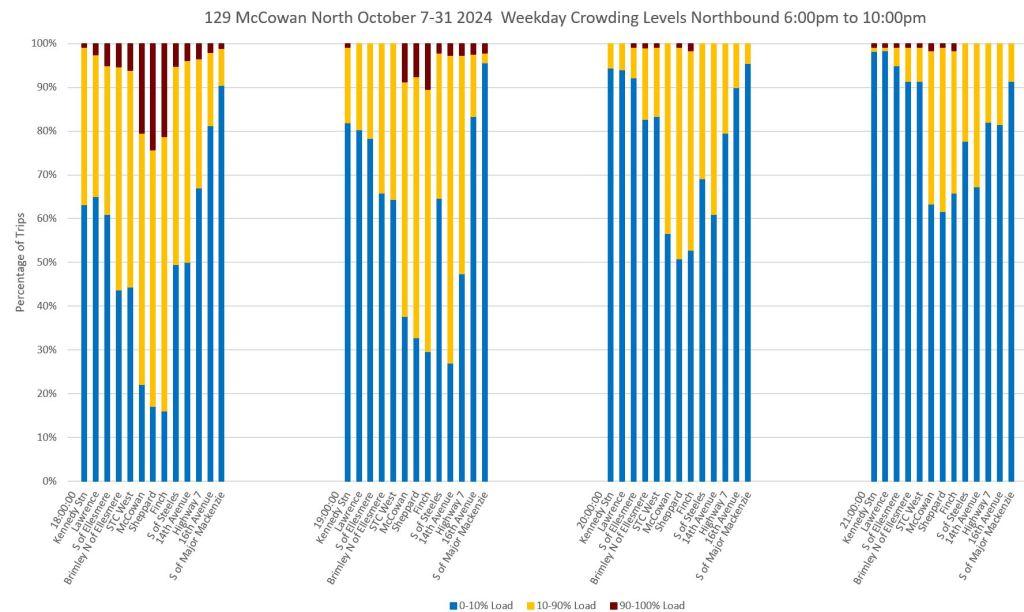
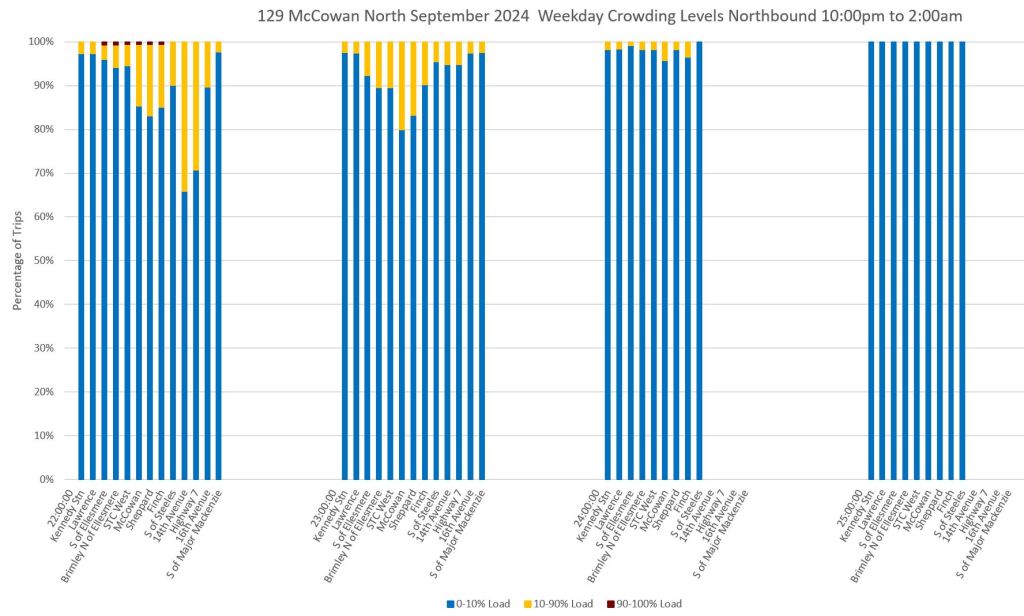
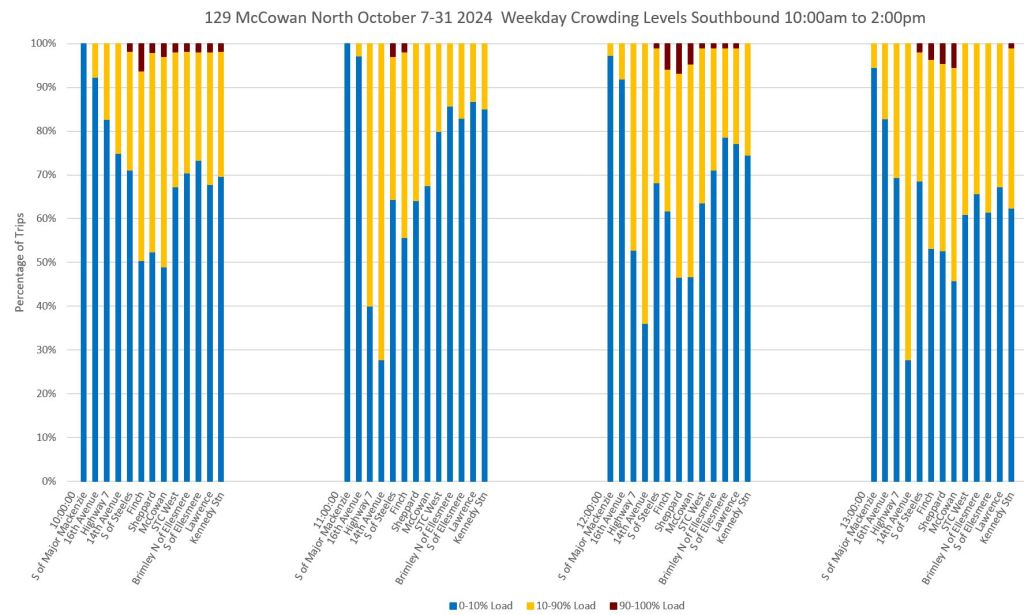
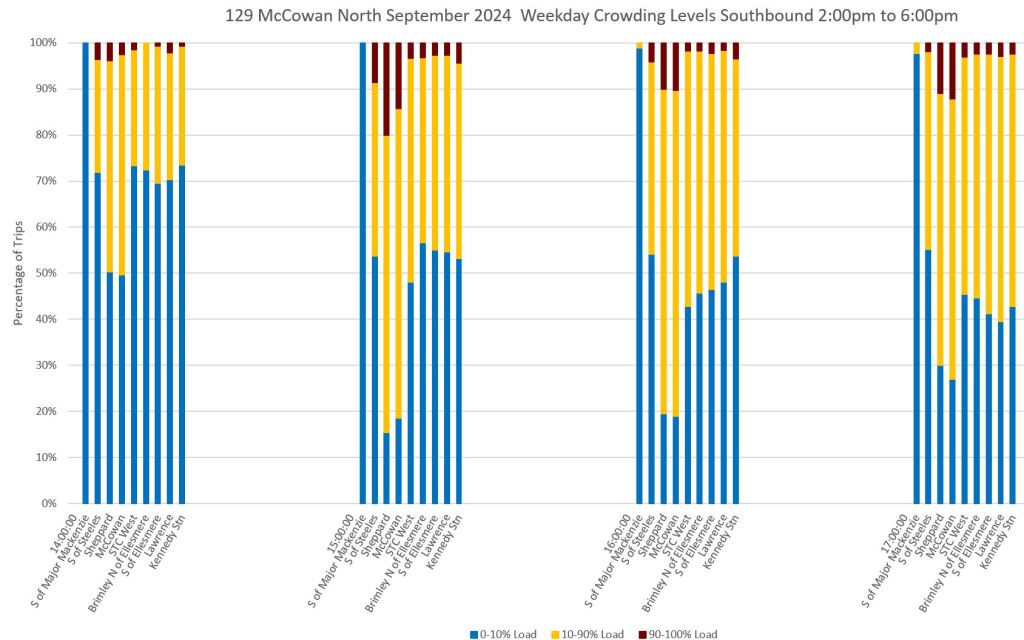
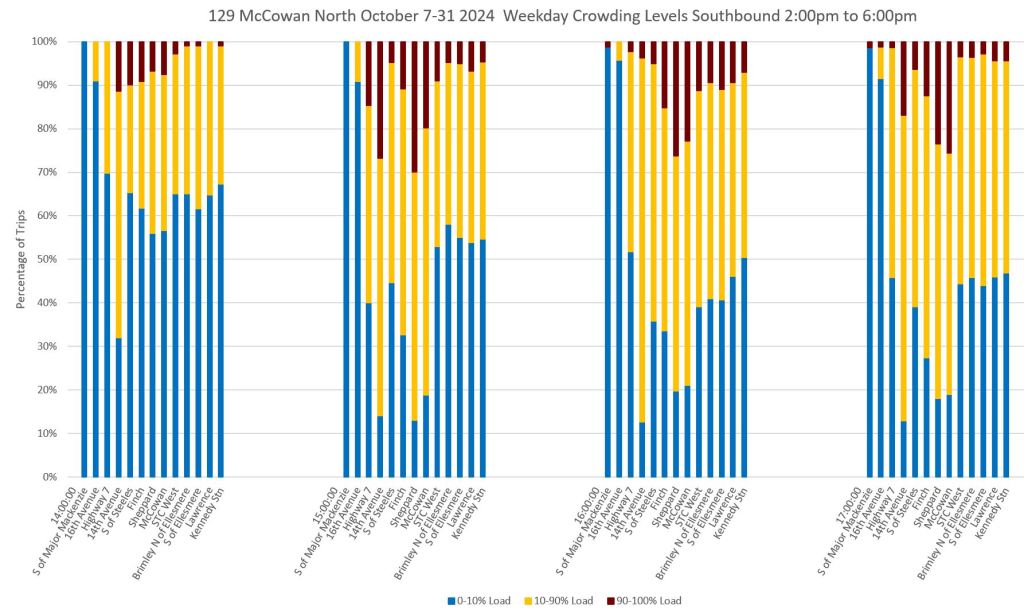
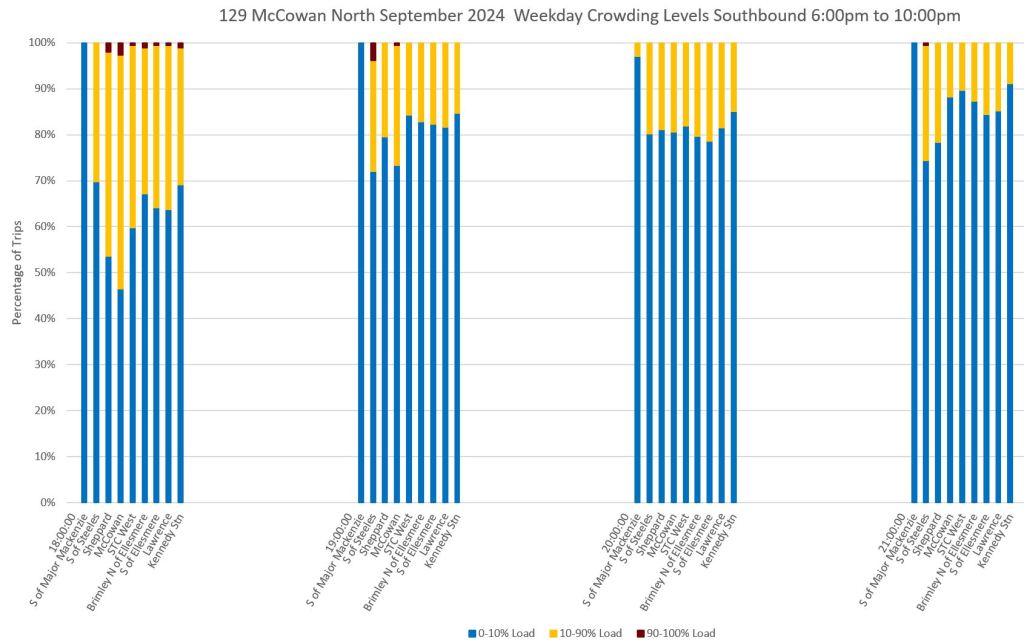
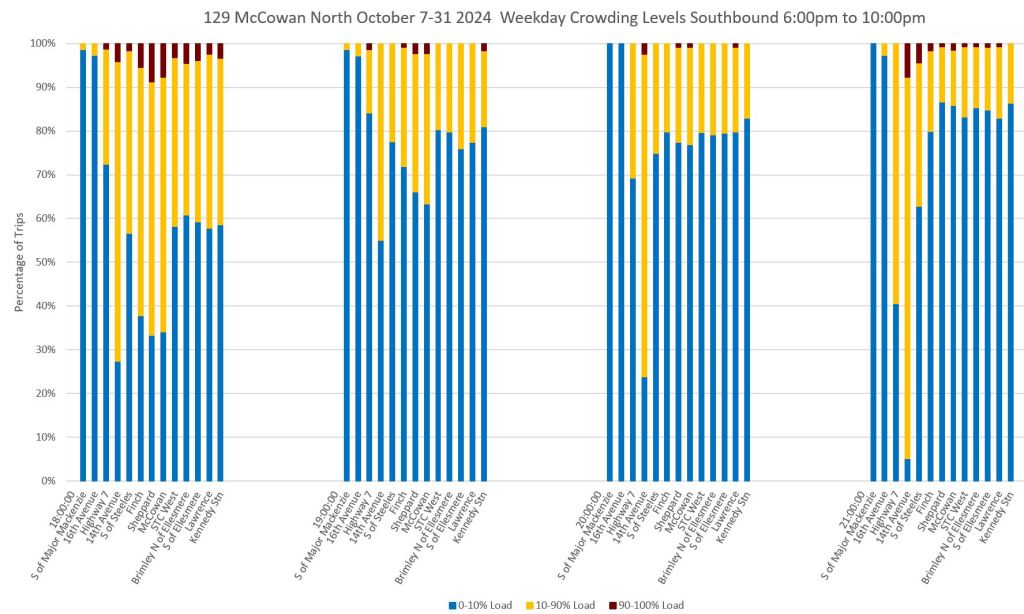
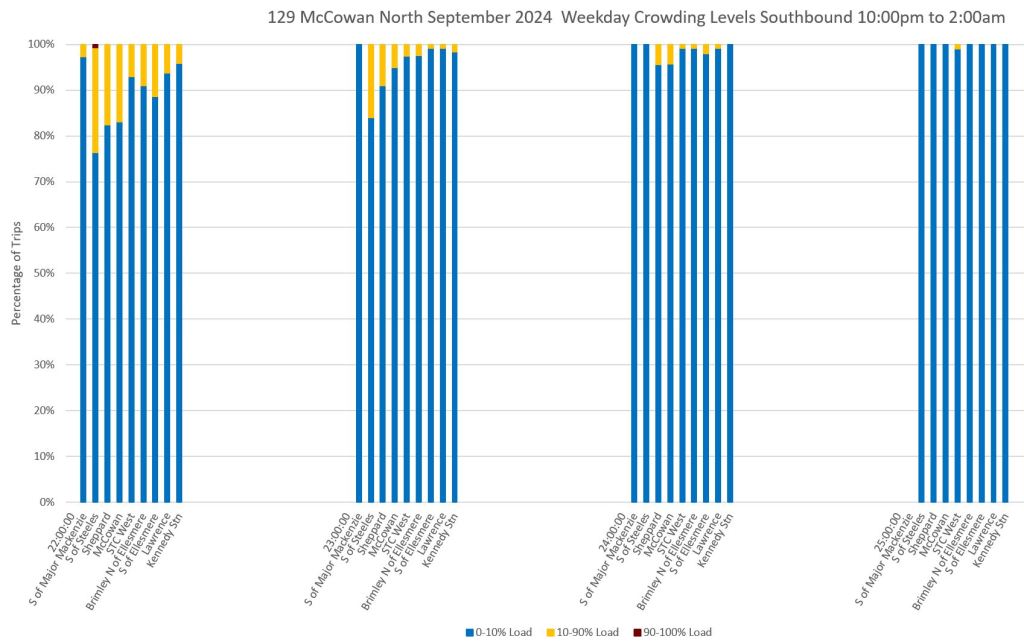
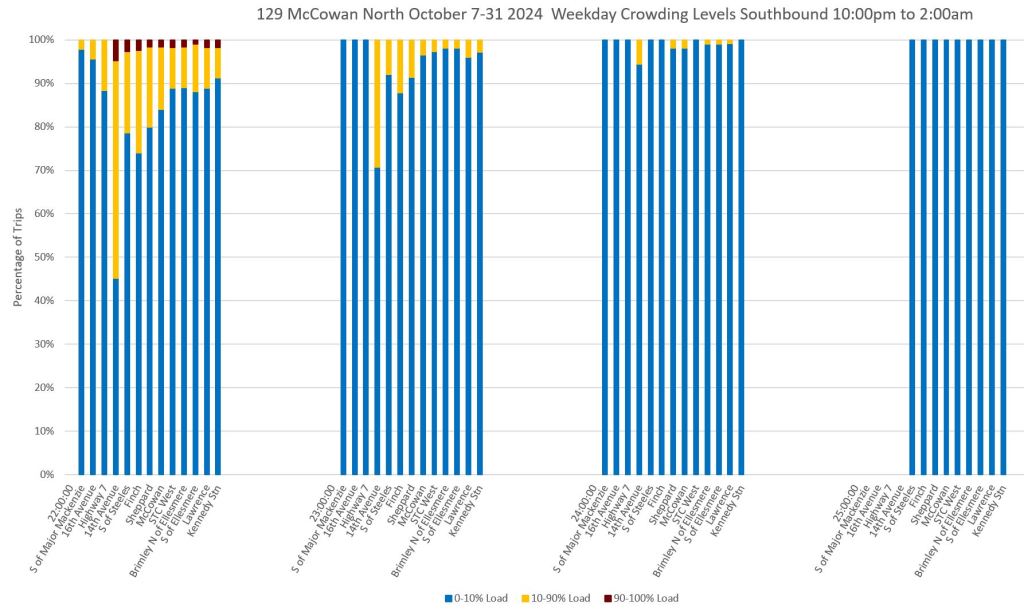
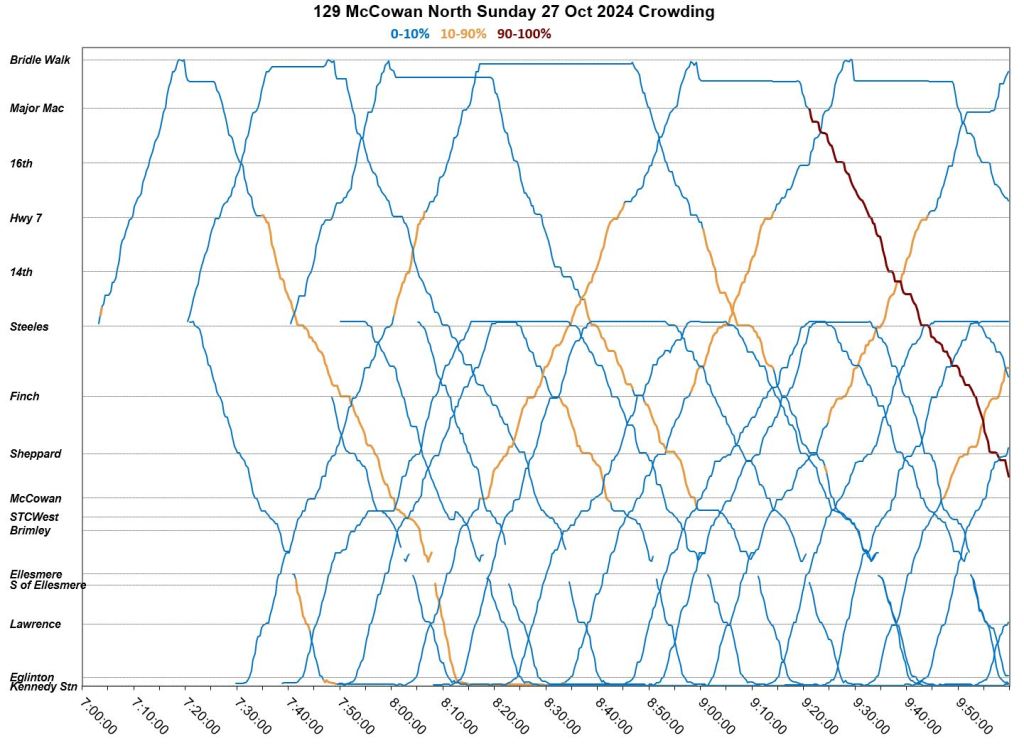
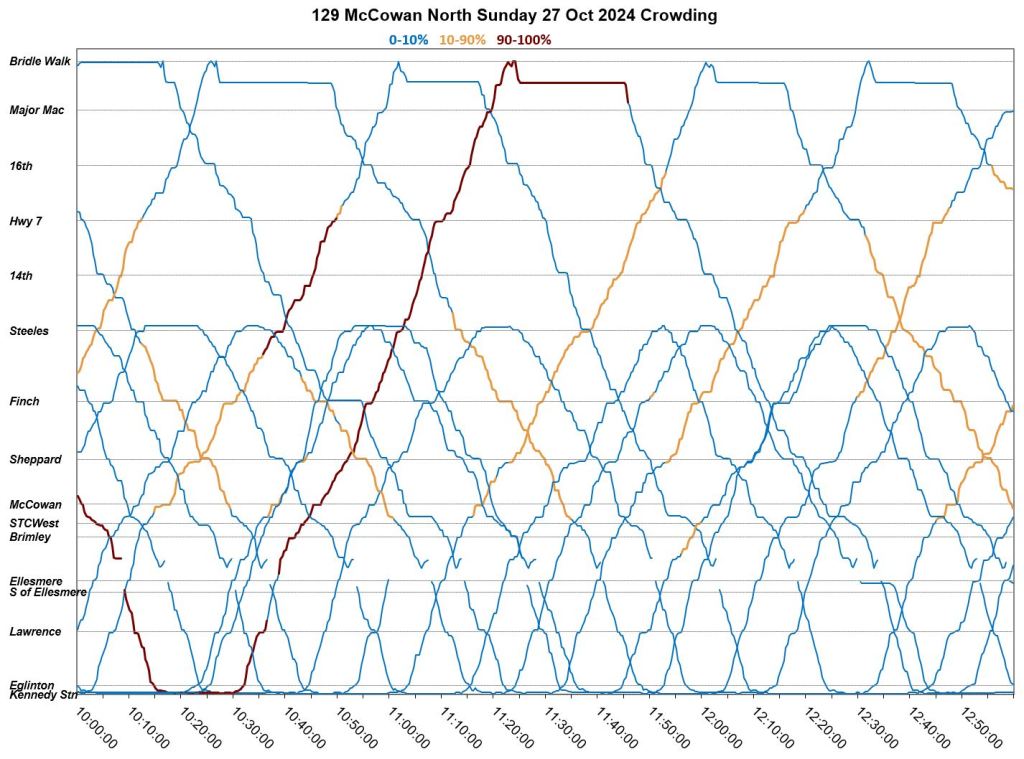
Crowding
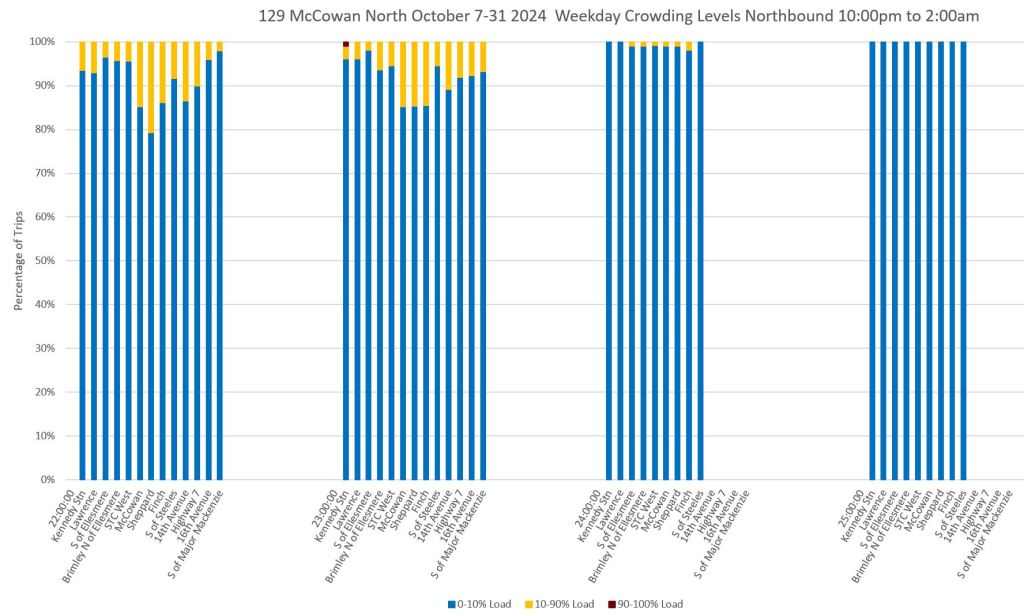
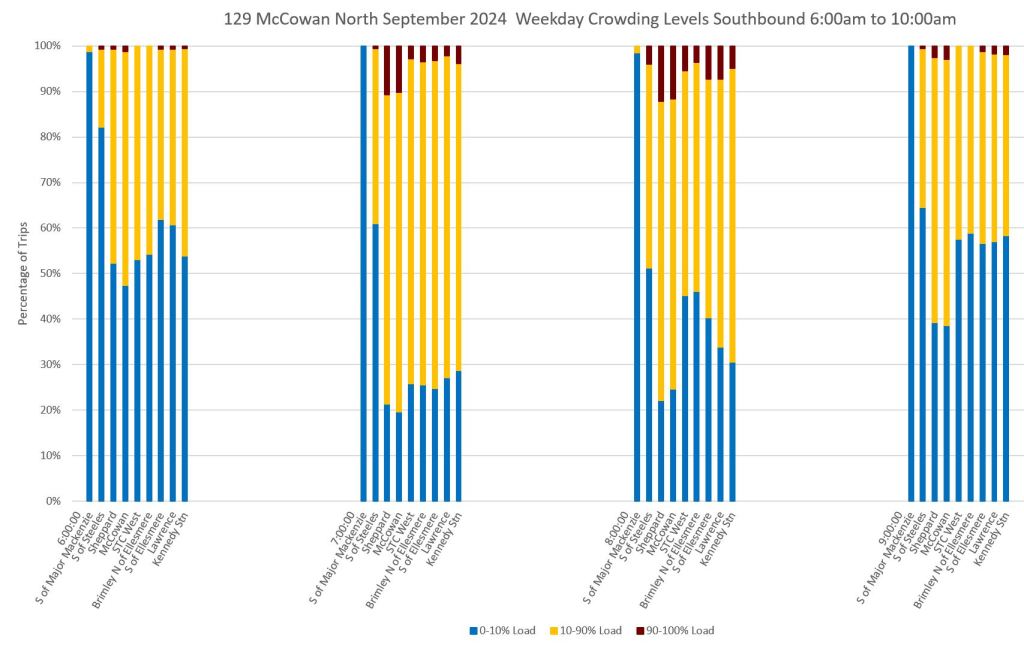
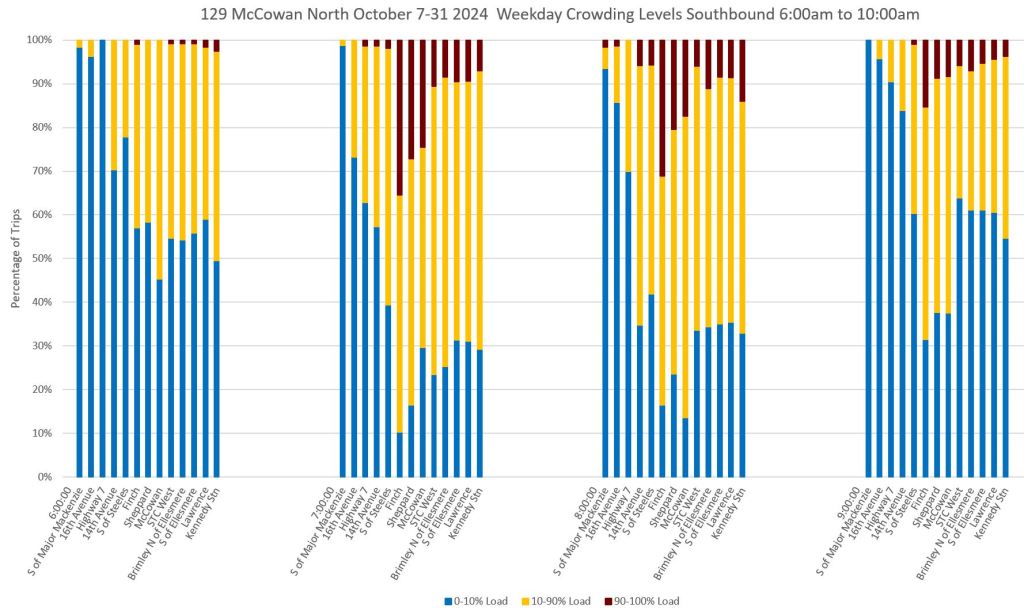
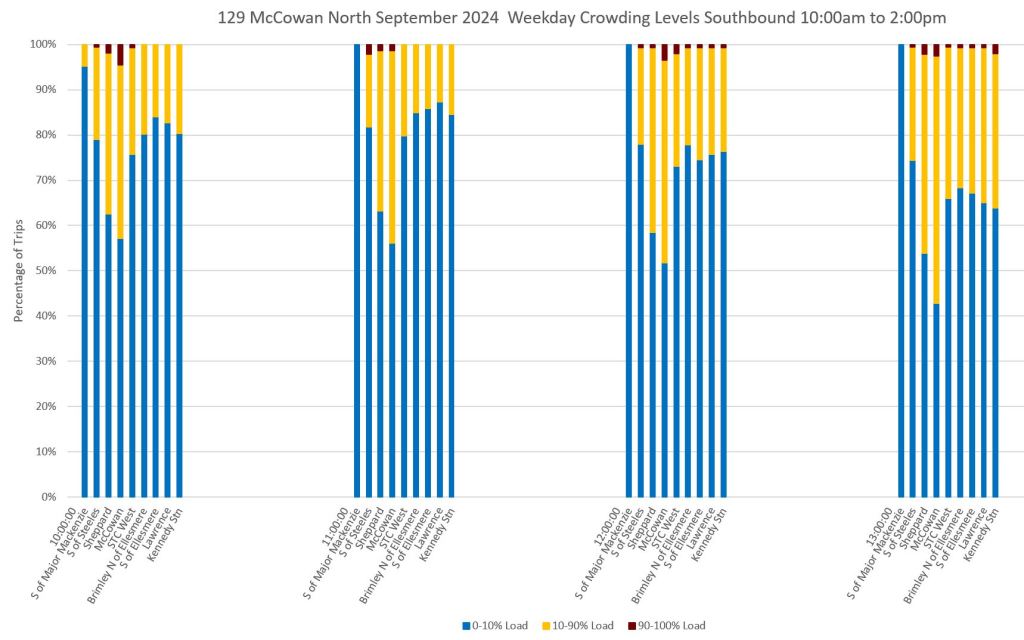
Compared to some routes, there are few trips reporting heavy load conditions on this route, but the proportion is higher in October.
Note that locations with higher crowding (dark red in the charts) are not immediately adjacent to the south end of the route at Kennedy Station but between STC and Steeles. This shows that transfer traffic to and from other northern Scarborough bus routes is not replenished further south by riders heading to or from Kennedy Station.
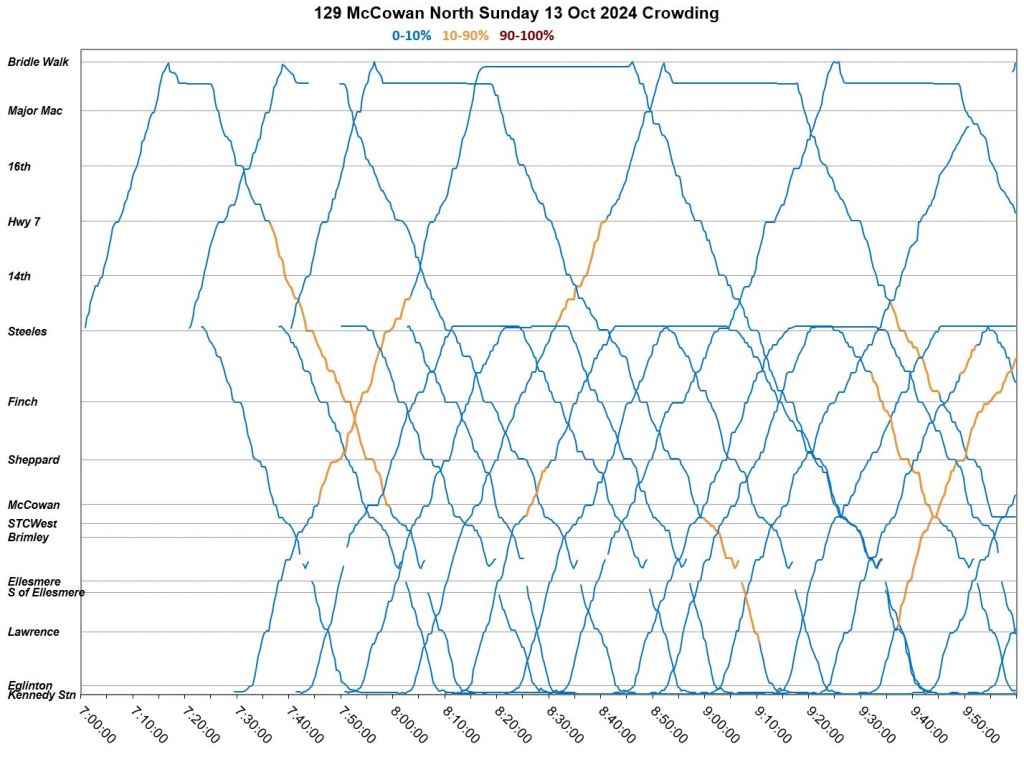
Northbound

Southbound
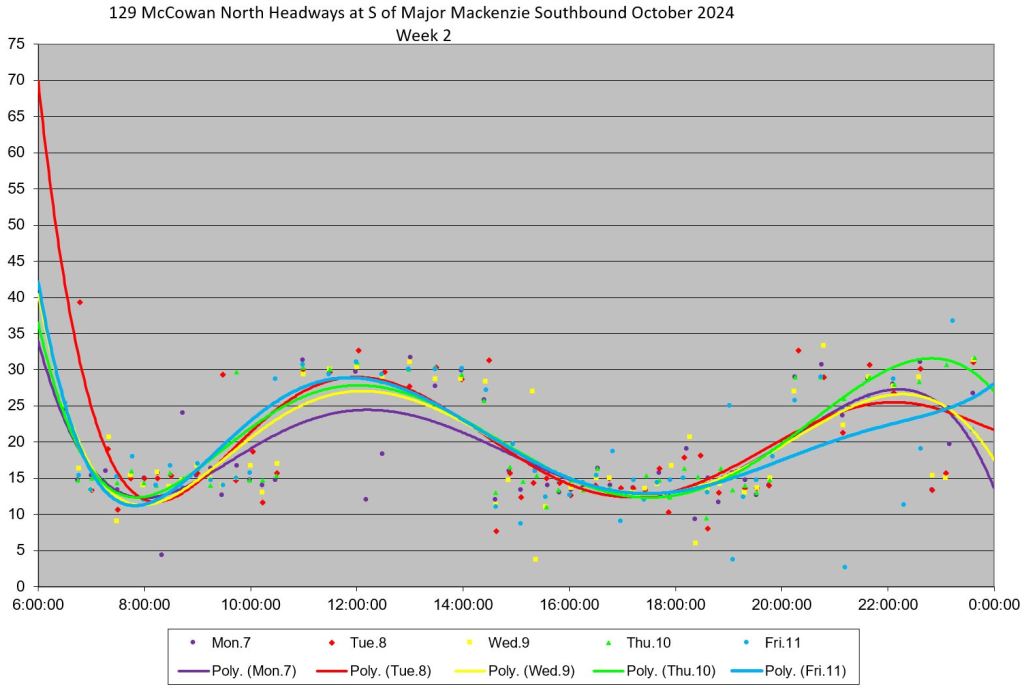
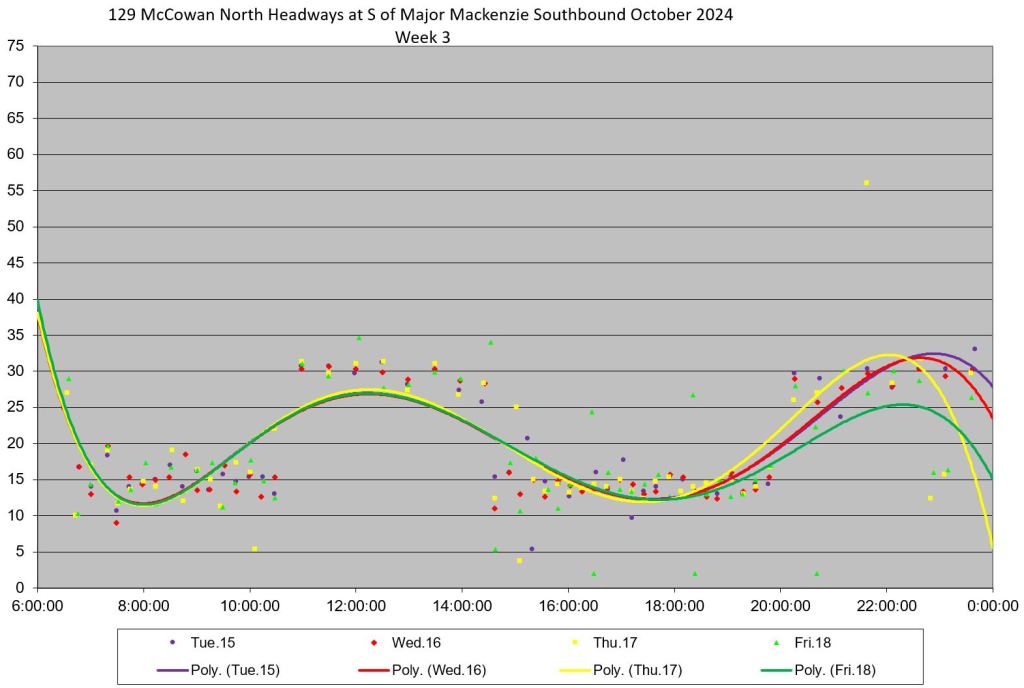
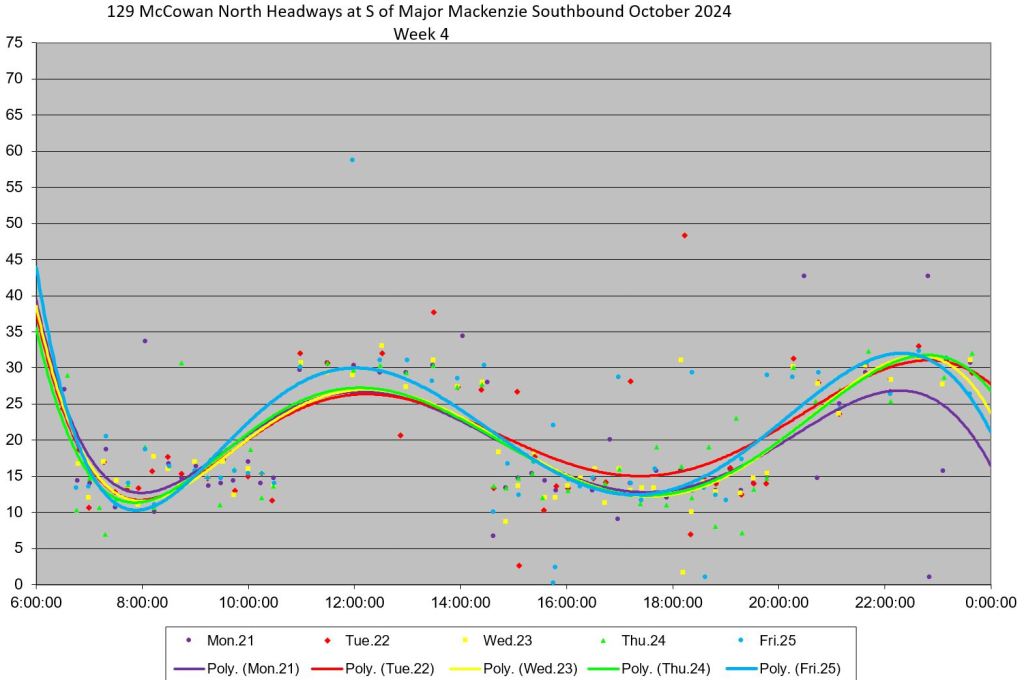
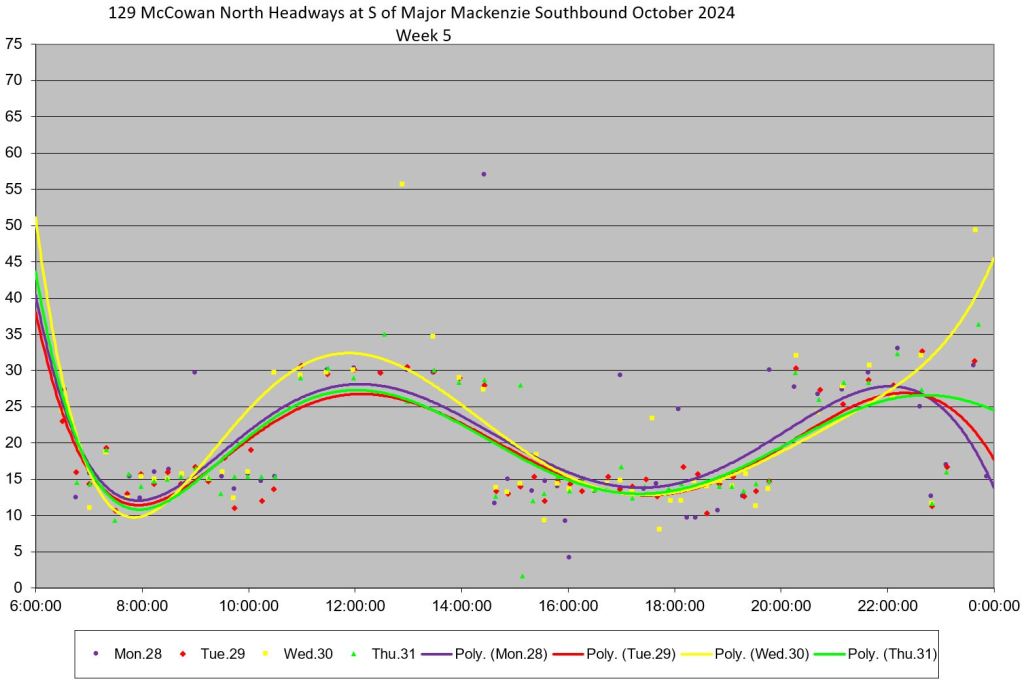
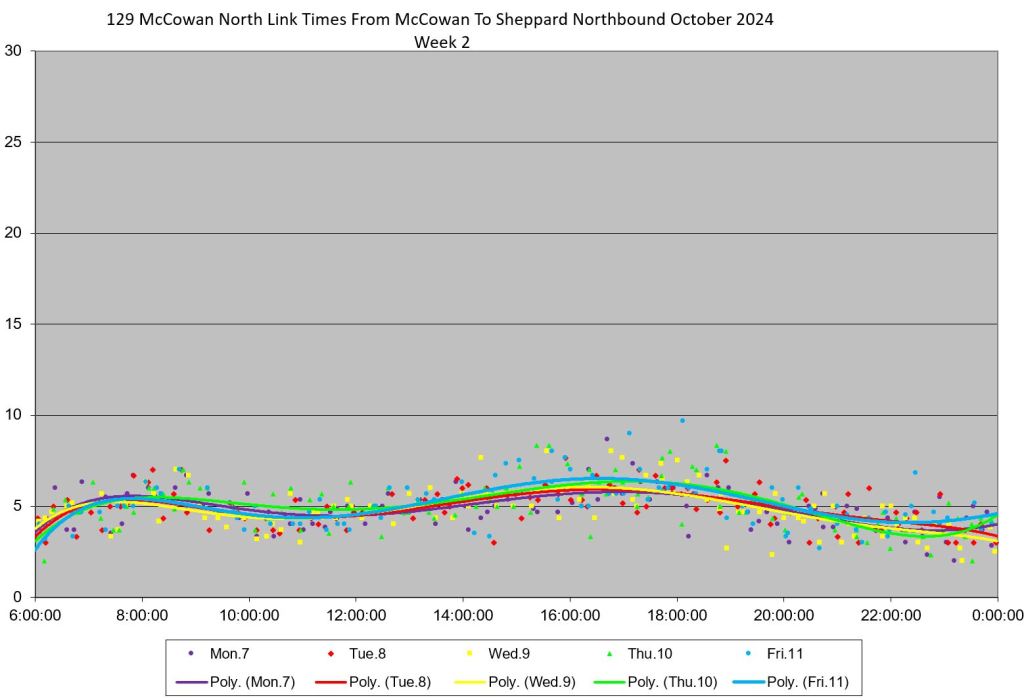
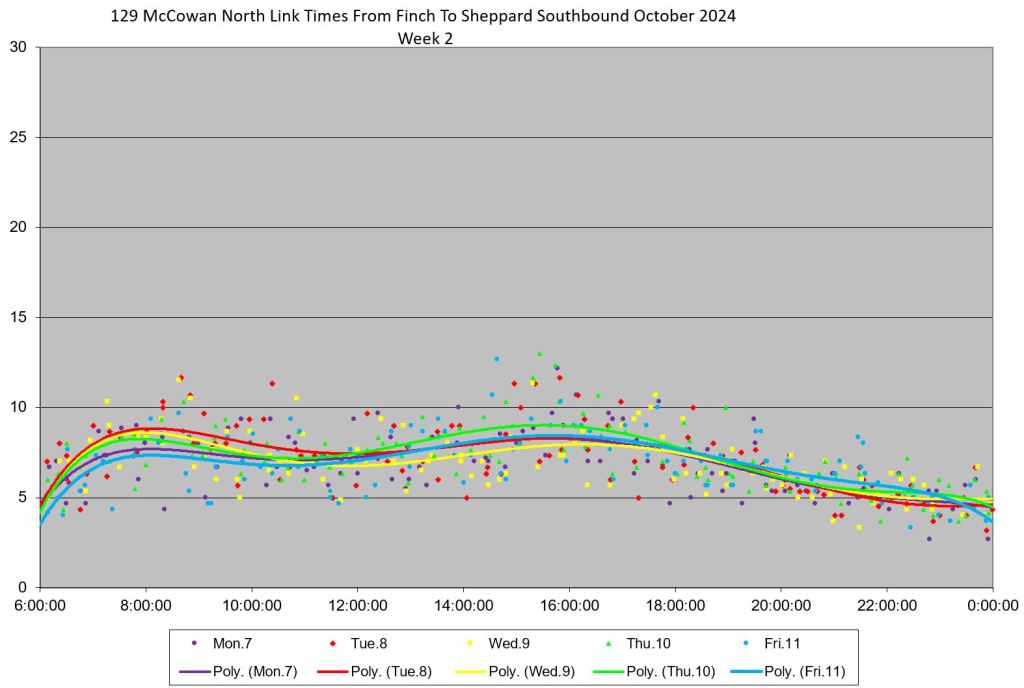
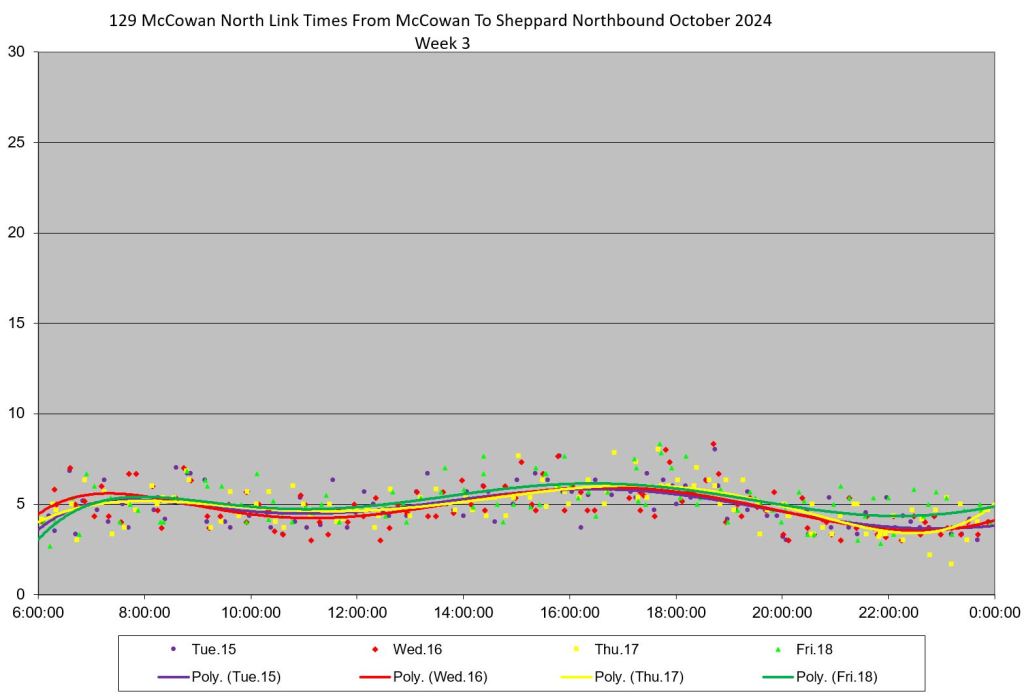
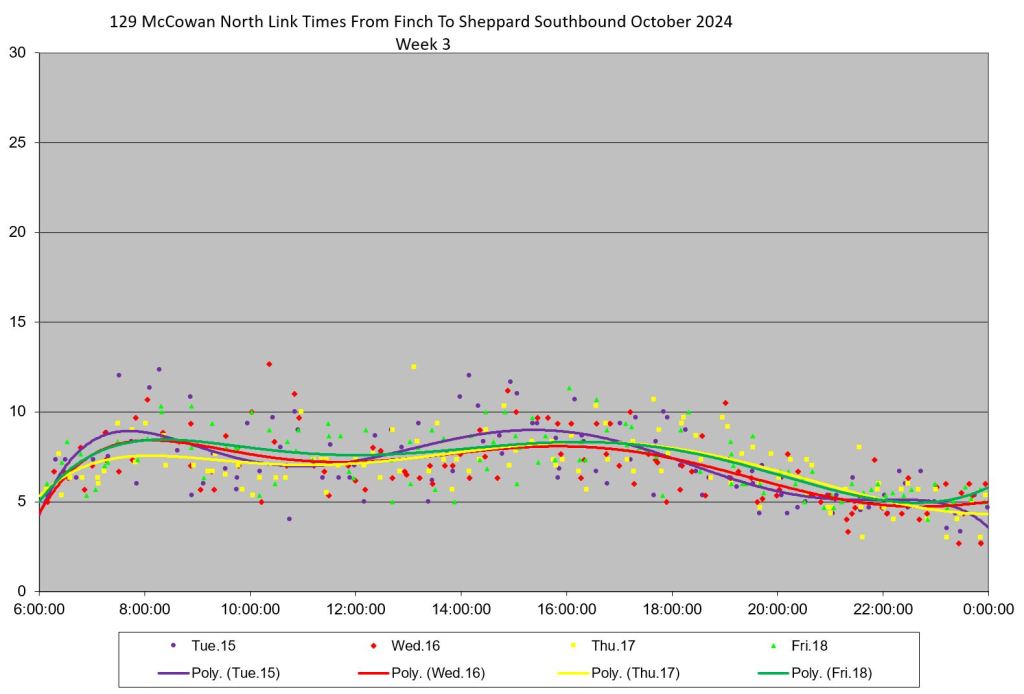
Monthly Details
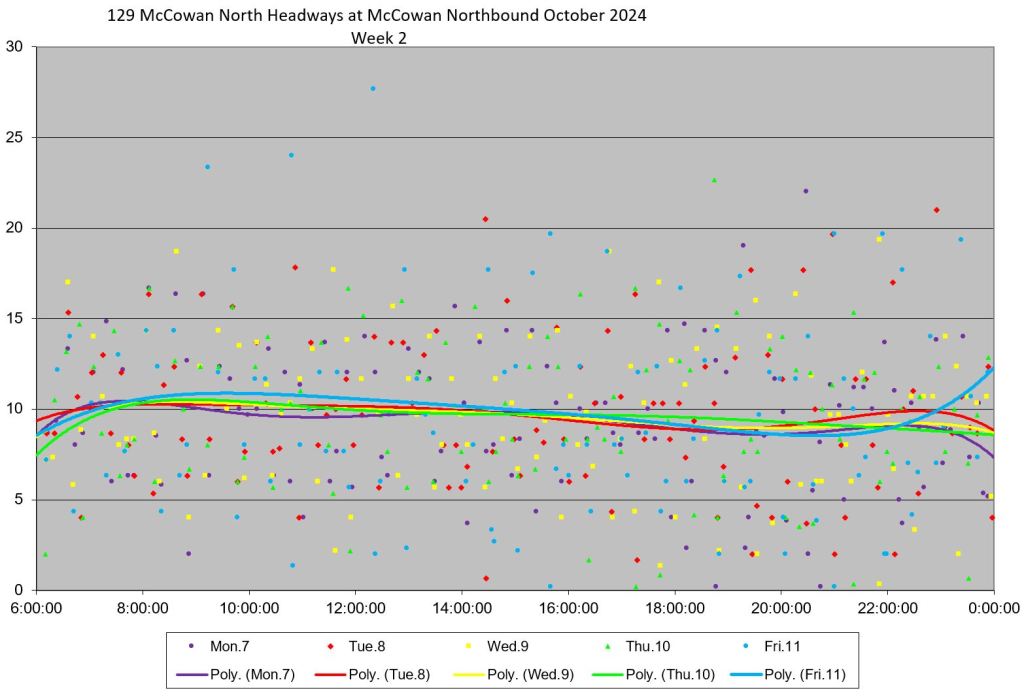
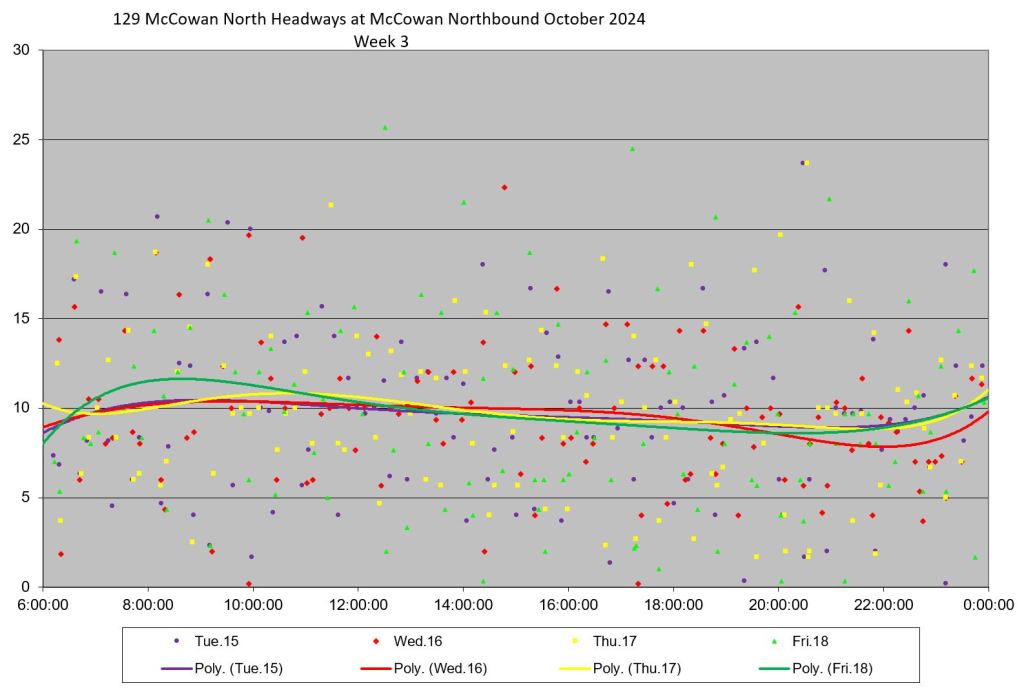
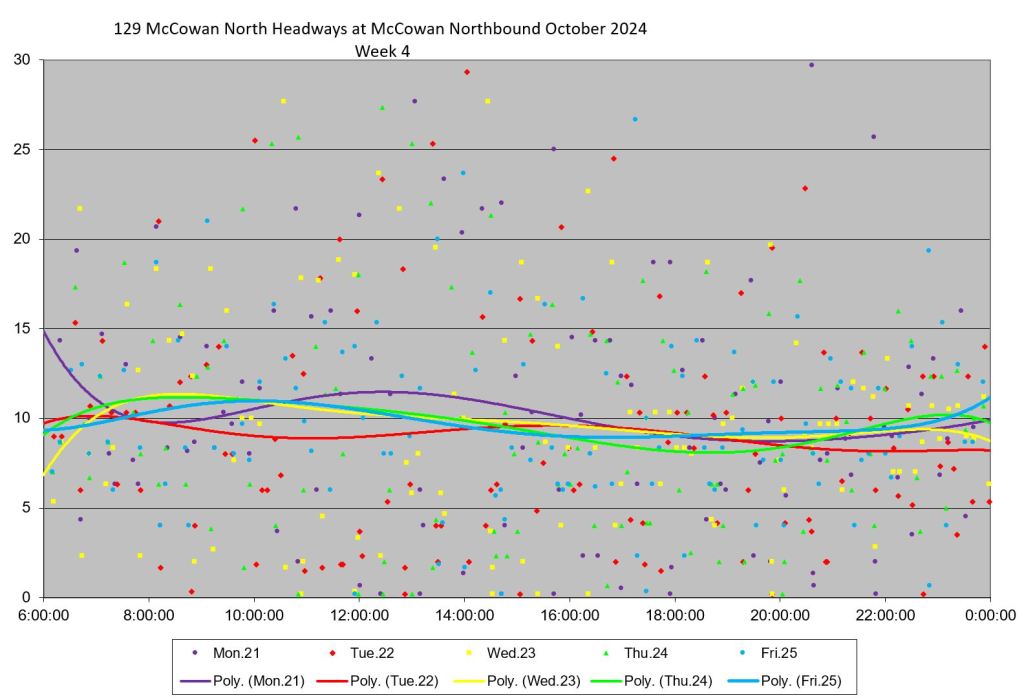
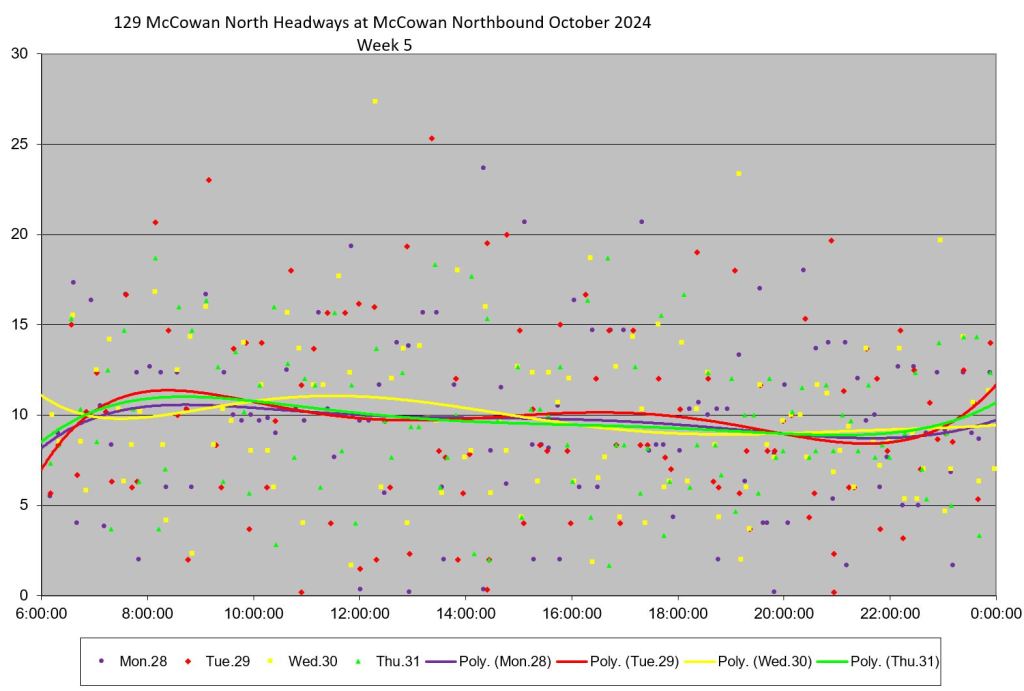
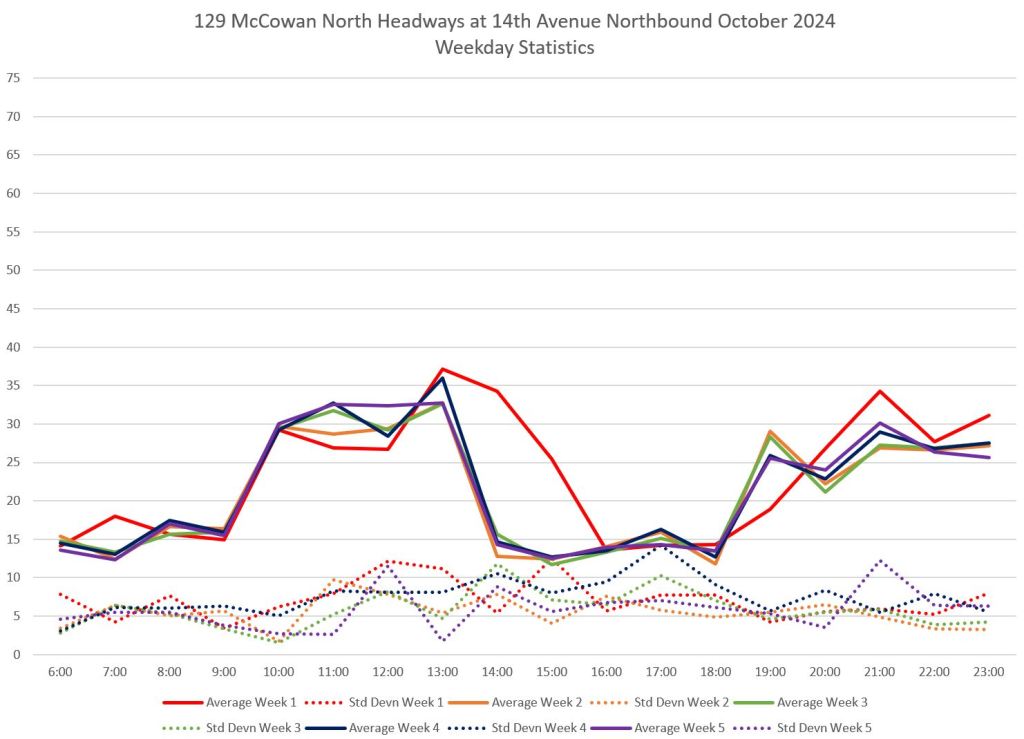
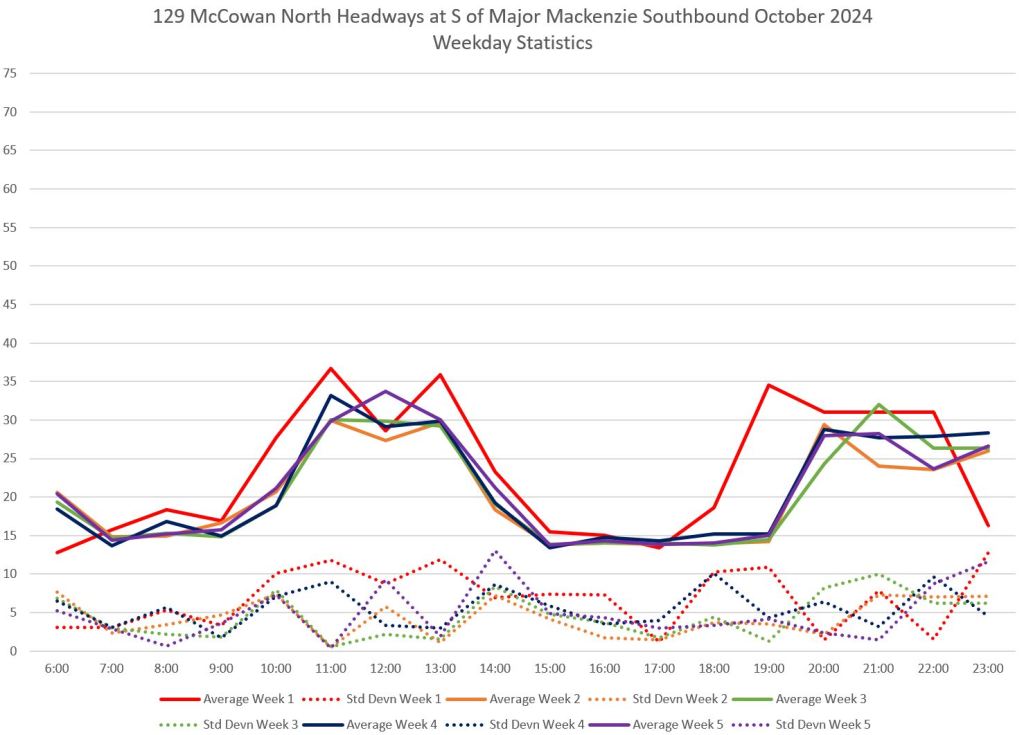
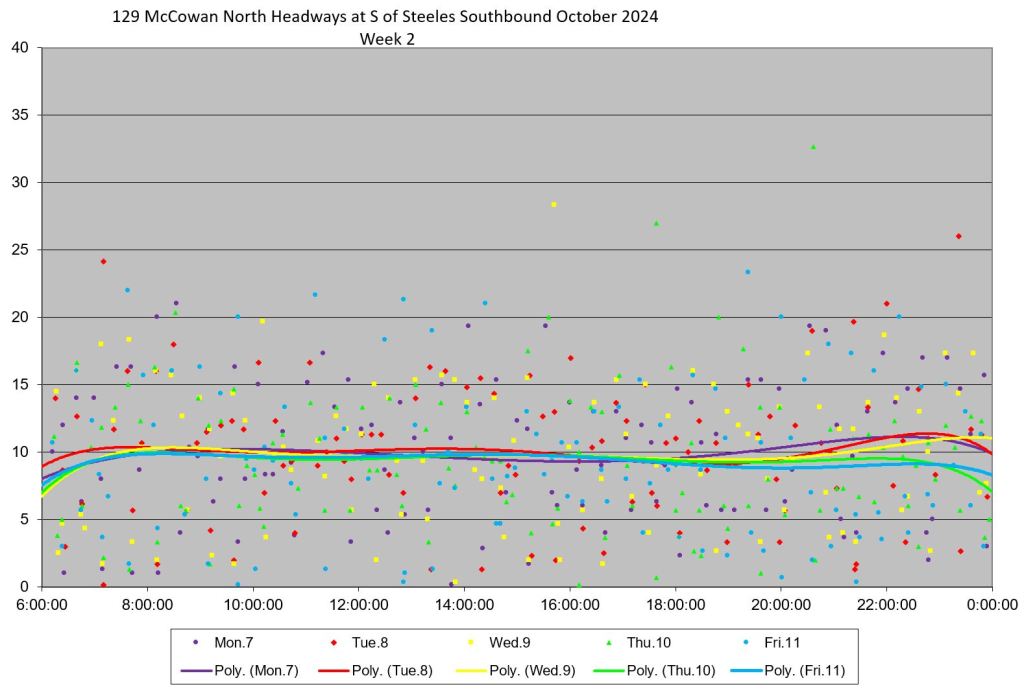
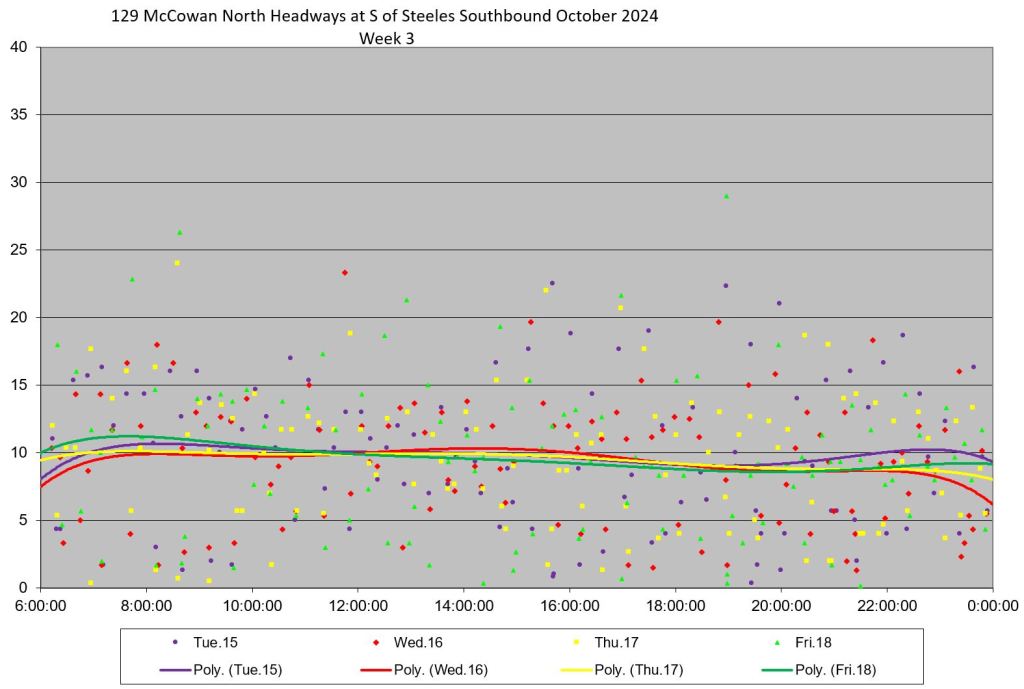
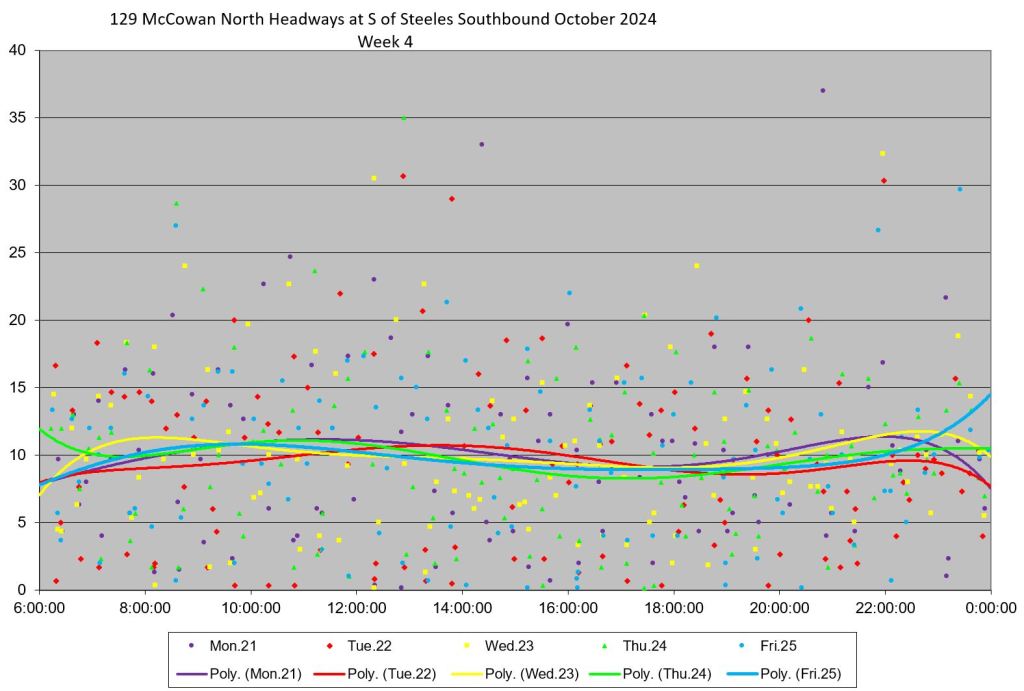
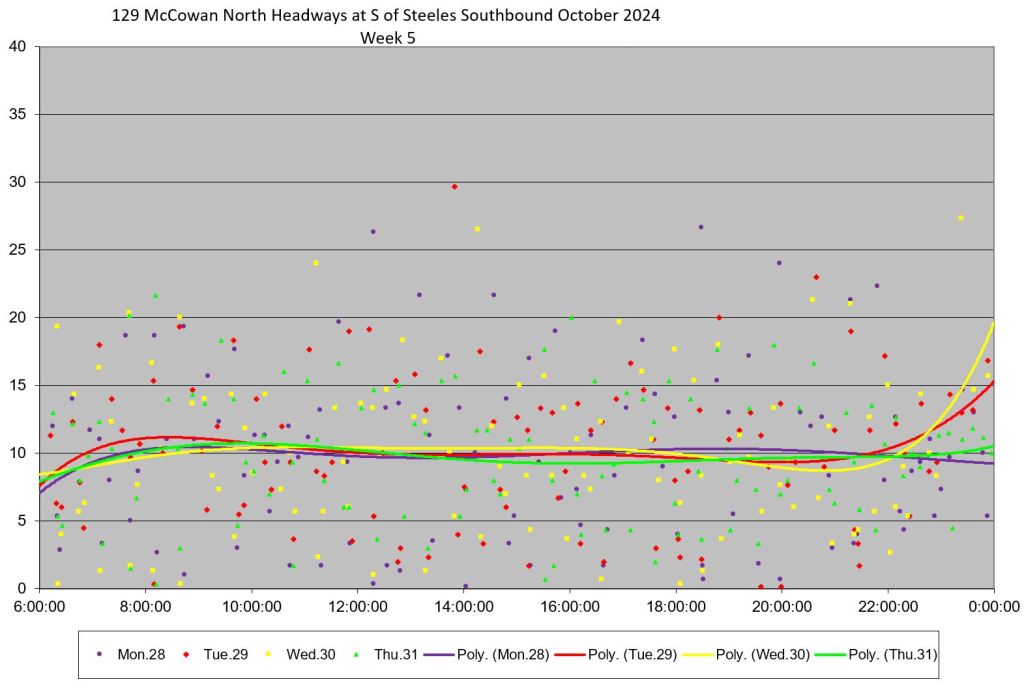
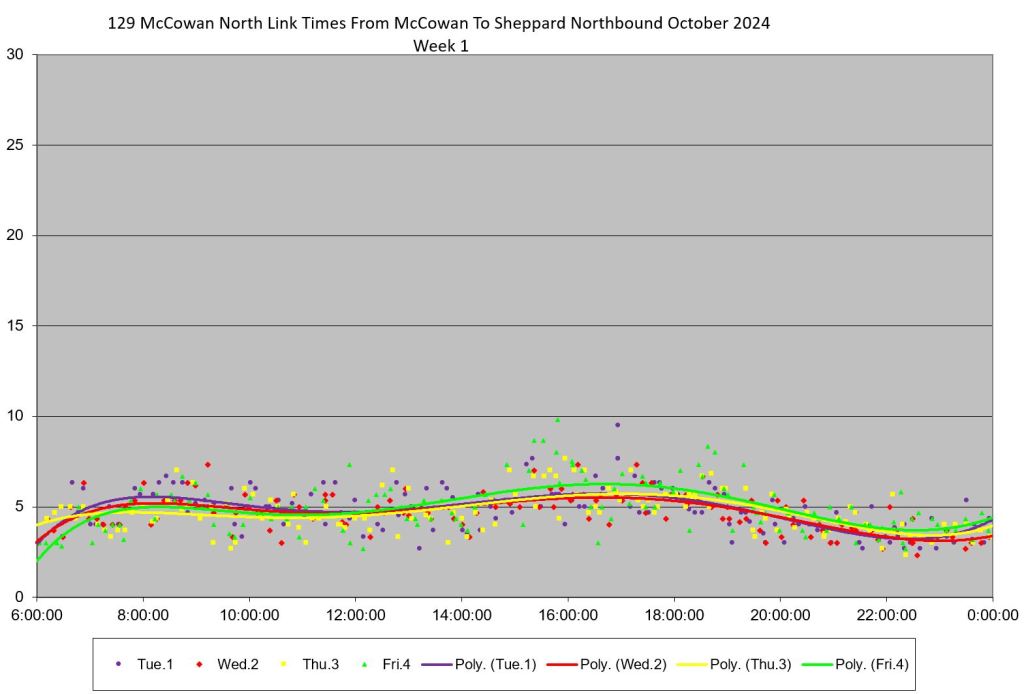
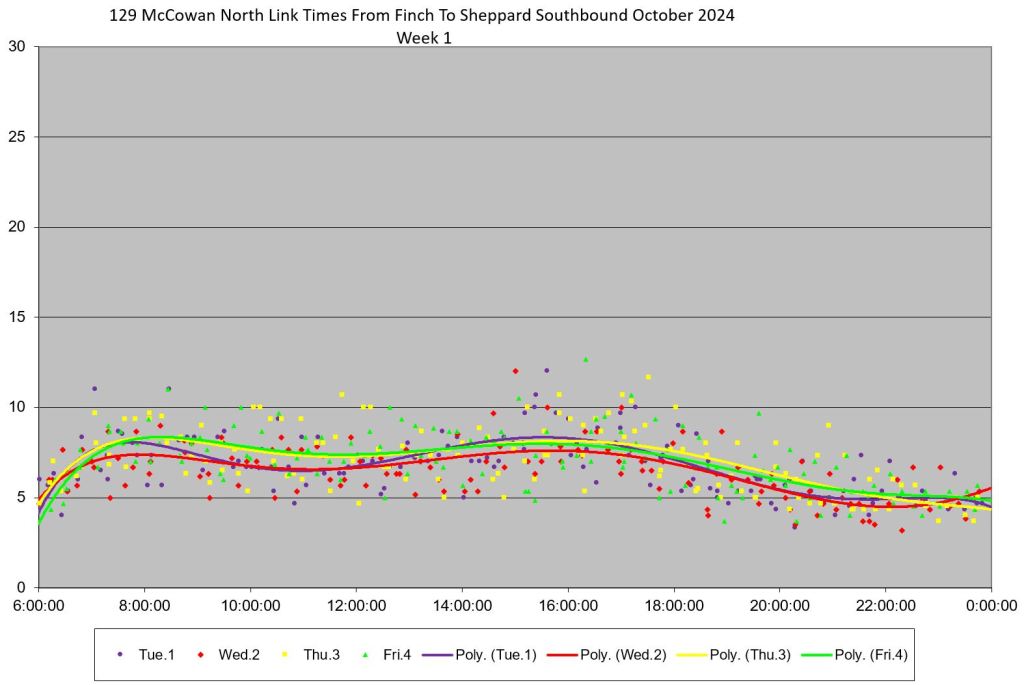
This section reviews detailed headway observations at a few locations. Data for each bus is shown in these charts organized by week, day and time of day to show overall patterns.
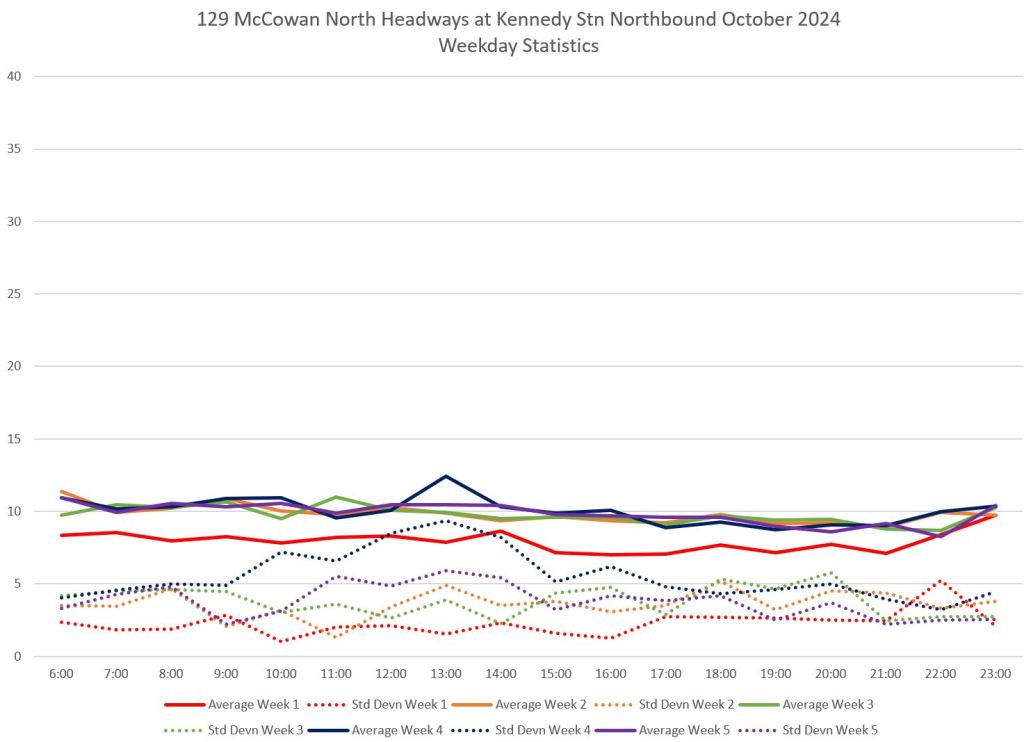
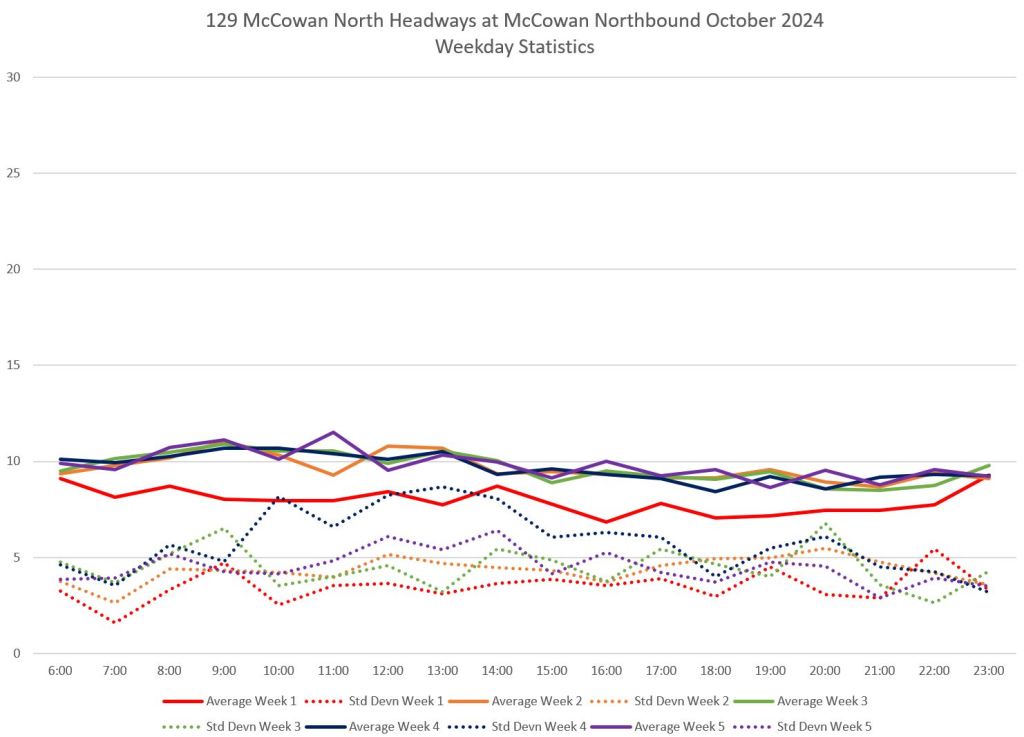
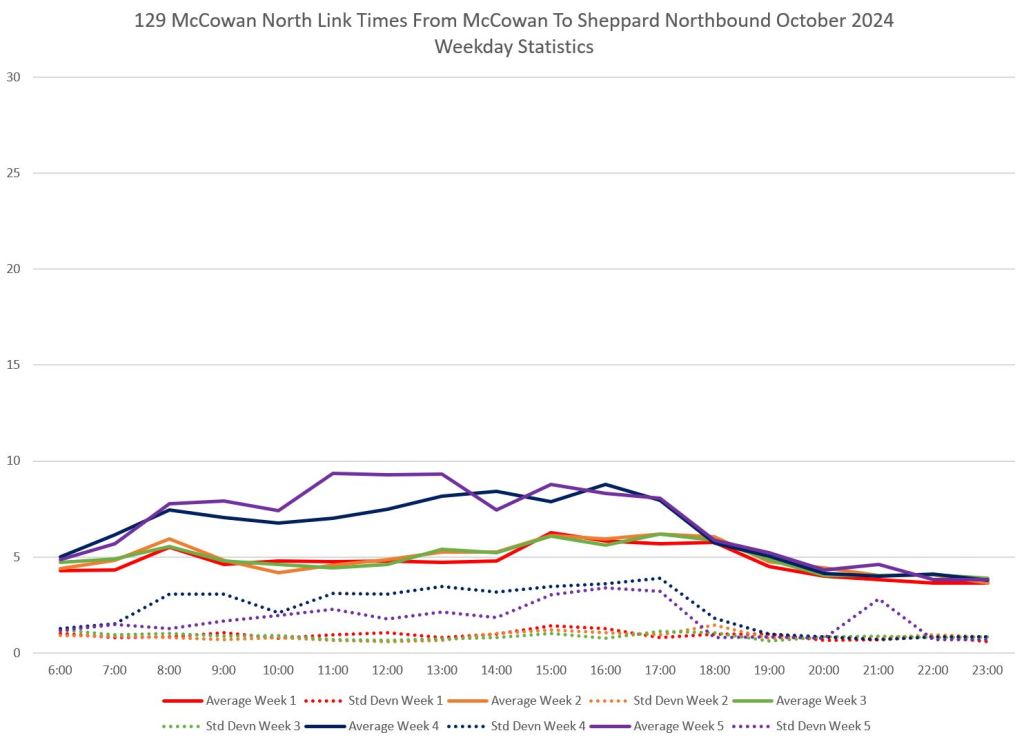
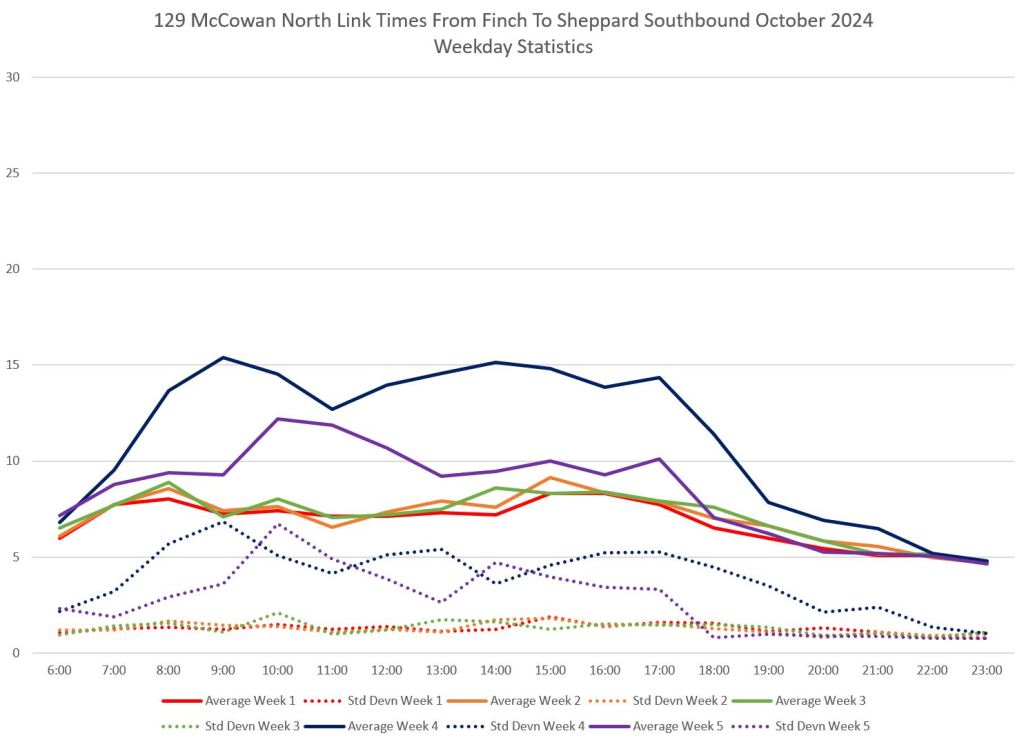
The first chart in each group summarizes the statistics for the data with solid lines showing the average hourly values, and dotted lines showing the standard deviation (a measure of scatter) in the values. Particularly at terminals, a low SD value is important to demonstrate headways close to the average value. In this case, the scheduled uneven headways make low SD values impossible.
A few notes about the statistics:
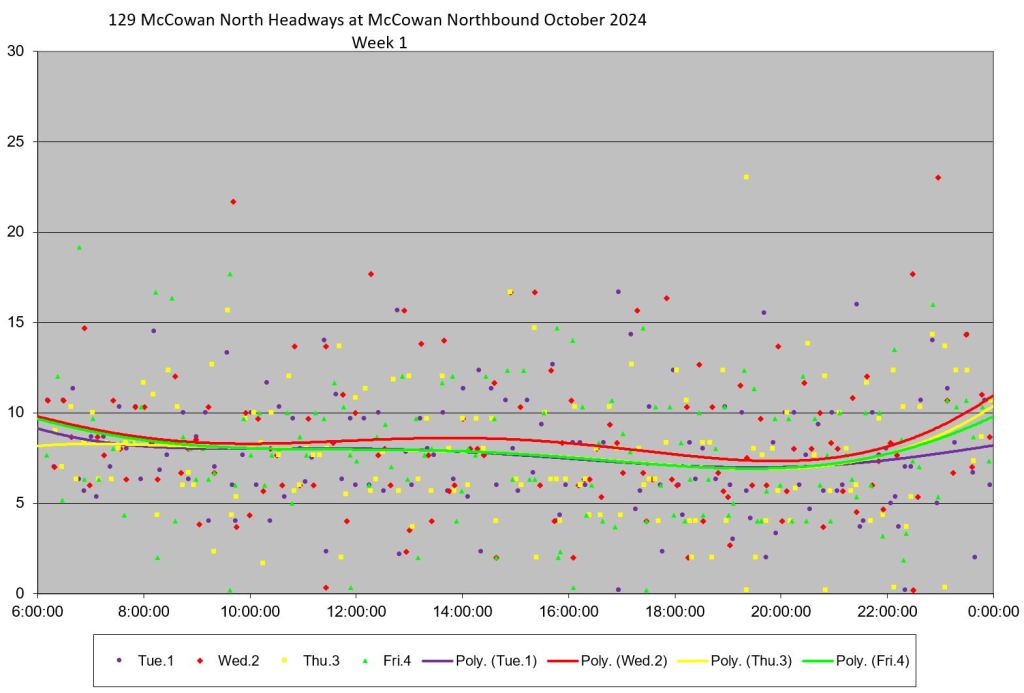
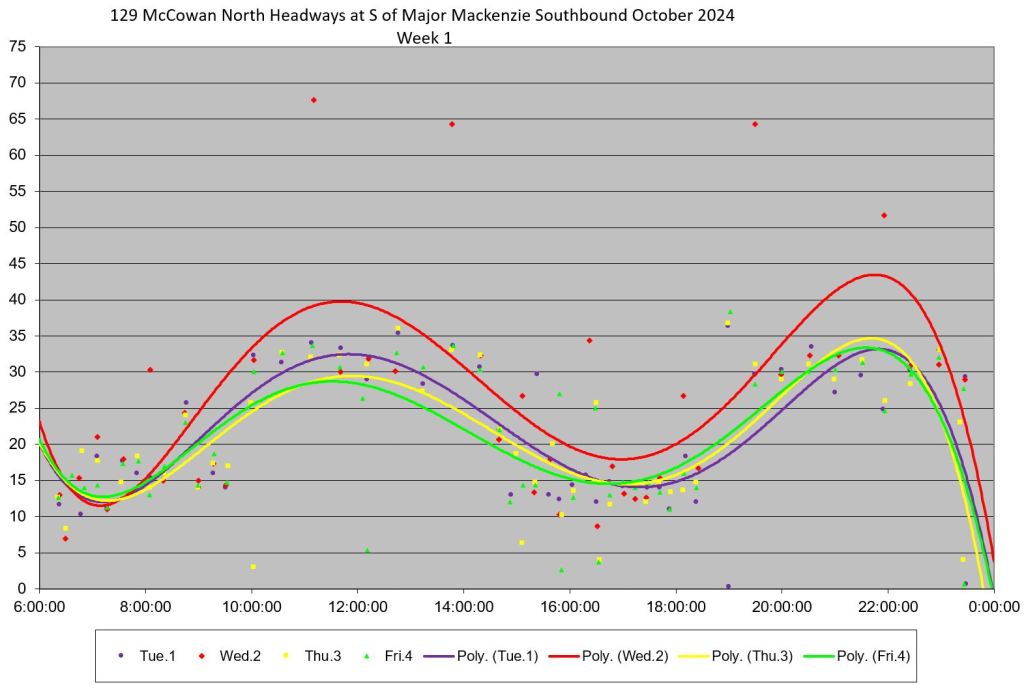
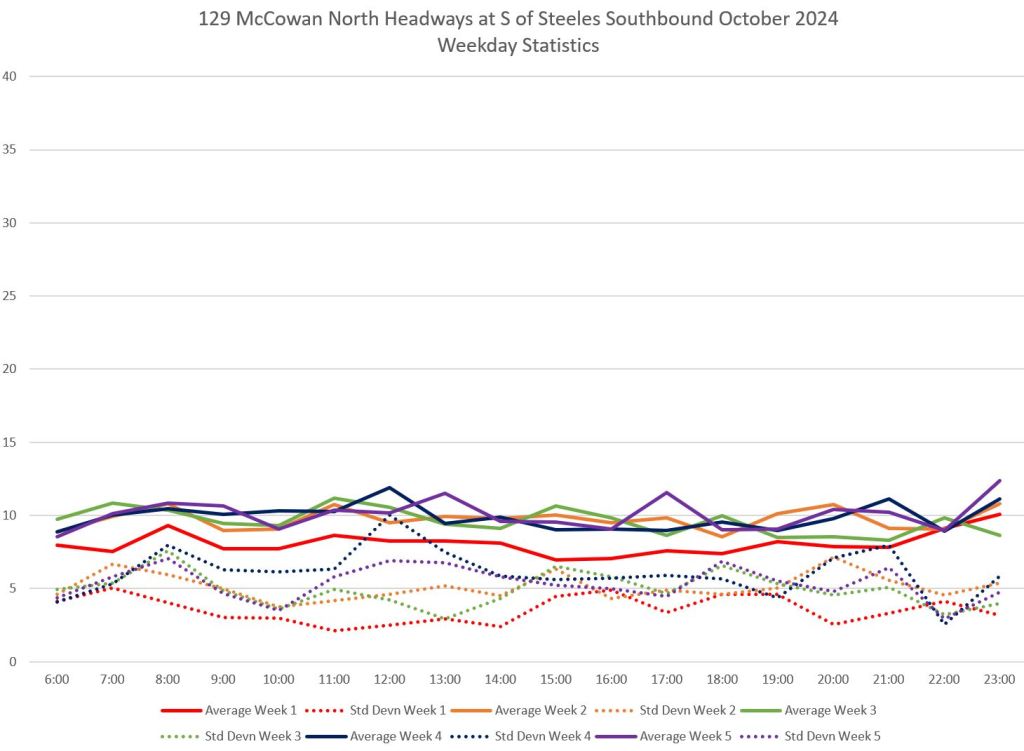
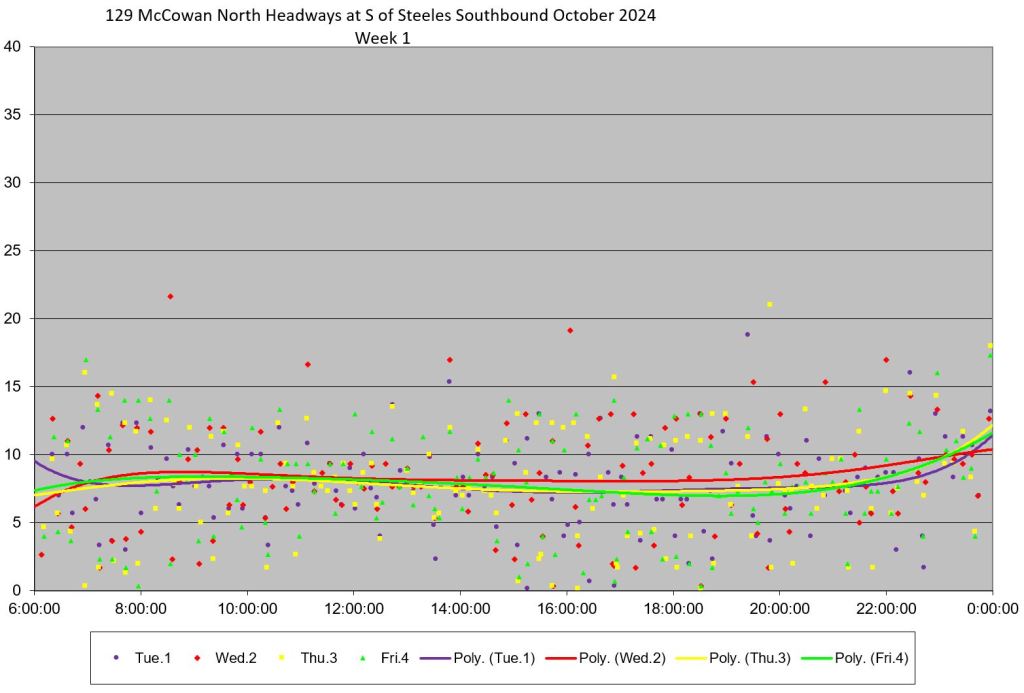
- Week 1 (red) is the old schedule which had regularly spaced service, and more buses because the 129B operated with standard 12m vehicles. The average headway is lower as is the SD for much of the day.
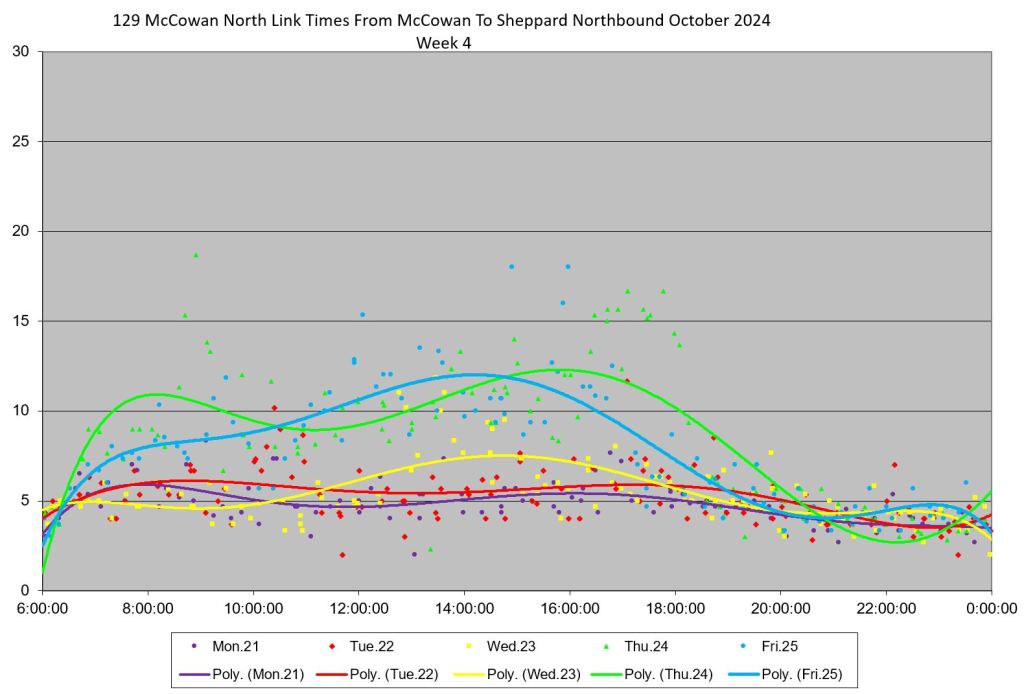
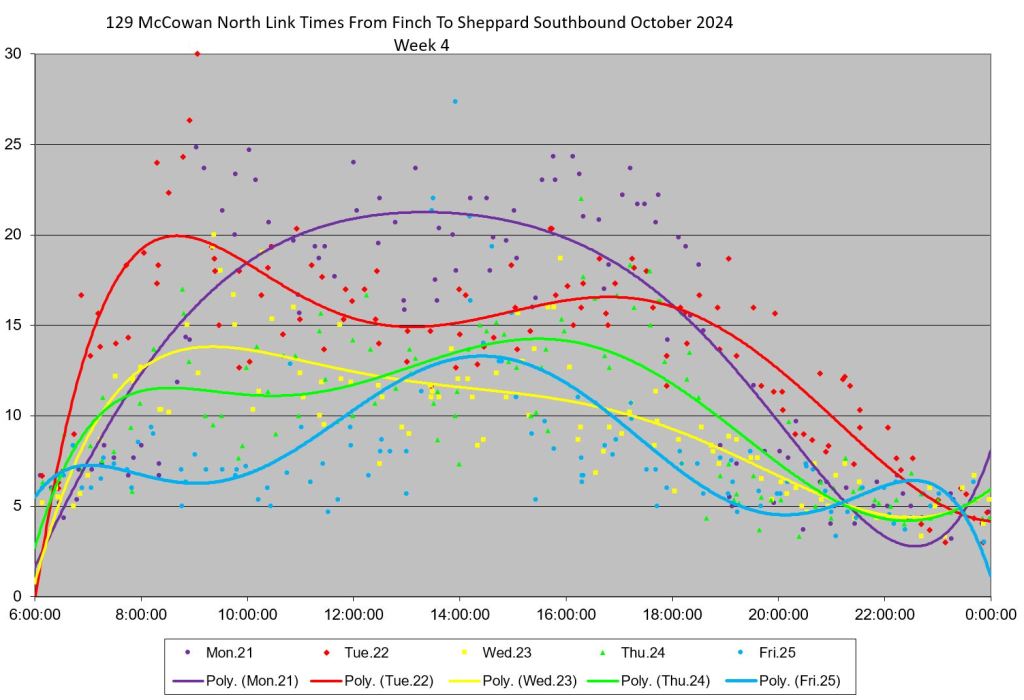
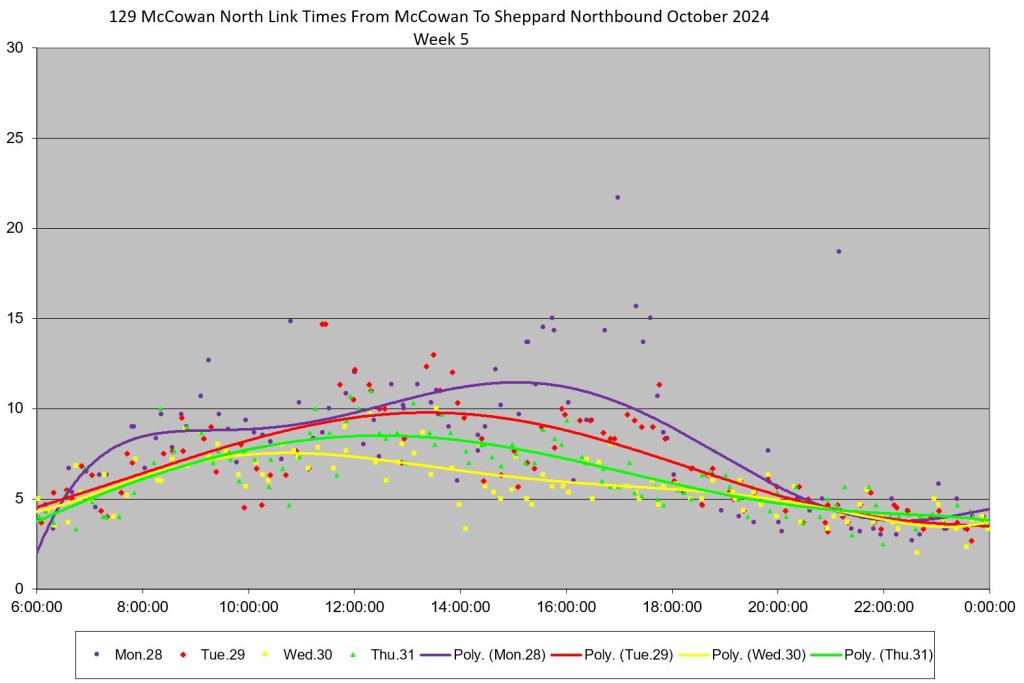
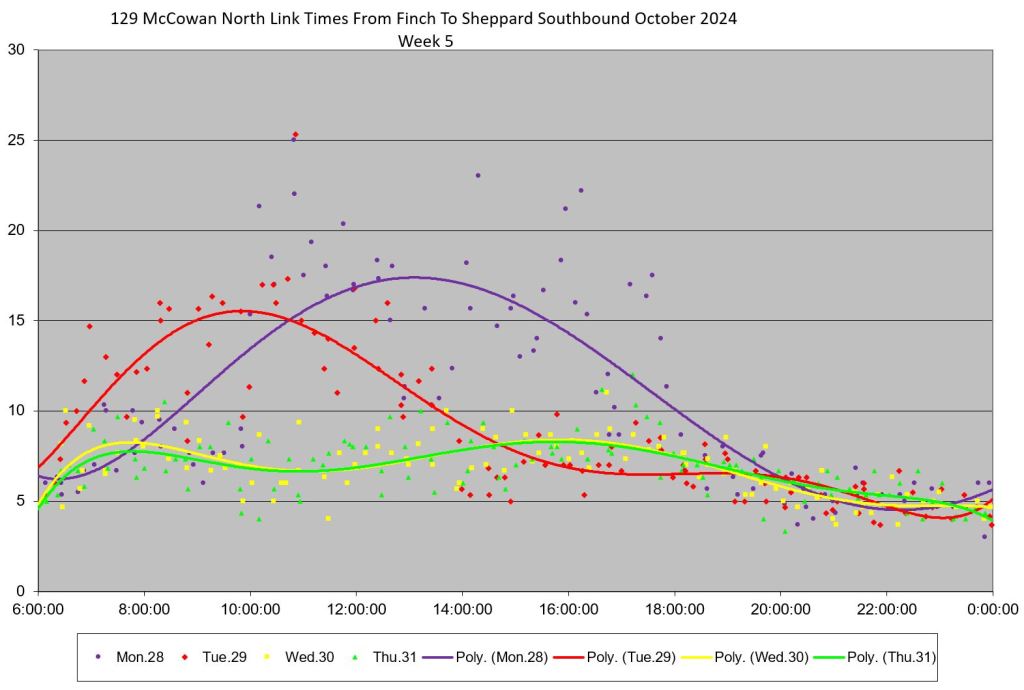
- Weeks 4 and 5 (blue and purple) were affected by construction at Sheppard and McCowan which produced substantial delays for several days late in the month. This was reflected in more scattered headways all along the route. Although the averages did not change much, the higher SD value values show less reliable service in those weeks. (Charts showing the change in travel times near Sheppard are later in the article.)
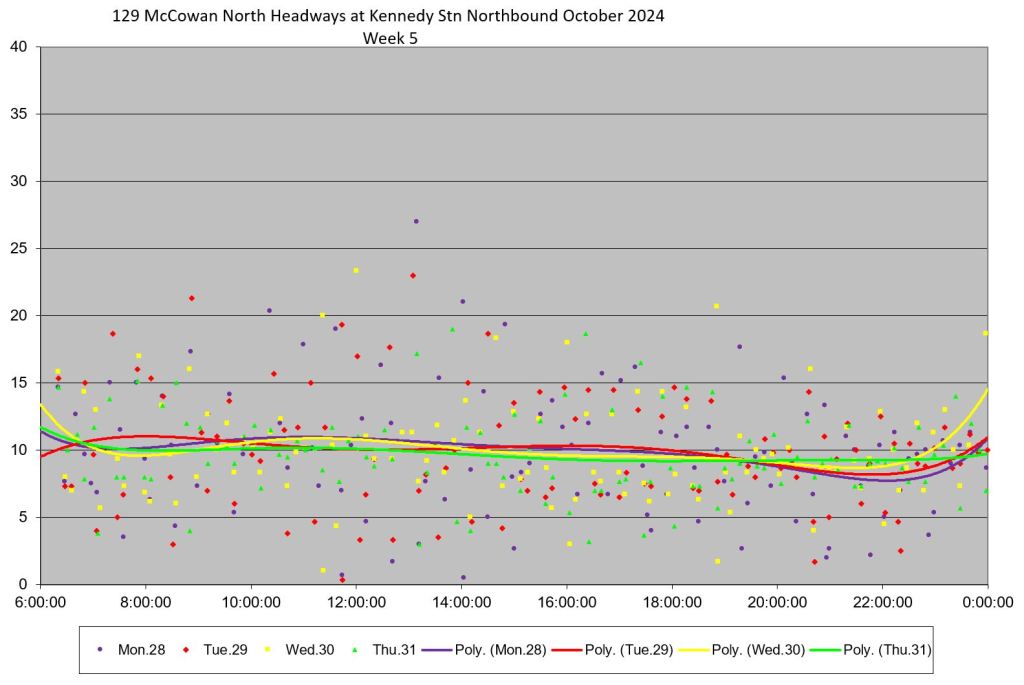
Kennedy Station Northbound
The disruption of service is visible with much more scatter in the headway values in weeks 4 and 5. Headways over 20 minutes and under a few minutes are more common in these weeks.
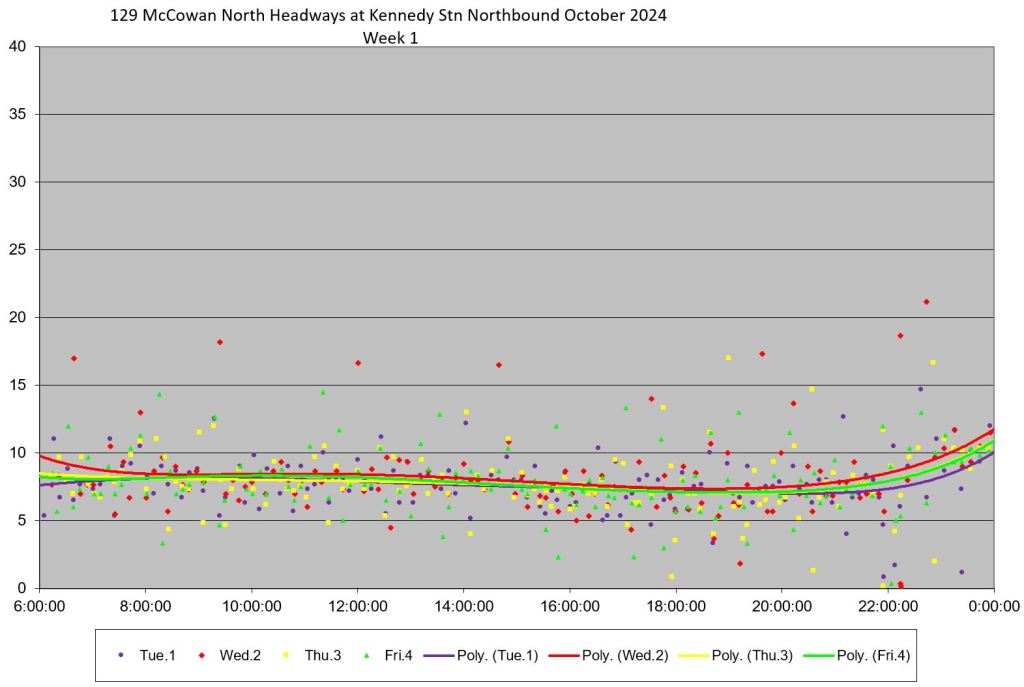
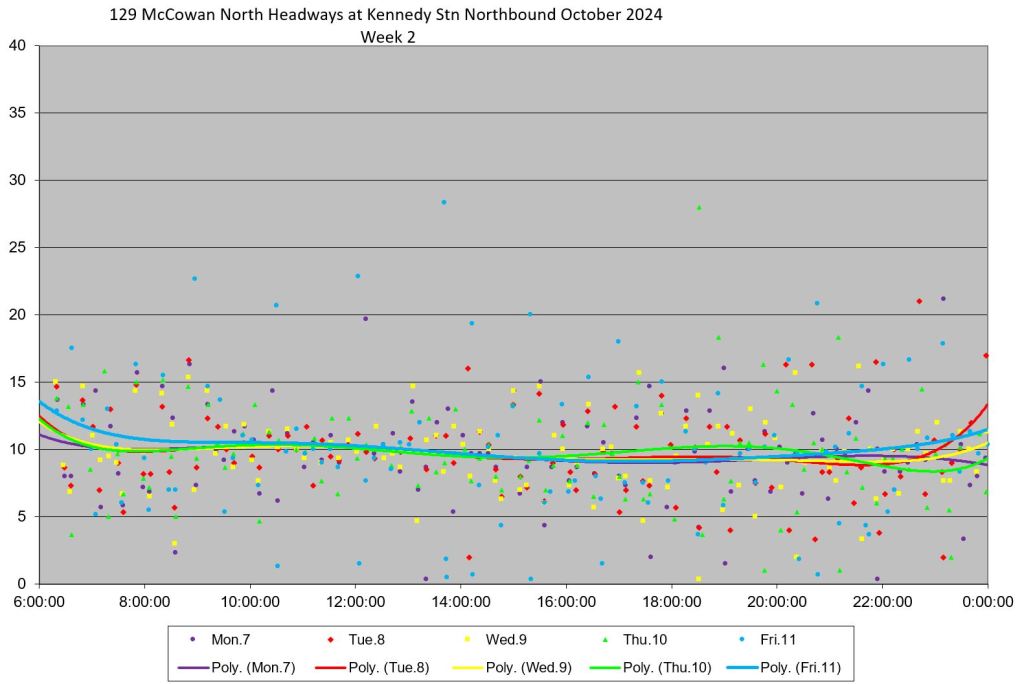
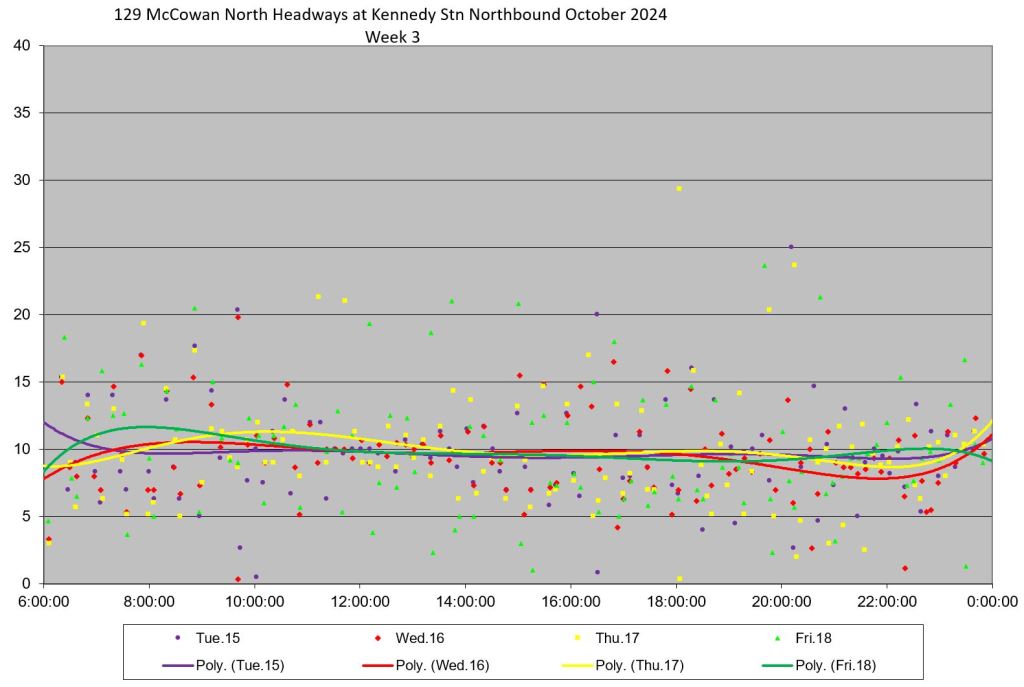
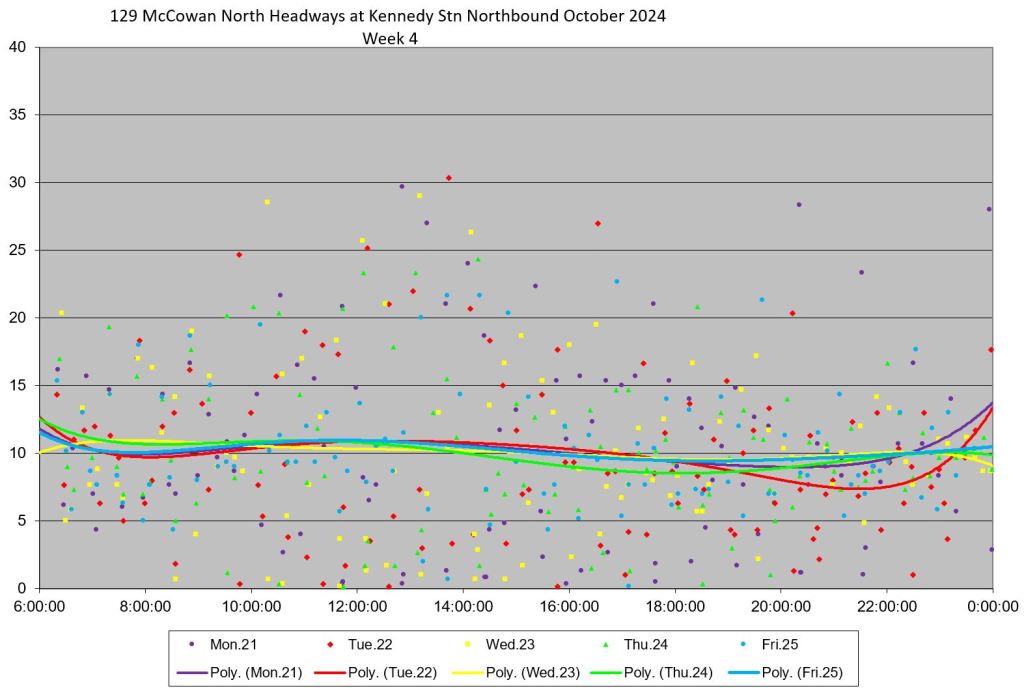
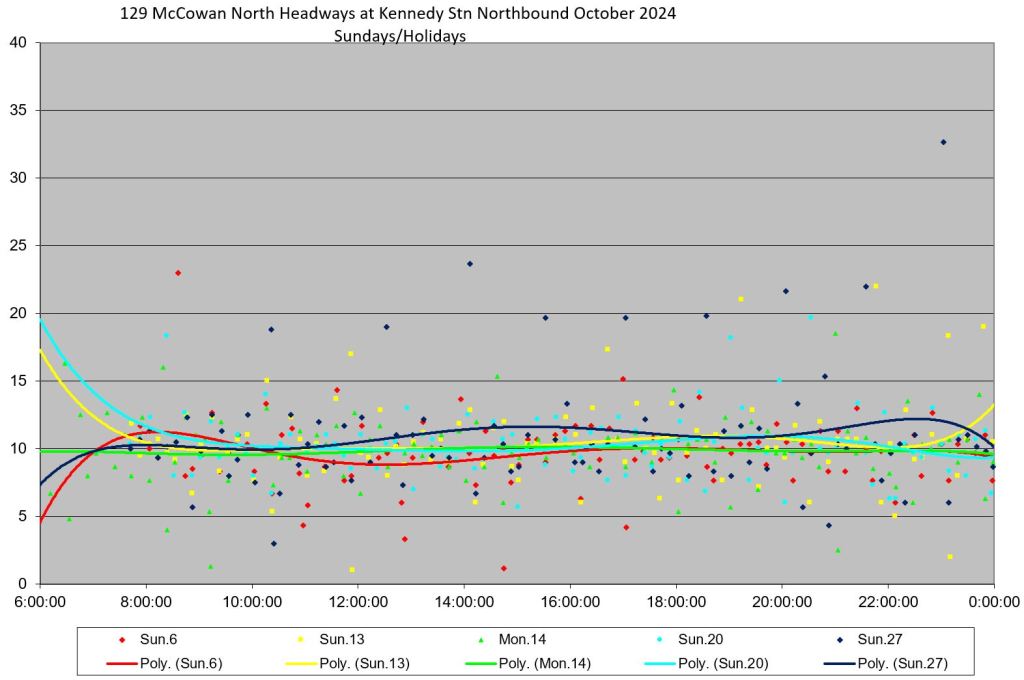
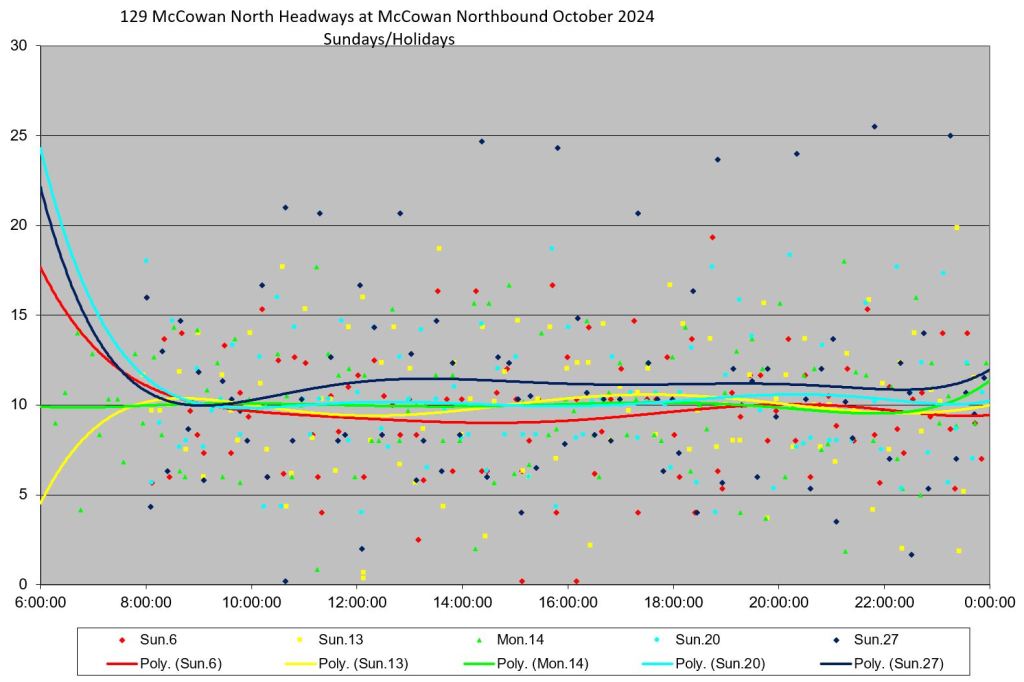
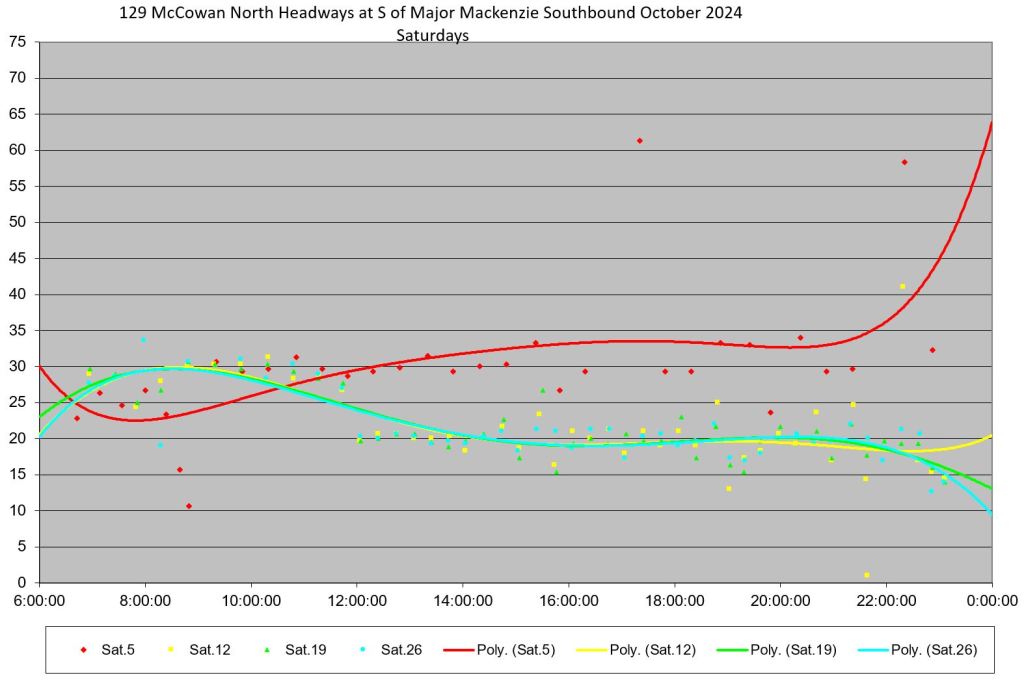
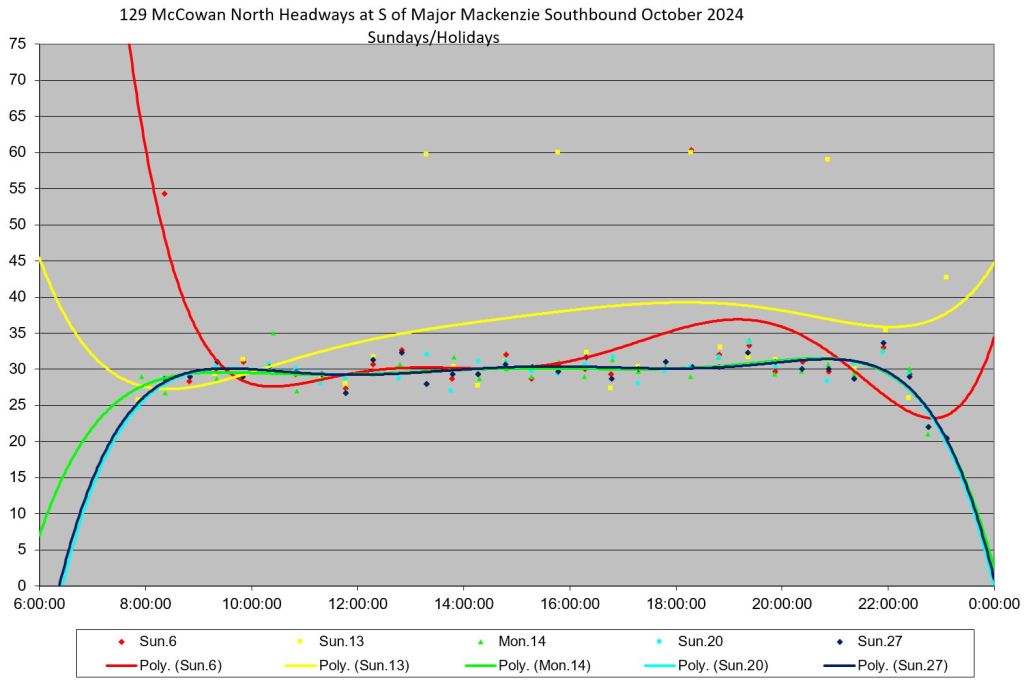
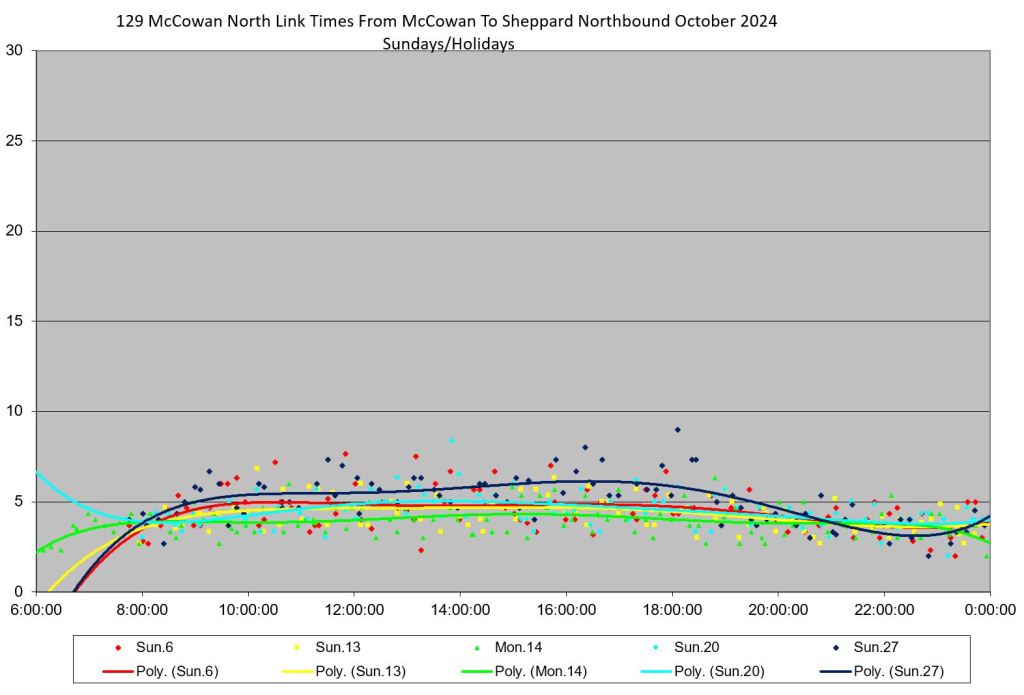
Weekend service at Kennedy Station shows more concentrated headway values on Saturday, and for most Sundays. However, on October 27, there is a repeating pattern of headways about double the other values indicating that a bus was missing. This pattern also implies that the gap was left in place, not countered by re-spacing the service. (If this was a case of a pair of buses running as a bunch, each long headway dot would have a matching dot near the x-axis for the follower’s short headway, but there are no such dots.)

McCowan Northbound From STC
By the time service leaves STC northbound, the headway values are more scattered than they were at Kennedy Station with SD values for weeks 1-3 higher, and the data points visibly more scattered. Weeks 4-5 are even more scattered than earlier in the month (as the SD values below show), and there is a wide range of values particularly in week 4.
Weekend service from STC northbound, unlike the service at Kennedy Station, shows clear signs of gaps and bunches. On Sunday the 27th, the gaps for the missing bus range up to 25 minutes.
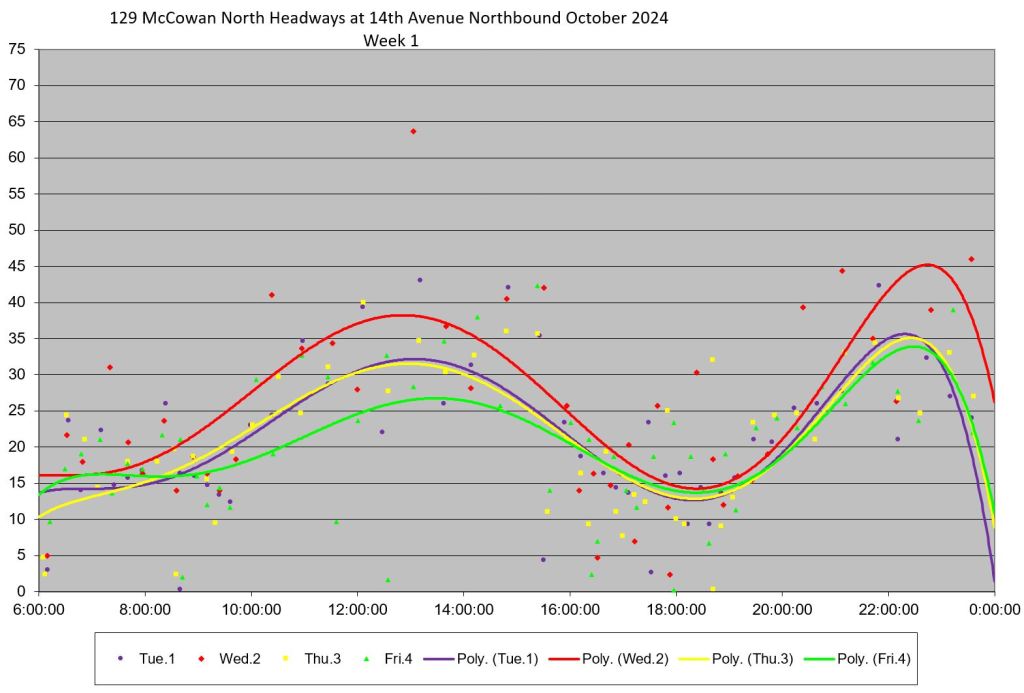
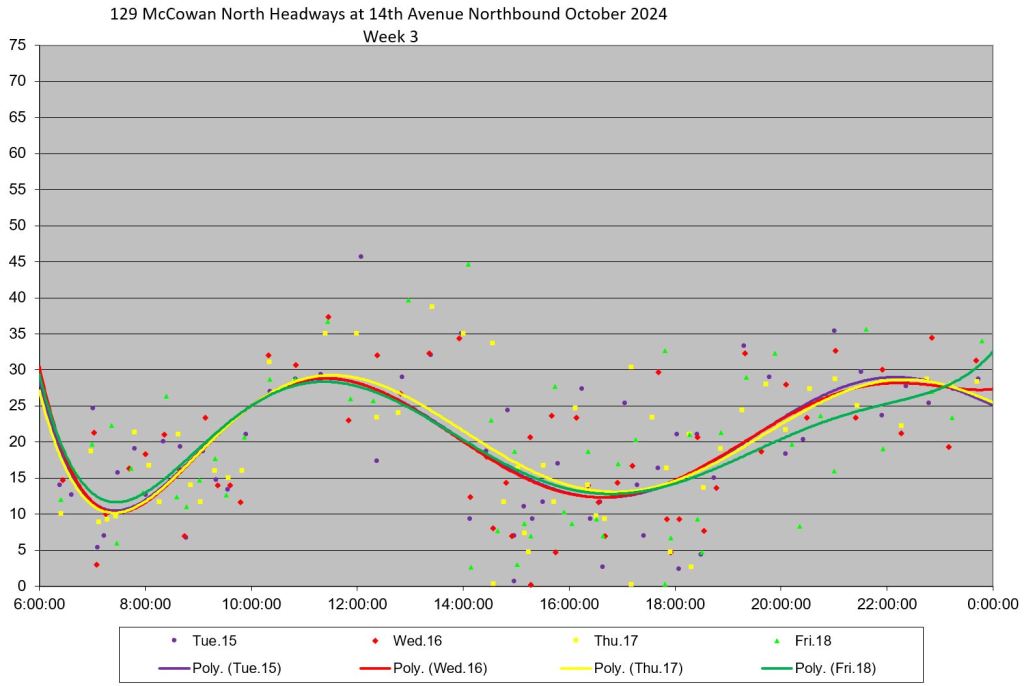
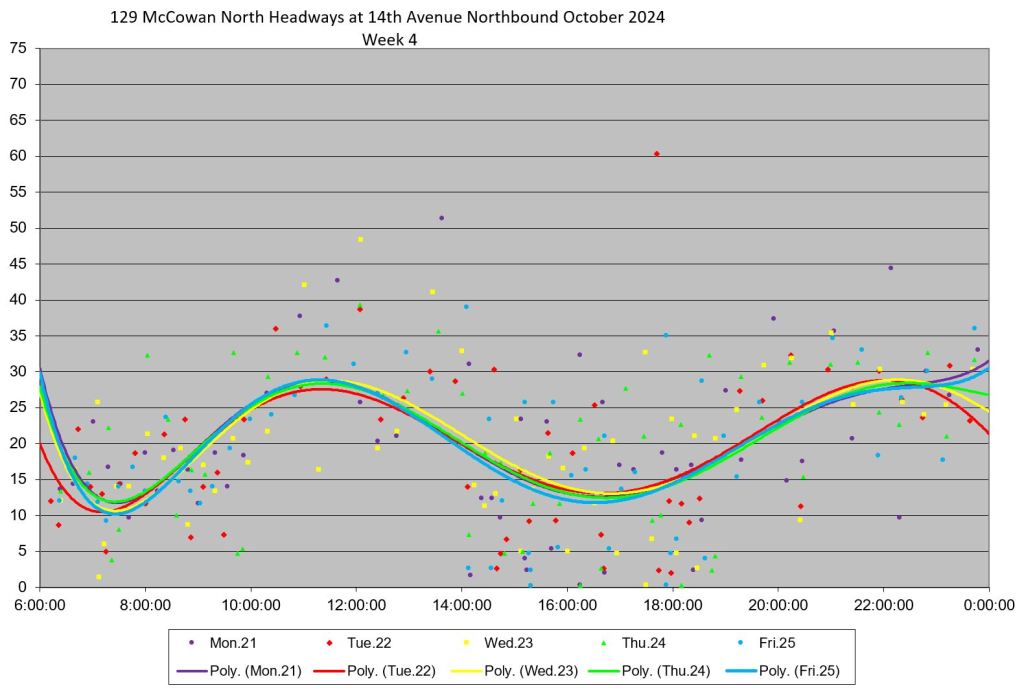
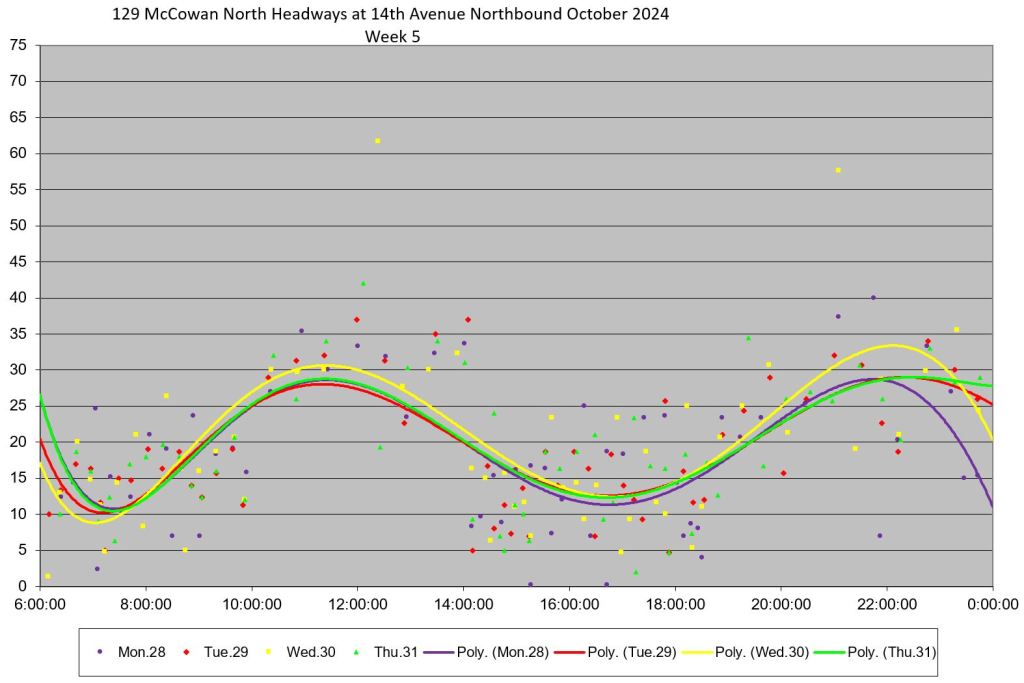
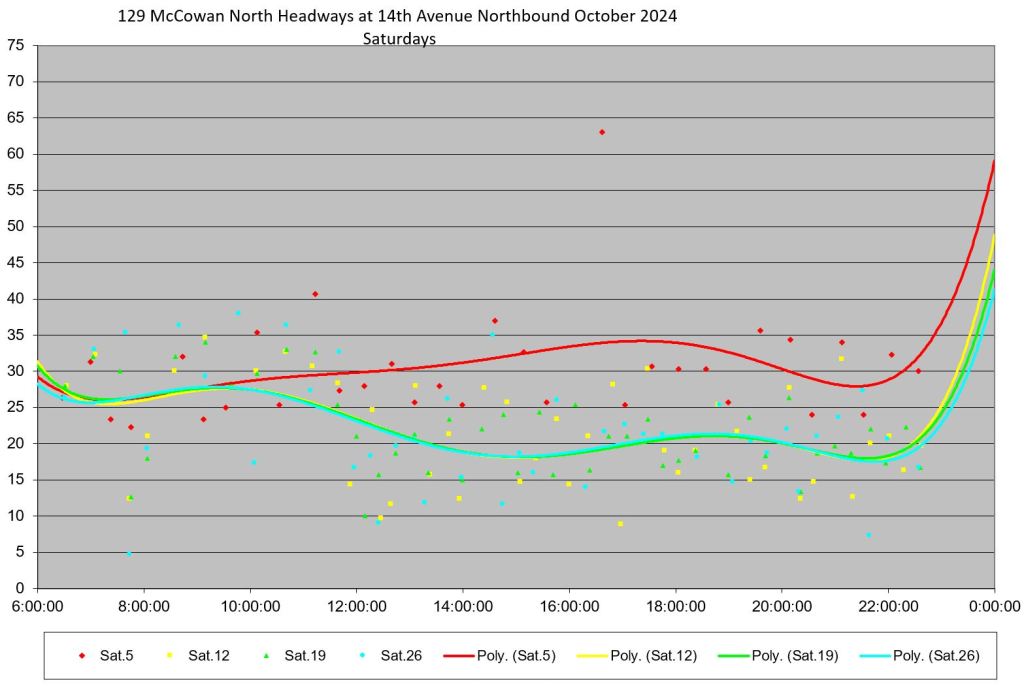
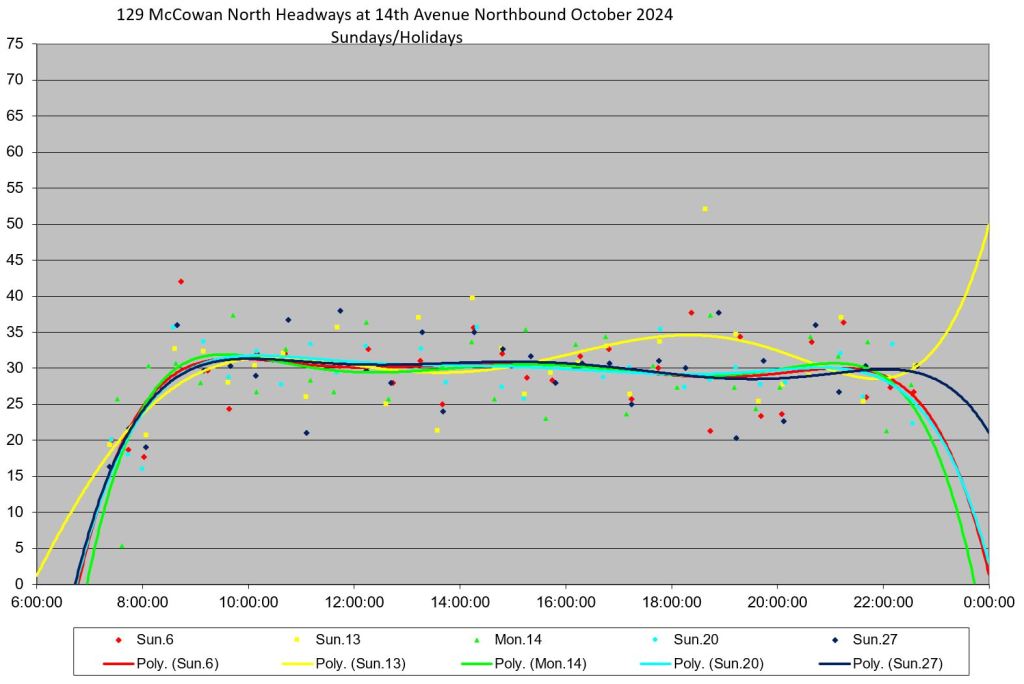
14th Avenue Northbound
Service north of Steeles Avenue is infrequent especially during the daytime, but even in the peak period there is a wide variation in headway values. Week 1 uses the September schedule before service was increased in this area. Weeks 2-5 use the October Schedule. Note especially in week 4 that headways lie over a wide range from a few minute up to half an hour from roughly 2-7pm.
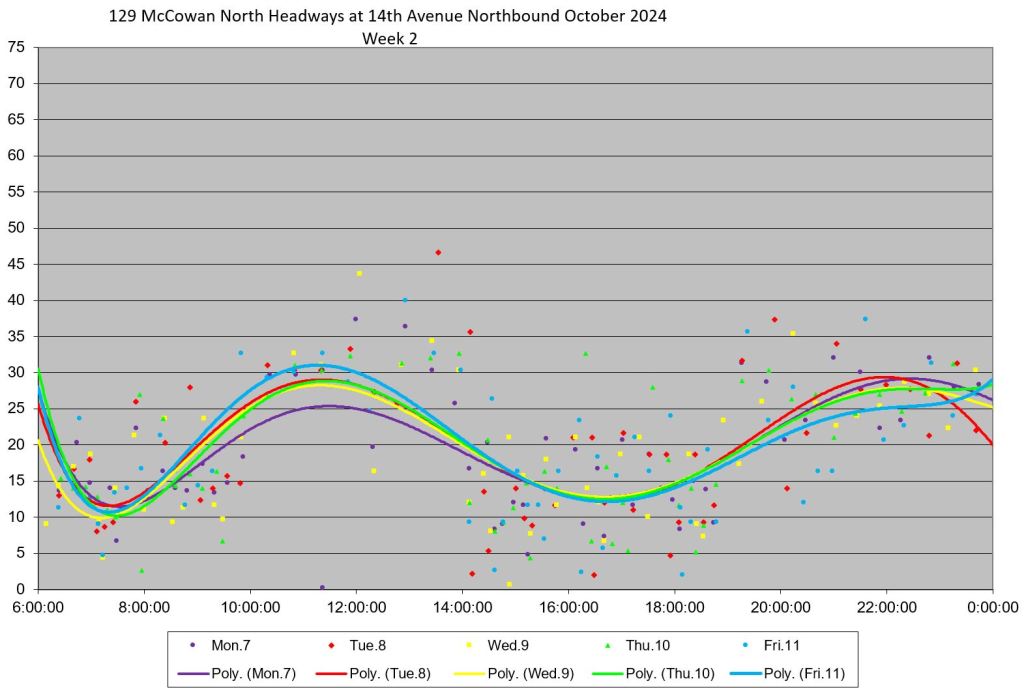
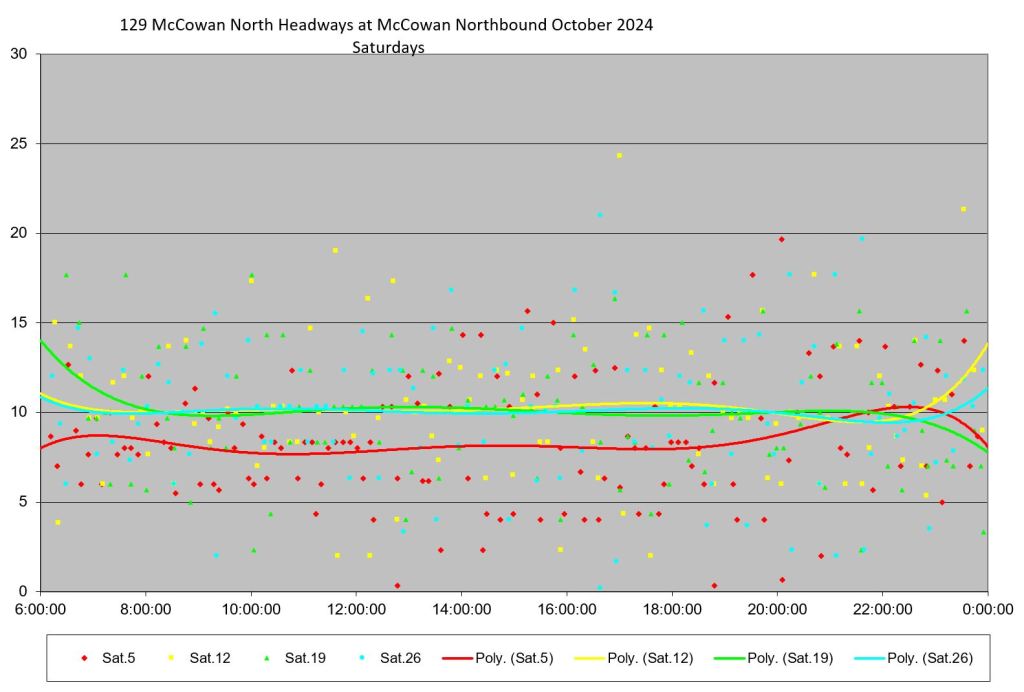
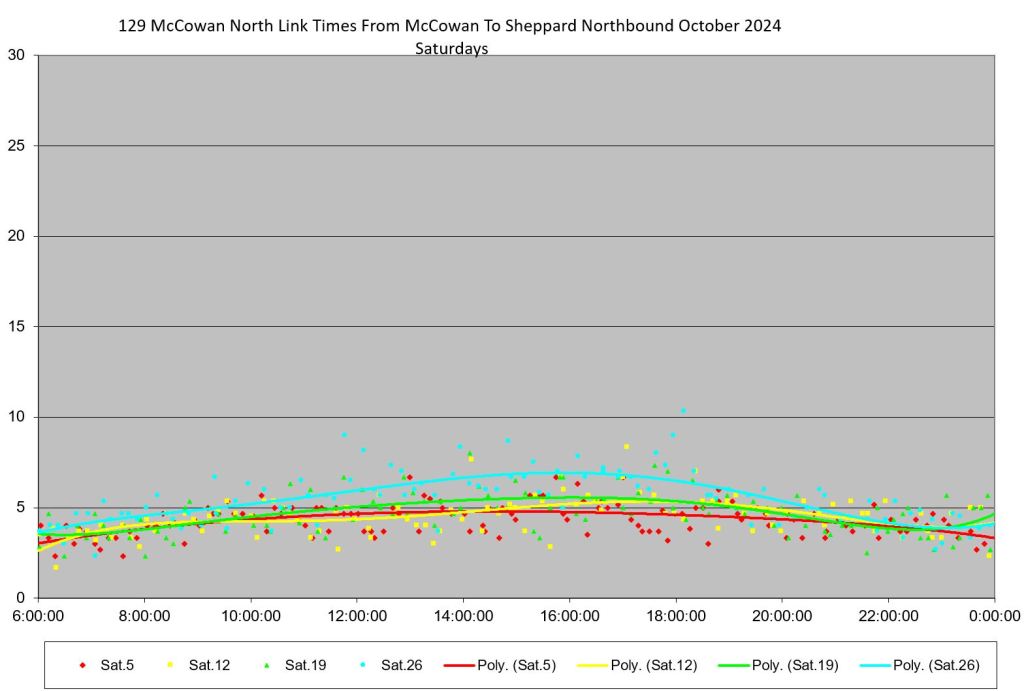
Weekend service northbound at 14th is better behaved than weekdays, but there is still an uneven pattern of headways with shorter and longer alternating. The trend line for October 5 is above other Saturdays because this service operated on the September schedule before the October improvements cut in.
South of Major Mackenzie Southbound
The screenline for these charts is just south of Major Mac on McCowan. This placement is to get a consistent view of southbound headways unaffected by where each bus takes its layover on the large north end loop. With few exceptions, the headways inbound from Major Mac lie in a narrower band than the outbound service above.
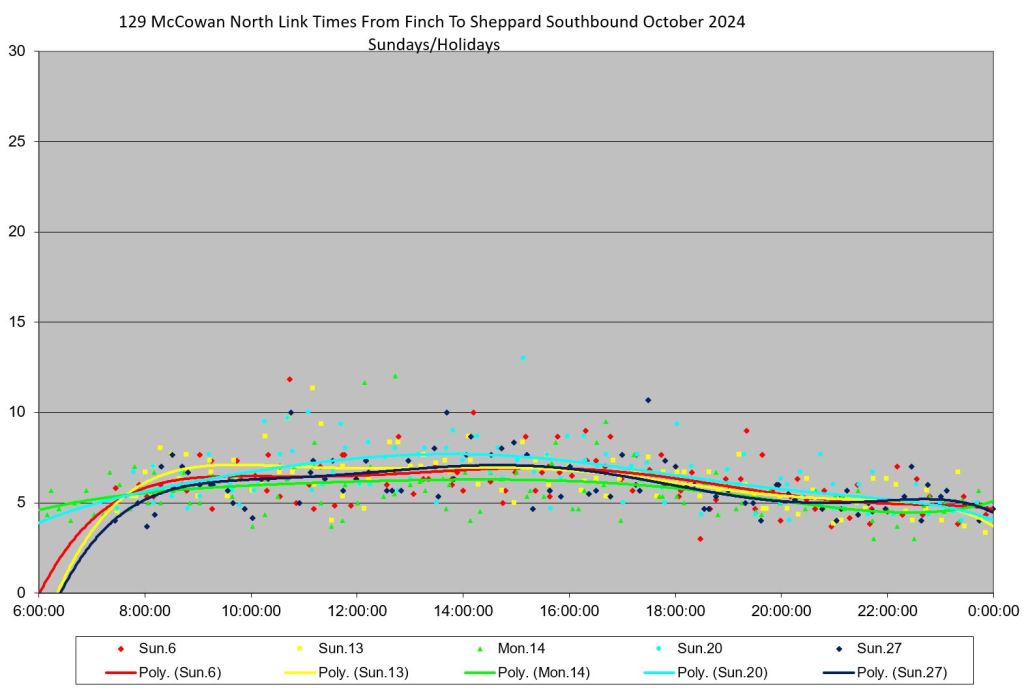
As on weekdays, Saturday and Sunday service from Major Mac has regular headways. Sunday October 13 shows a missing bus and hour-long headways (yellow dots). This appears to be caused by one bus failing to transmit tracking data repeatedly in the area south of Major Mac. (See detailed review of that date below.)
South of Steeles Southbound
Service south from Steeles is supposed to be a blend of 129A buses from Major Mac and 129B buses from Steeles. This service does not actually blend even when the schedules are set up with common headways that should mesh. In practice, the headways lie in a cloud of values mainly between 0 and 20 minutes. This is reflected in the high standard deviation values even though the averages look well-behaved. The headways are more widely spread in weeks 4 and 5 due to the disruption at Sheppard.
As on weekdays, the weekend service does not blend well at Steeles southbound with actual values in the 0-20 minute range. There does not appear to be any attempt to regulate the merging of the two services to provide an even headway on the common section of the route.
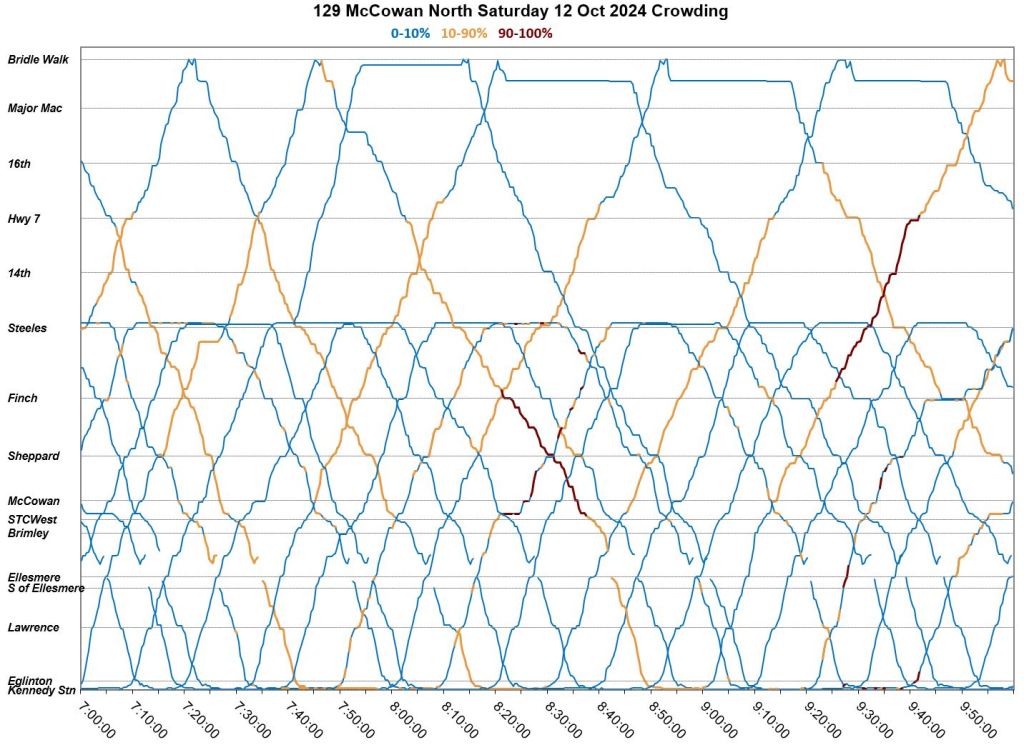
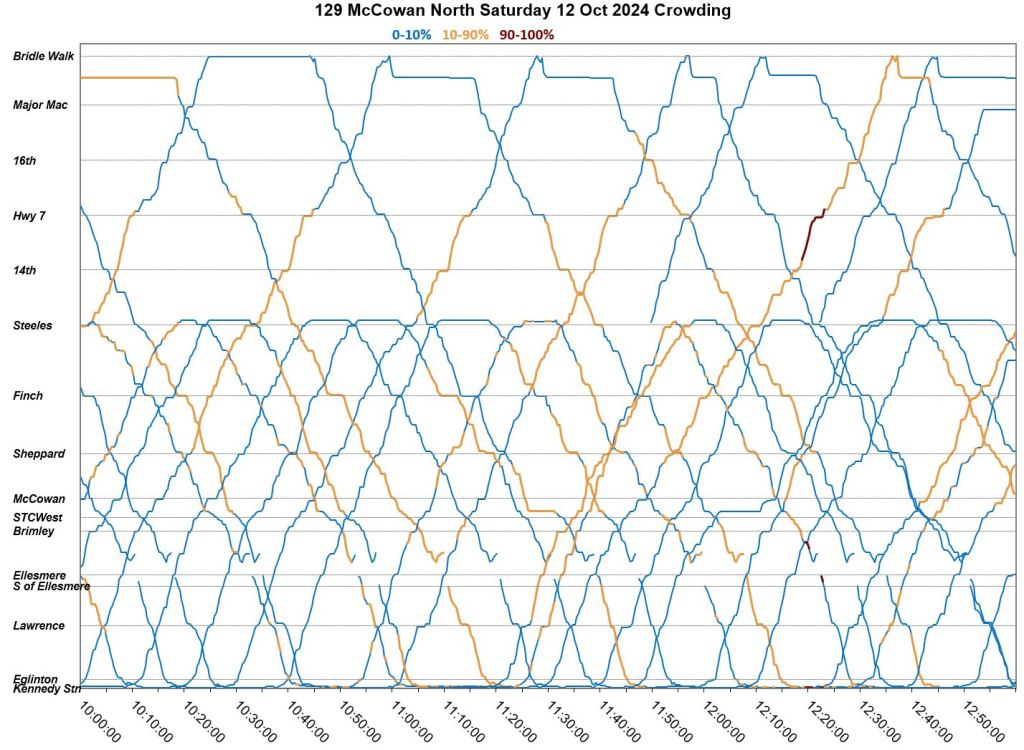
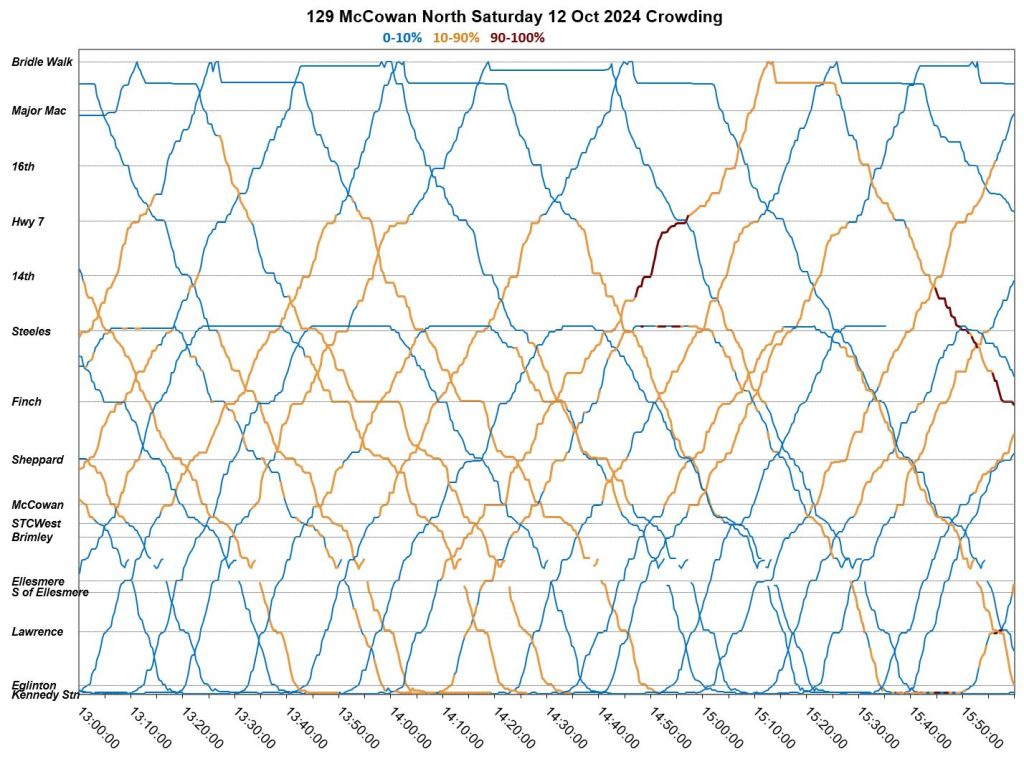
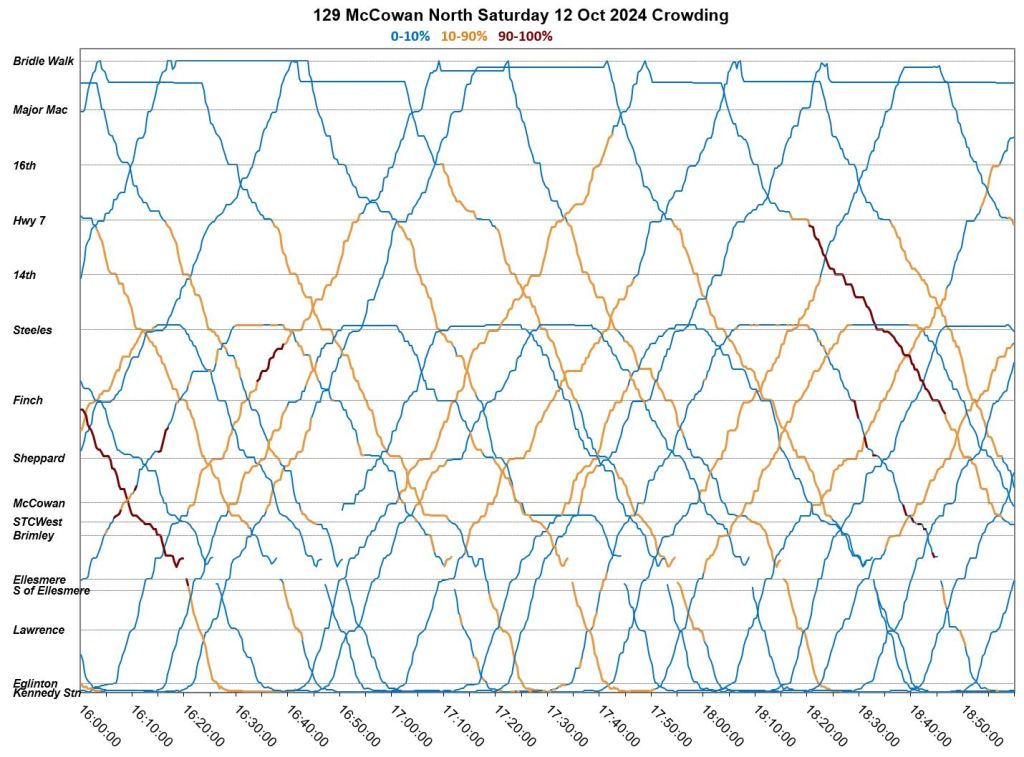
Review of Operation and Crowding on Individual Days
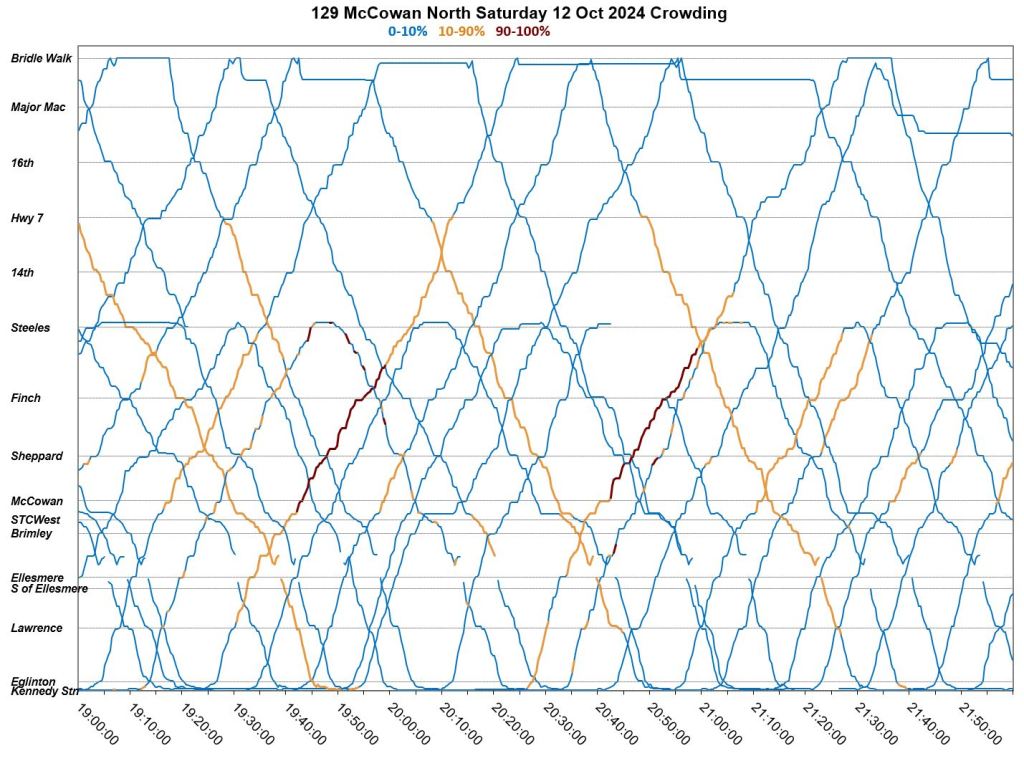
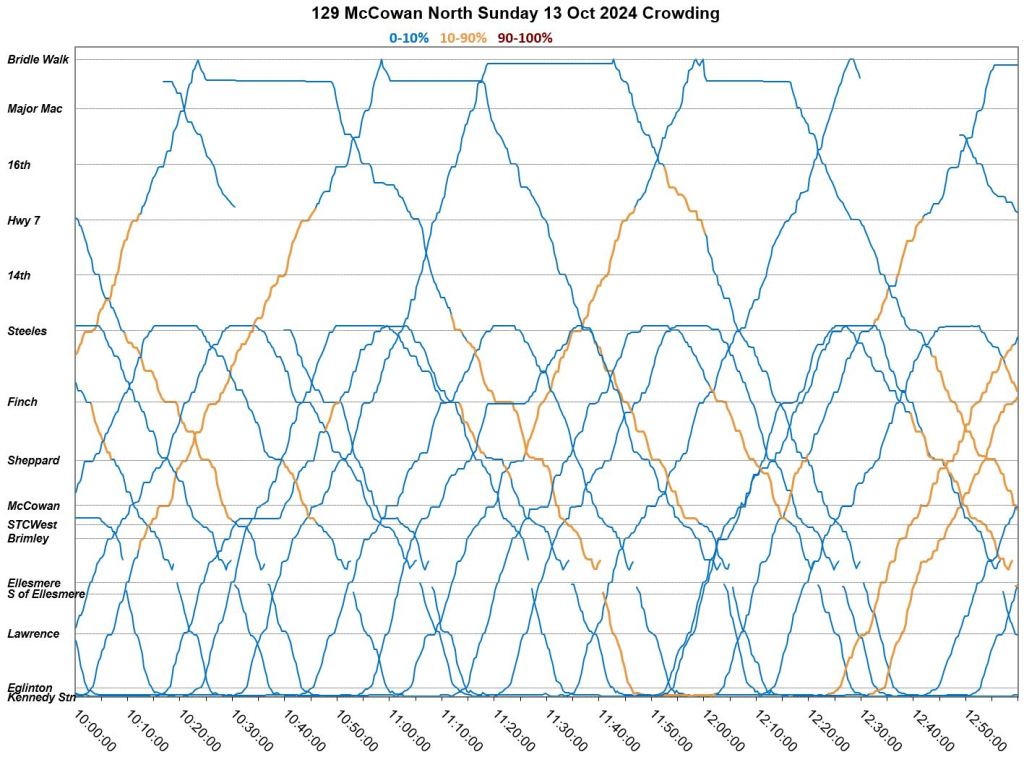
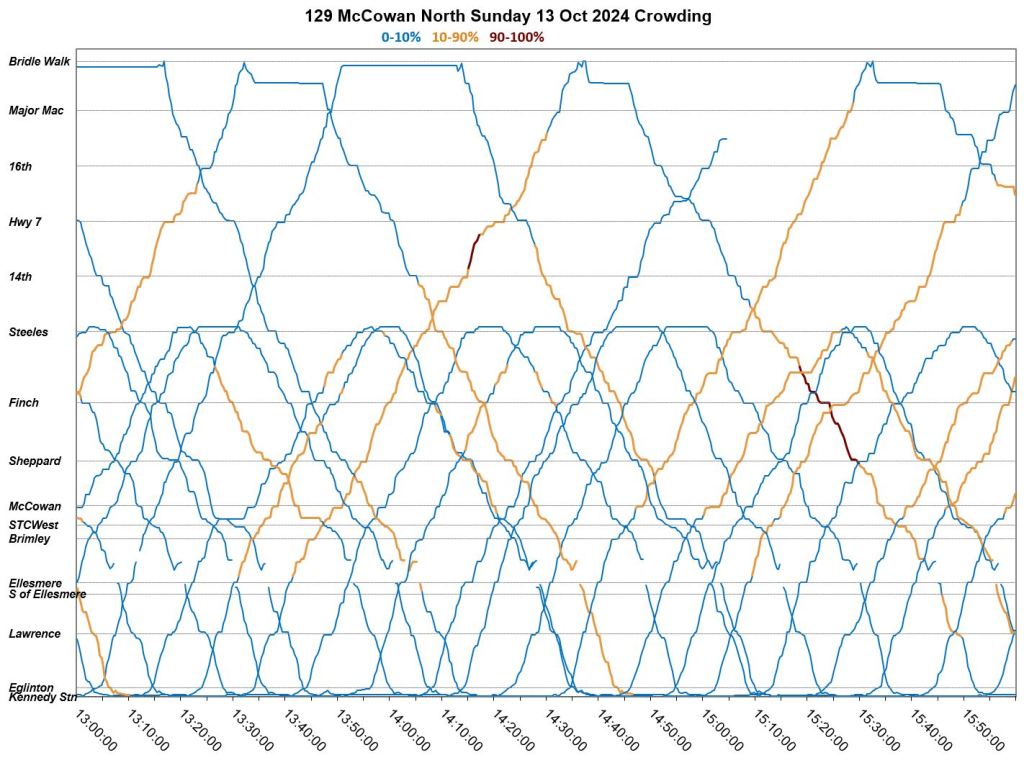
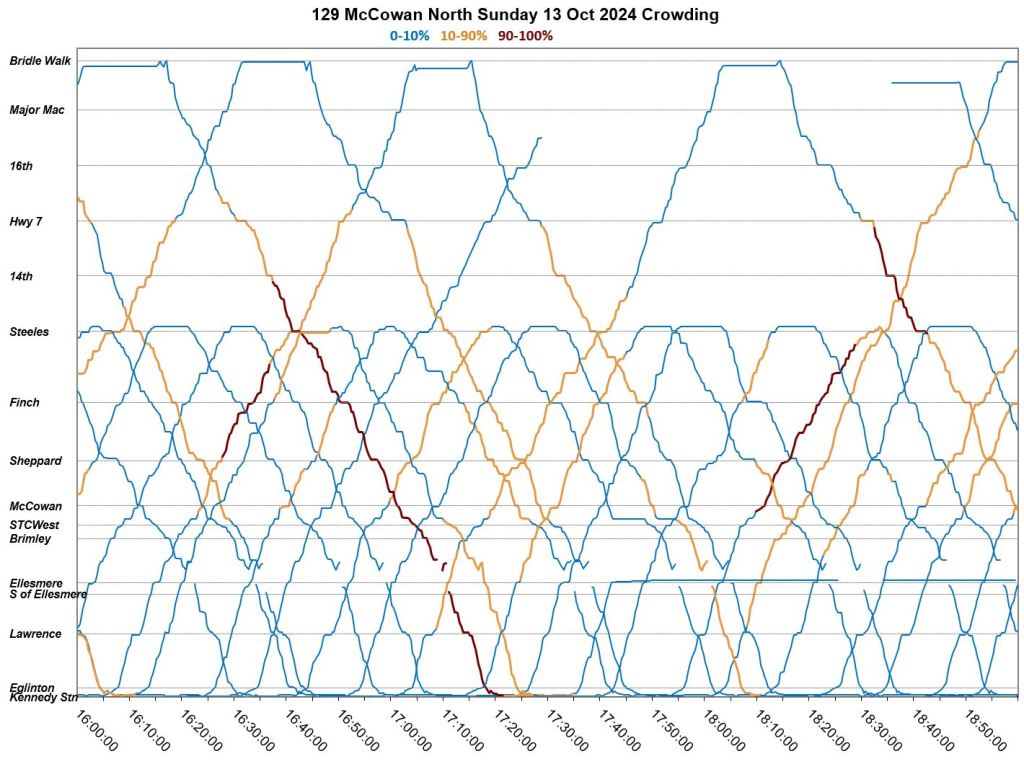
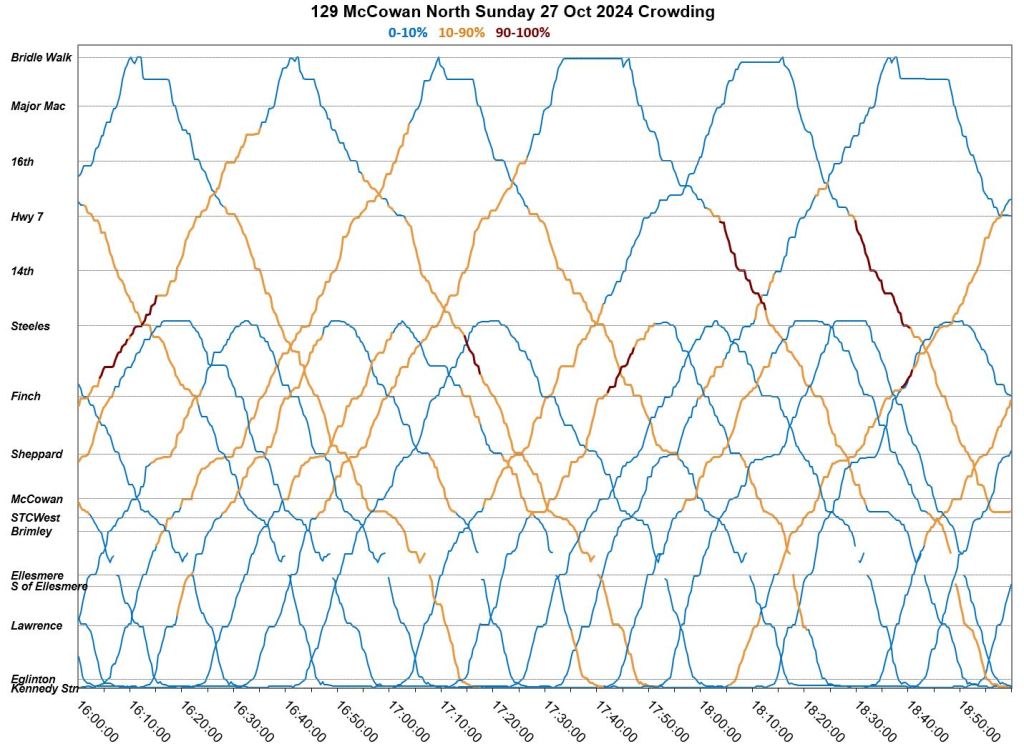
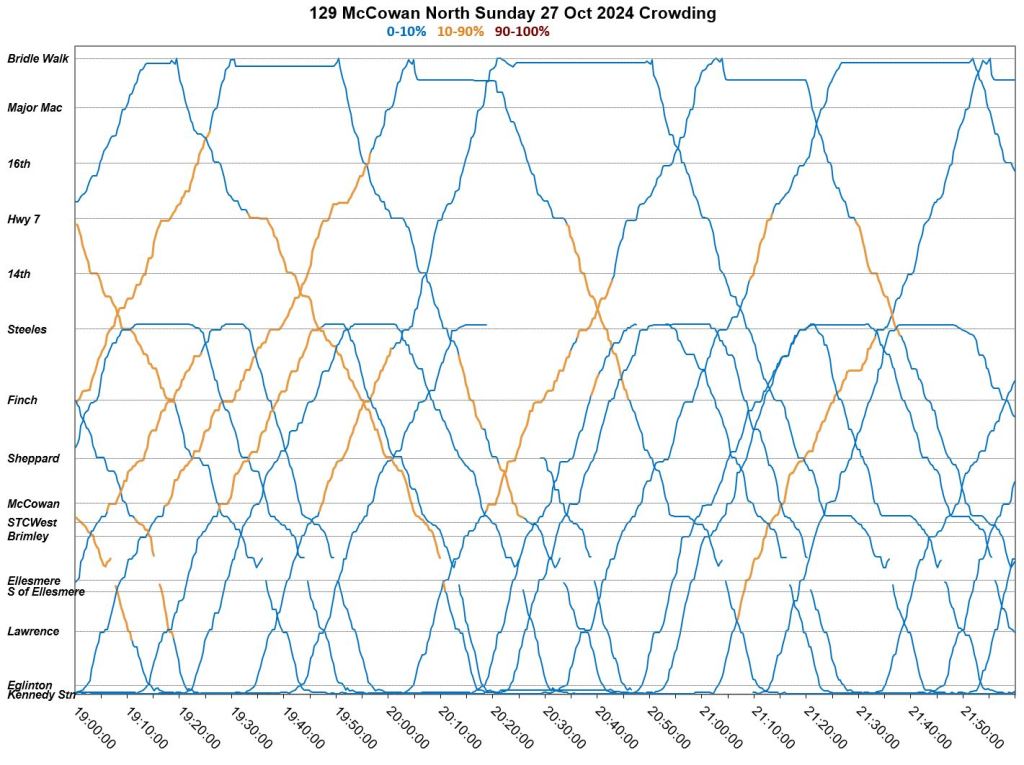
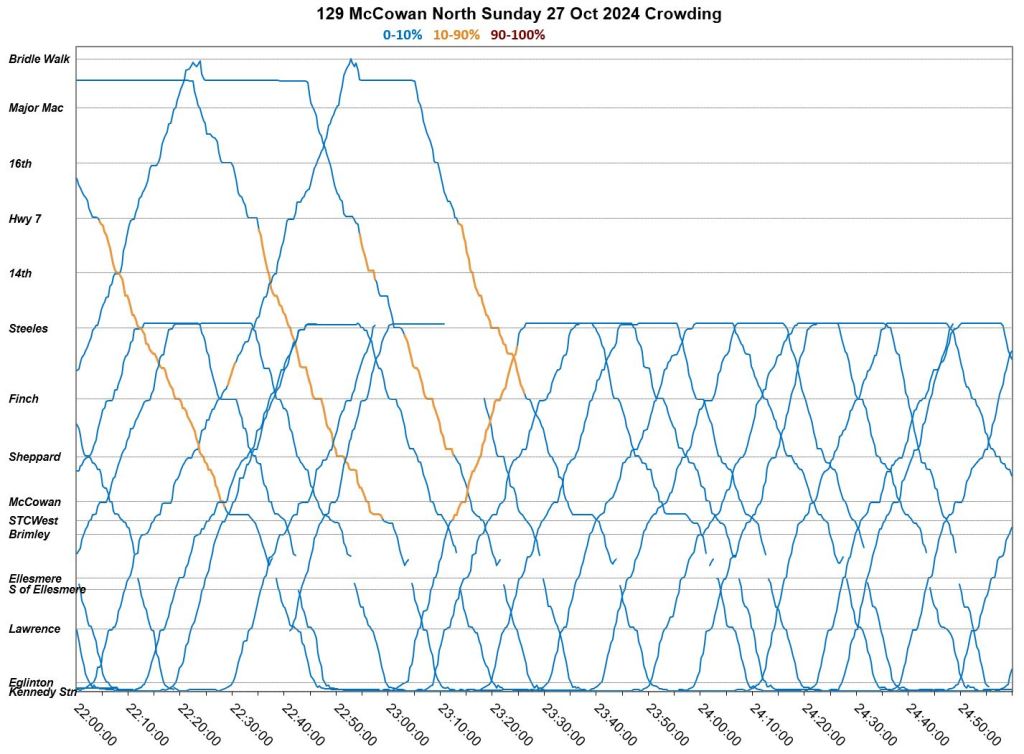
The charts in this section show the movement of buses back and forth on the route with colour coding for vehicle crowding based on the TTC’s Automatic Passenger Counting (APC) data. A few general notes:
- There is a notch in the southbound traces corresponding to the point where buses make a U turn through Ellesmere Station and return east before heading south on Midland. The gap in the the trace is a deliberate part of my mapping to preserve a common y-value on the charts south from Ellesmere even though the northbound trips via Kennedy are longer.
- An astoundingly large proportion of the service is reported with loads of 10% or less. This implies either that the service considerably exceeds demand, or that the APC data under-reports loads. Either of these have implications for service planning and reporting of actual demand.
- Branching routes are a problem at the best of times, and there is generally no management of inbound vehicles merging regularly. Blending of the 129A Major Mac service with the 129B Steeles service southbound is haphazard causing bunching. Moreover, some of those bunches echo back on the northbound trips from Kennedy Station on days when the service is more disrupted than usual (see October 23 or an example).
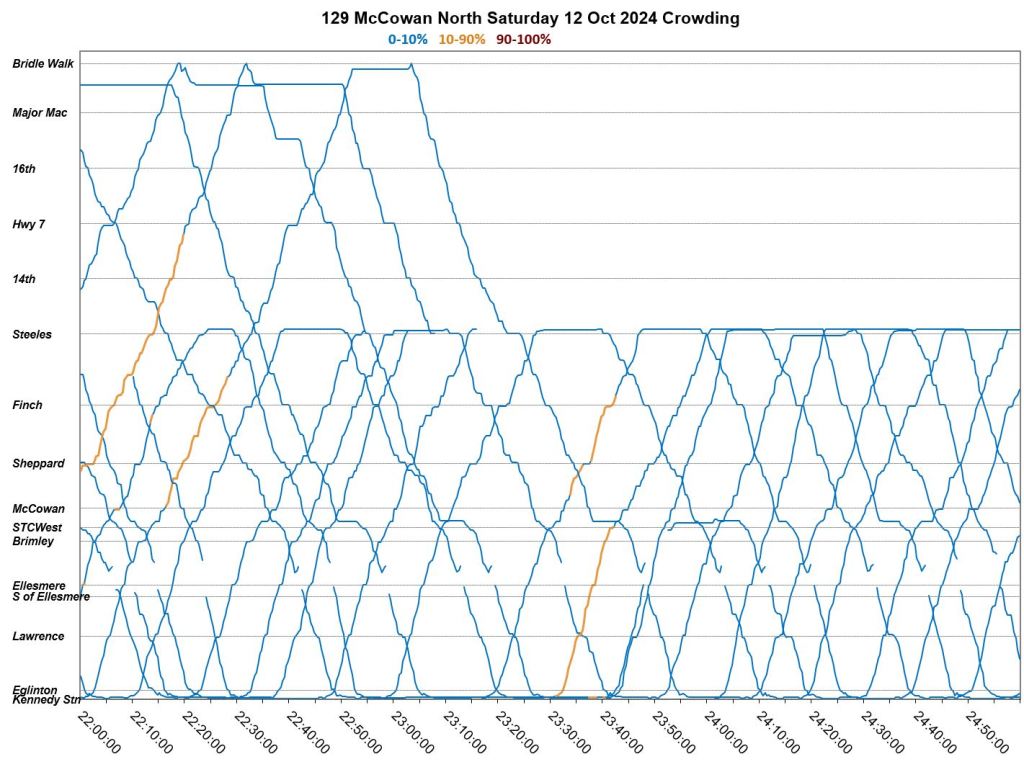
Updated: This section also shows bus spacing charts for each of the days illustrated. See the description above the first set of charts below for an explanation of their format.
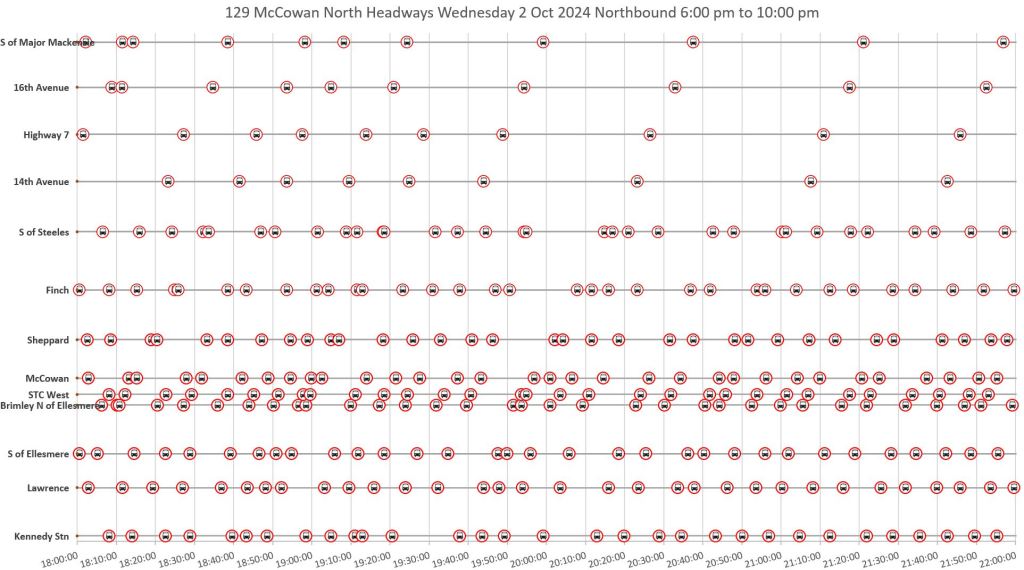
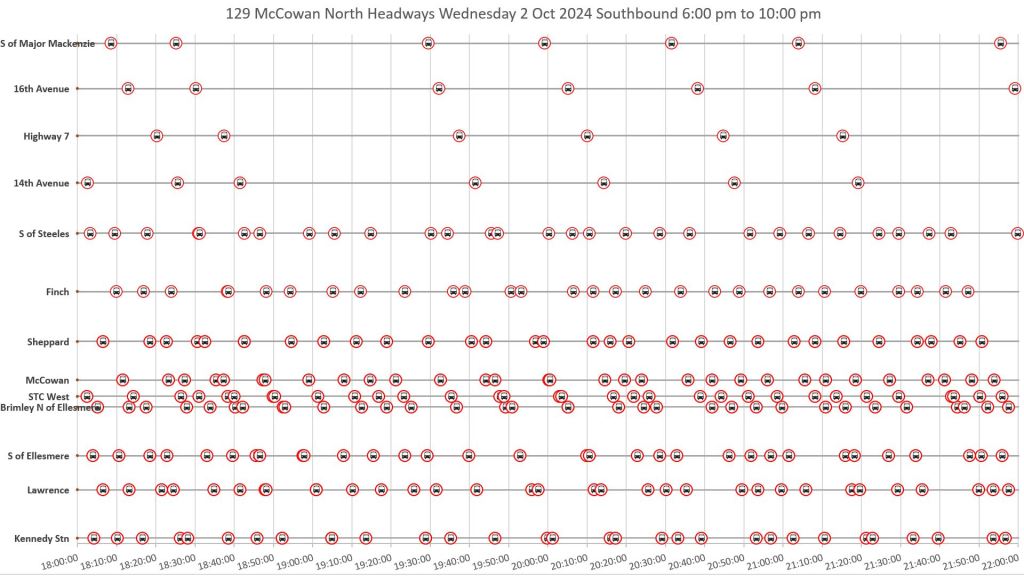
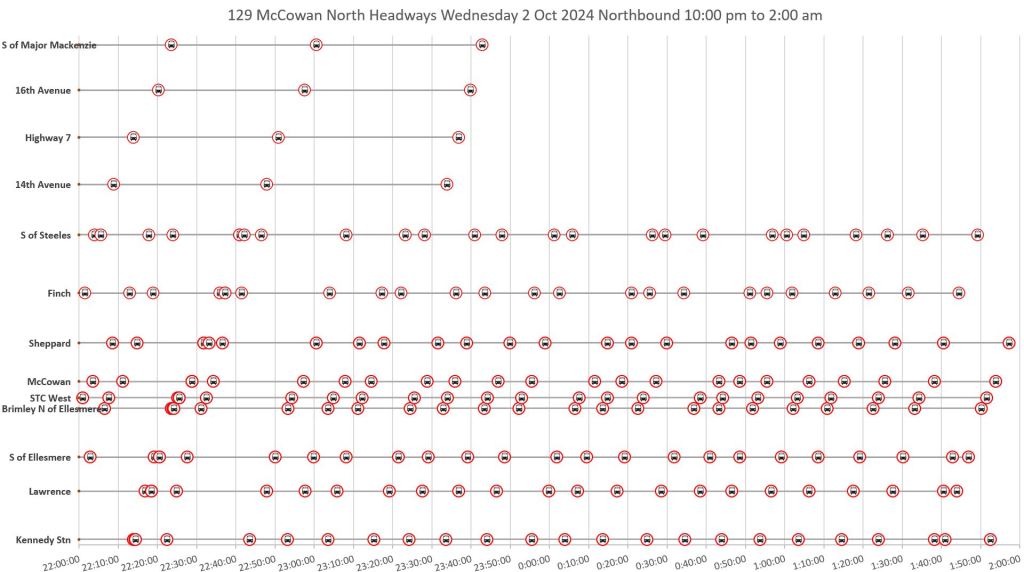
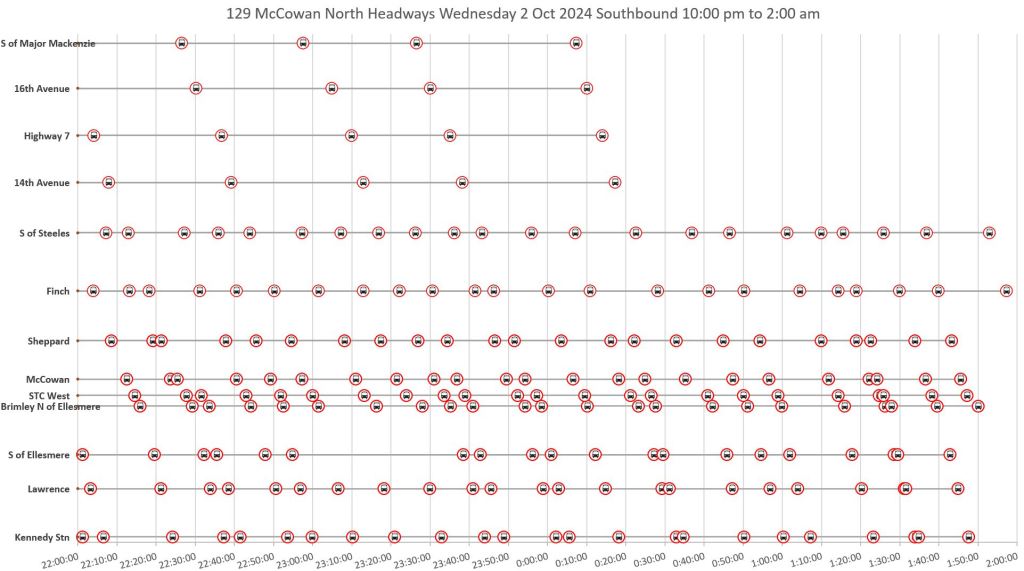
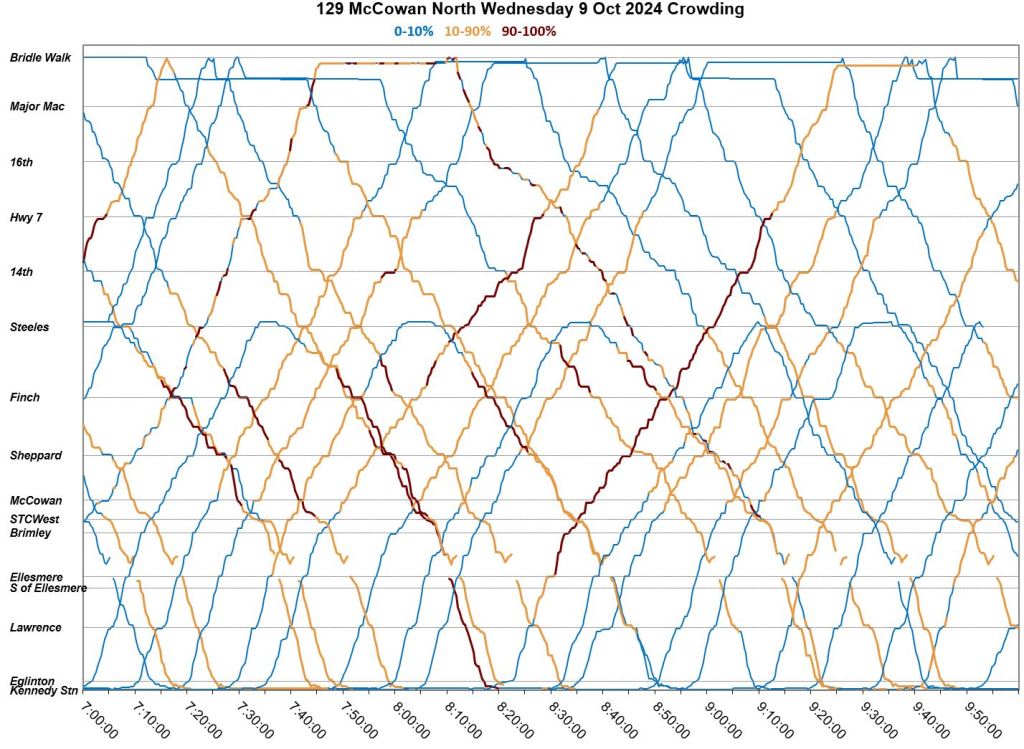
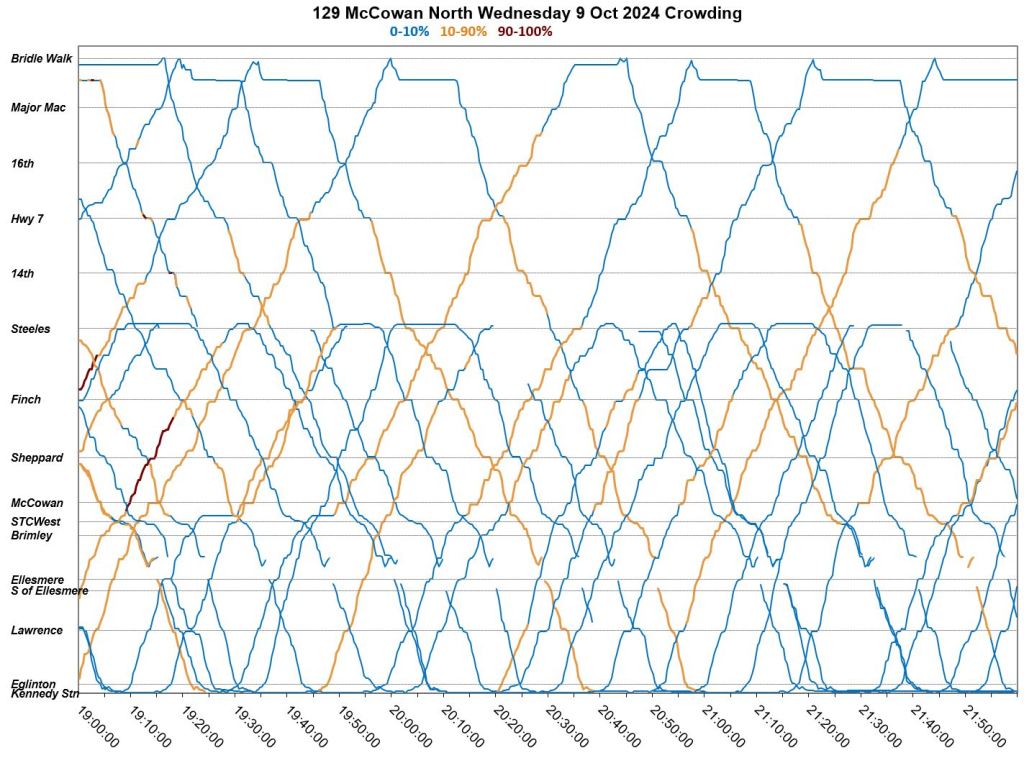
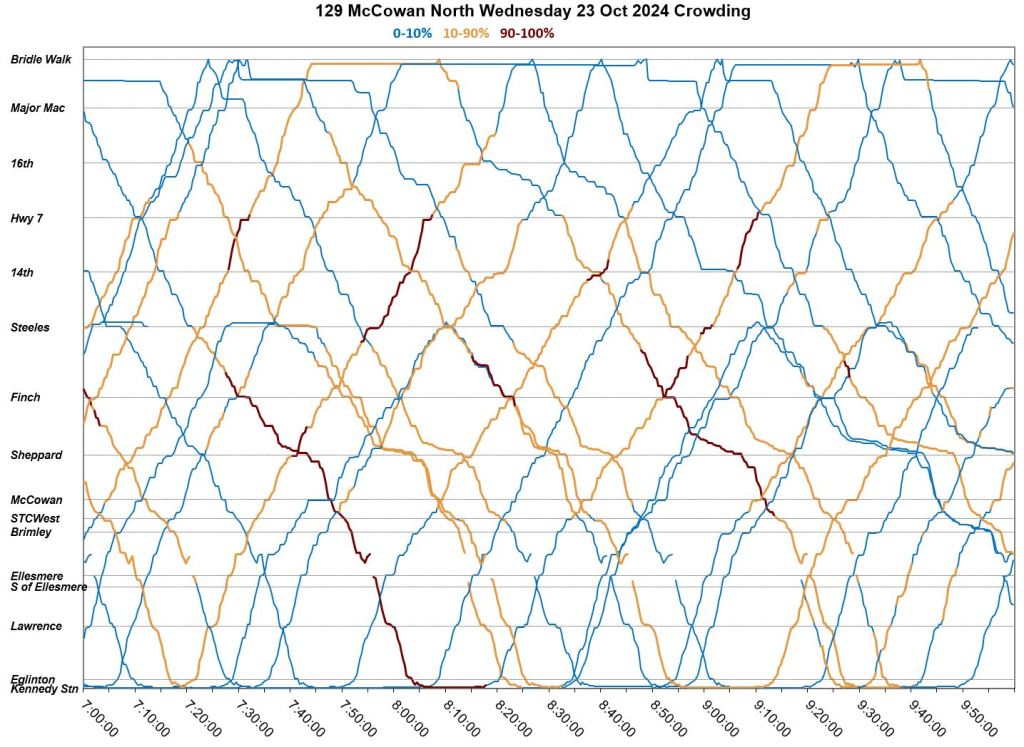
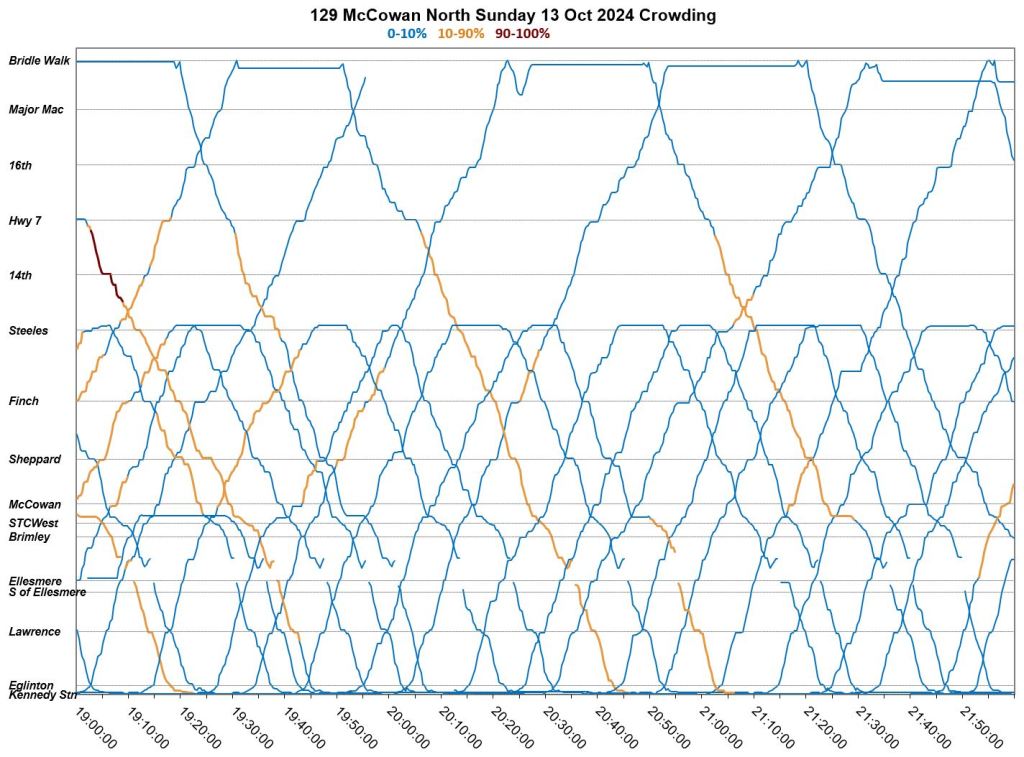
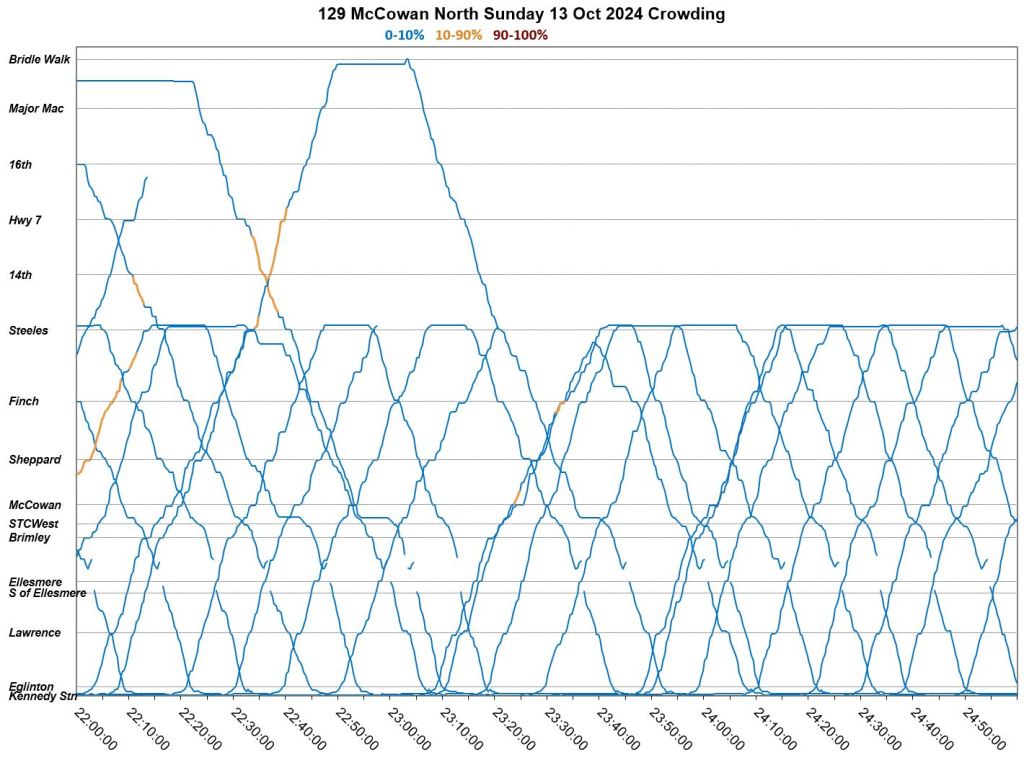
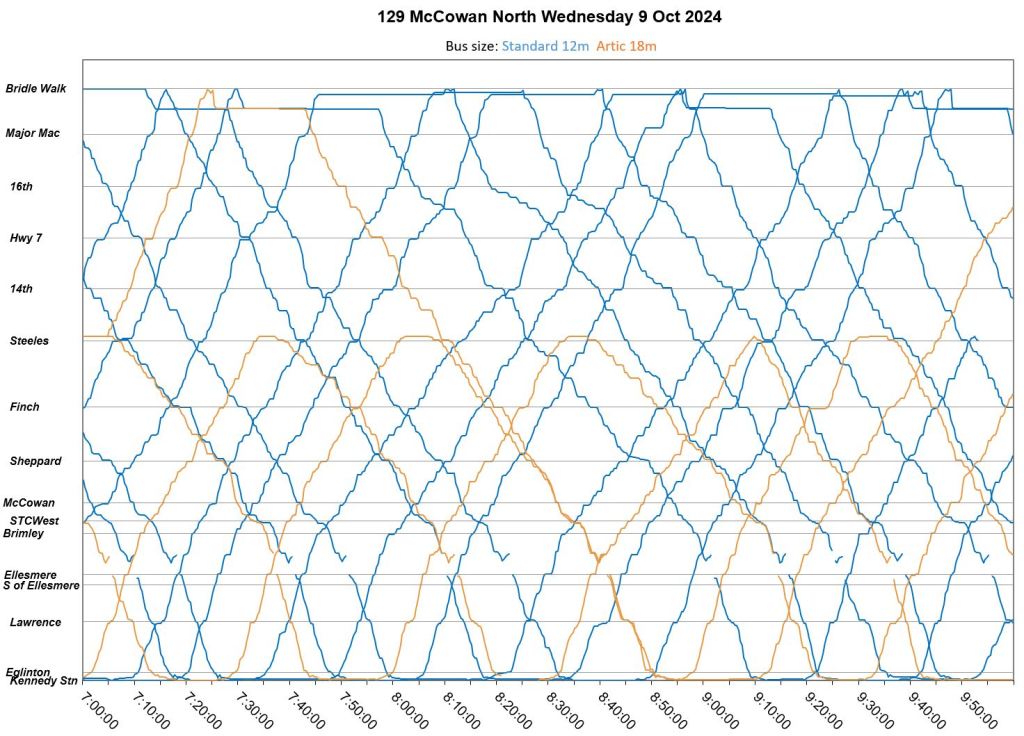
Wednesday, October 2
Details for this date have been added to the article as an example of route behaviour before the October 6 schedule change. Note that the vehicle spacing in the peak periods is regular because the scheduled headways allow this. There are problems with the blending of services southbound from Steeles, but not to the degree seen later in the month.
In these charts each line represents one bus, and the colour of the line shows the degree of crowding as reported by the automatic passenger counters (APCs) on board the vehicles. Where a line follows a fairly steady slope, the speed along the route is consistent. Where the slope flattens, buses are caught in traffic. Horizontal sections correspond to stops. The space between the lines indicates the degree of bunching or gaps.
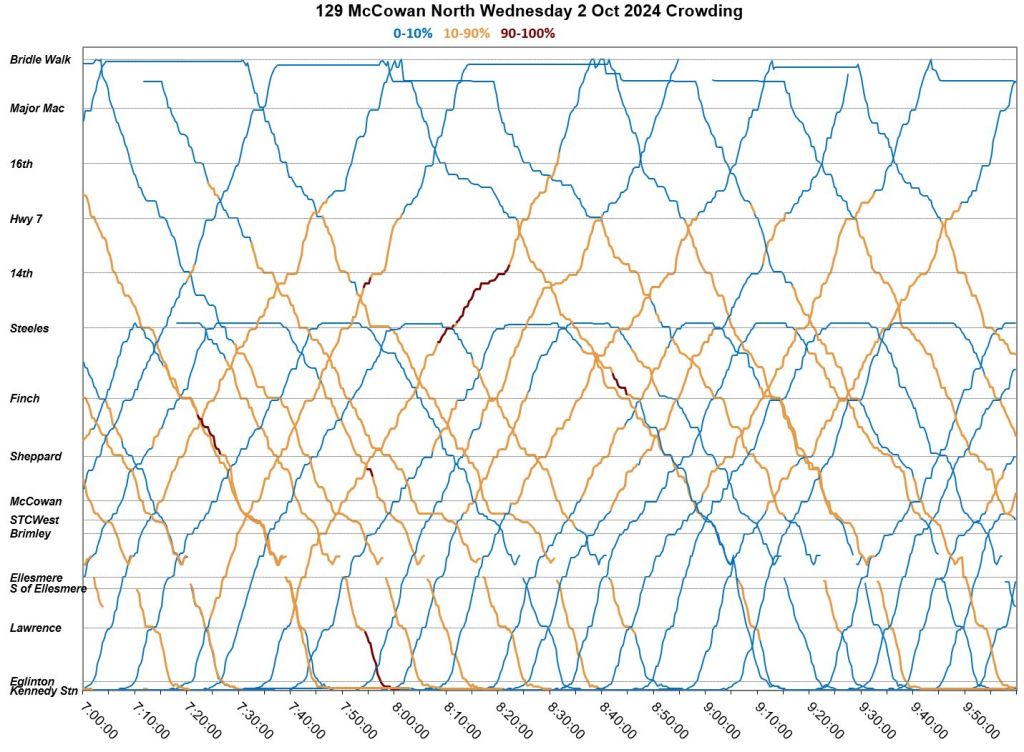
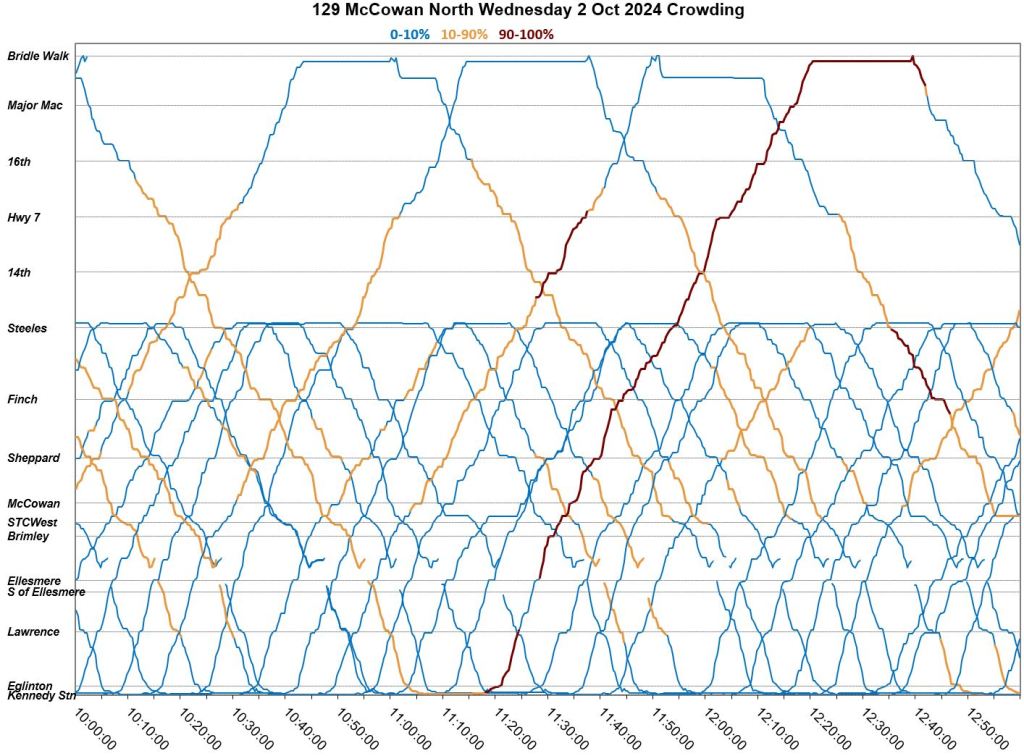
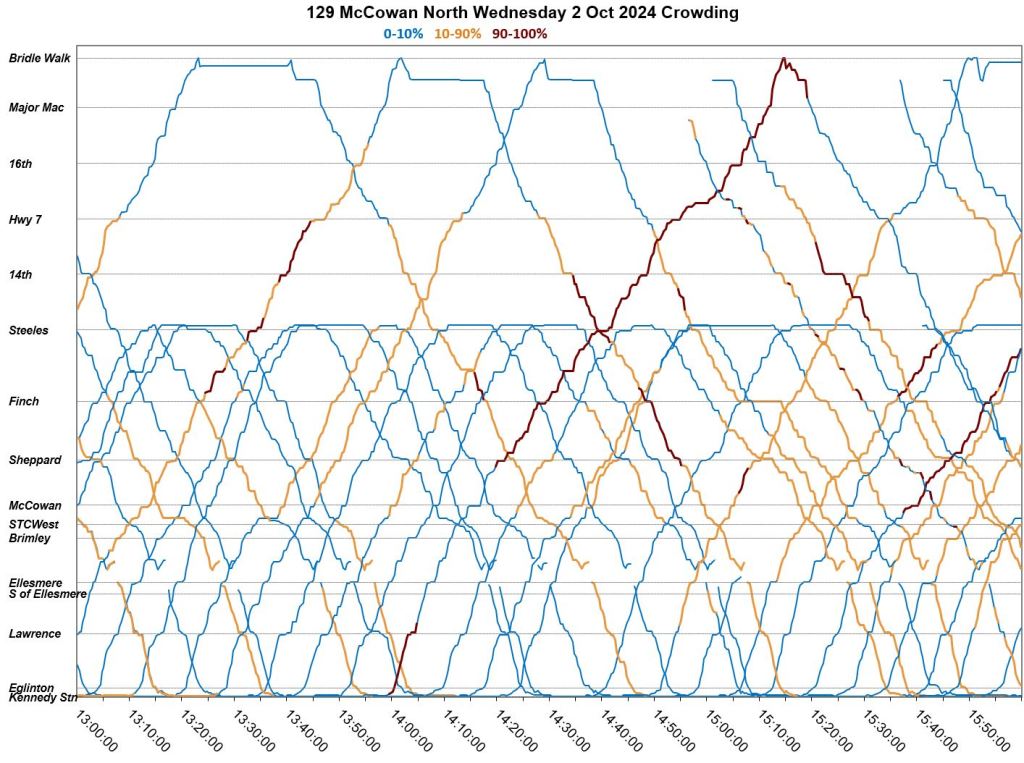


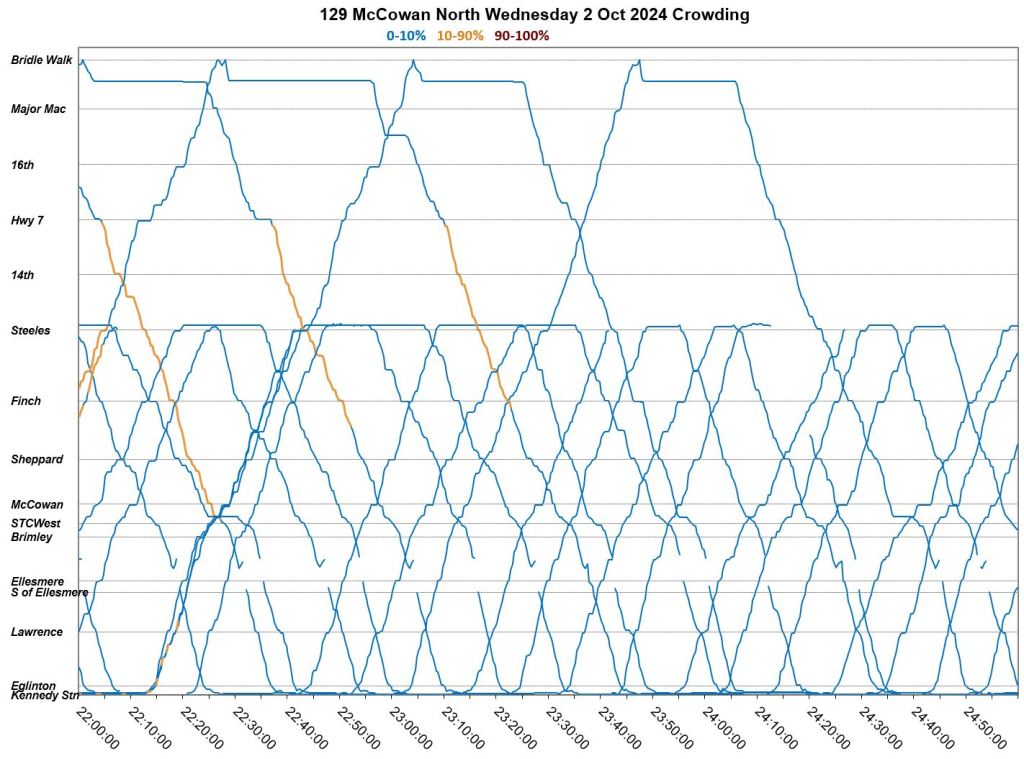
Bus Spacing Charts:
These charts use the same data as the tracking charts above, but with the northbound (left) and southbound (right) split apart. The bus icons correspond to times when a bus crossed each screenline on the route. Gaps and bunching are evident on these charts.
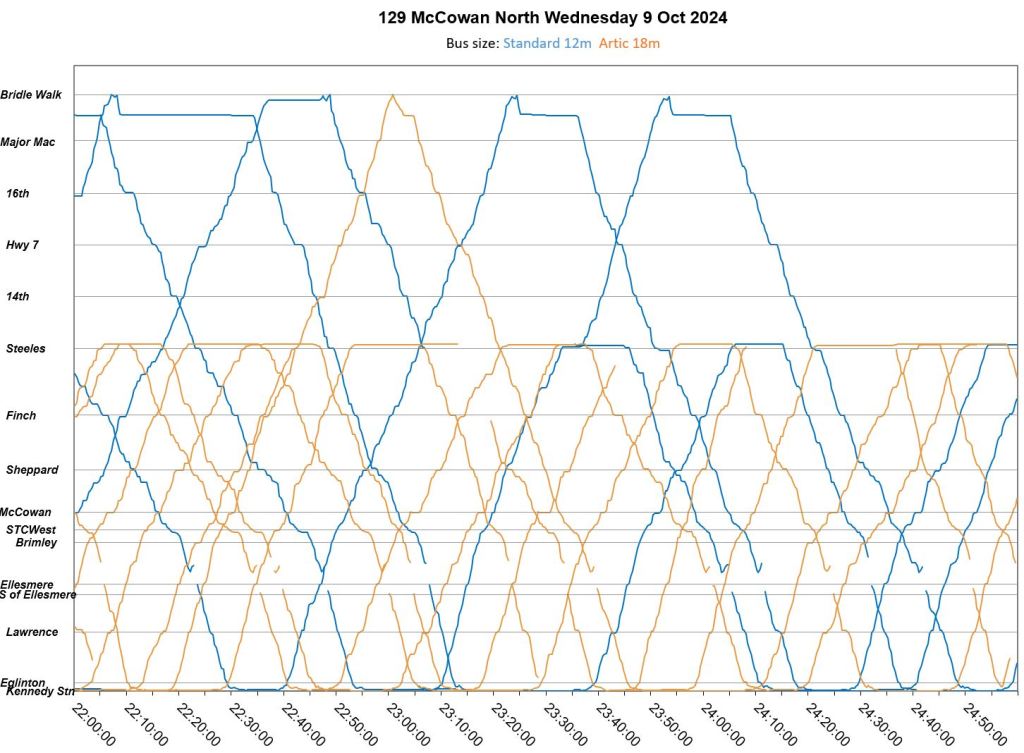
Wednesday, October 9
October 9 is the first midweek day of the new schedule with more frequent service on 129A to Major Mackenzie. Service during this week was fairly well-behaved with no major delays (see weekly breakdown earlier in the article). A few points of note:
- The areas of crowding (dark red) are generally north of Scarborough Centre, and in some cases north of Steeles.
- Almost all 129A buses have considerable layovers at Major Mackenzie, and so their uneven departure southbound is not the result of inadequate running time.
- One bus shows up southbound at about 5:45 pm from Major Mac with gaps in the tracking data. This is bus 3135 which, oddly enough, shows up on another day’s charts with the same problem.
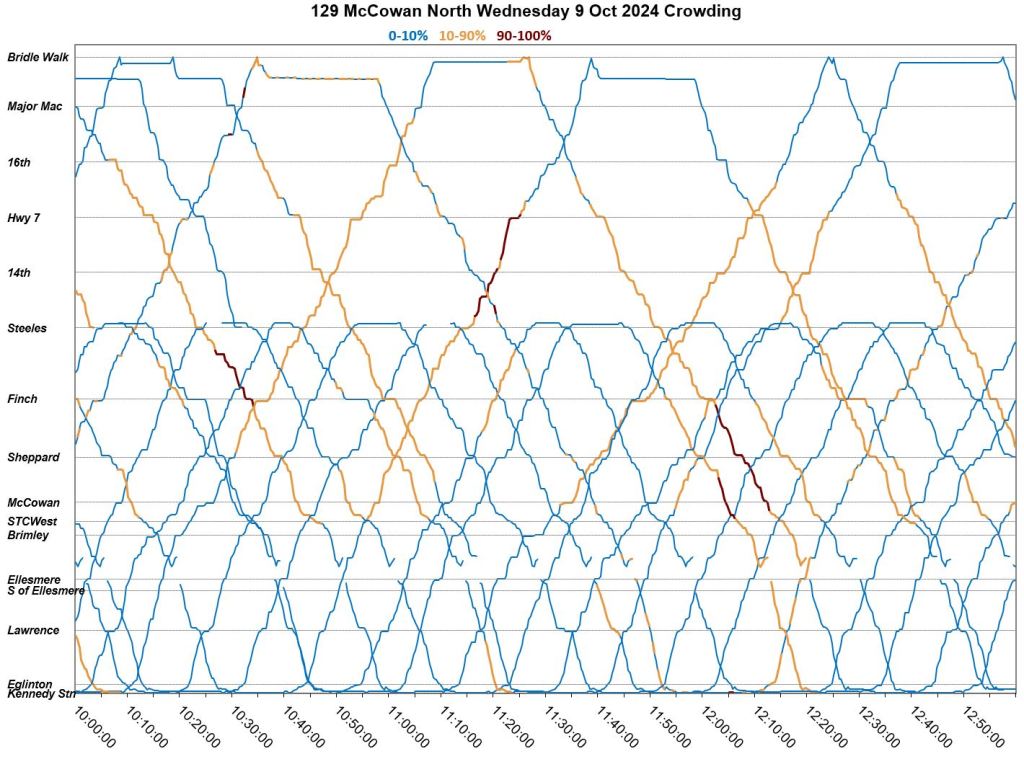
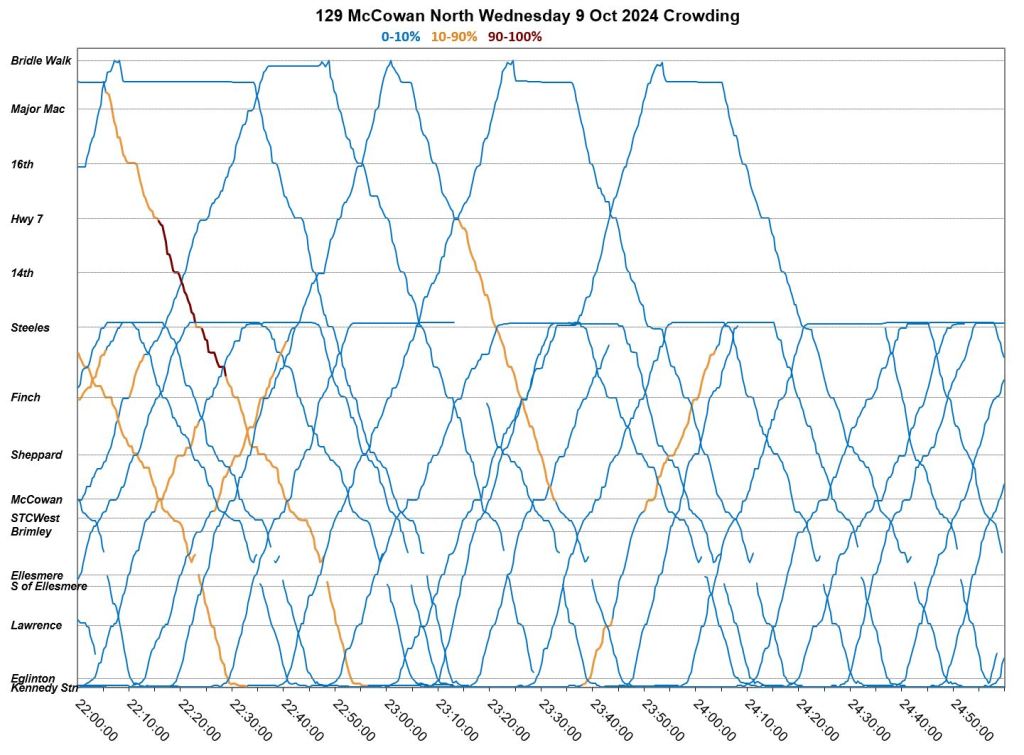
Bus Spacing Charts:


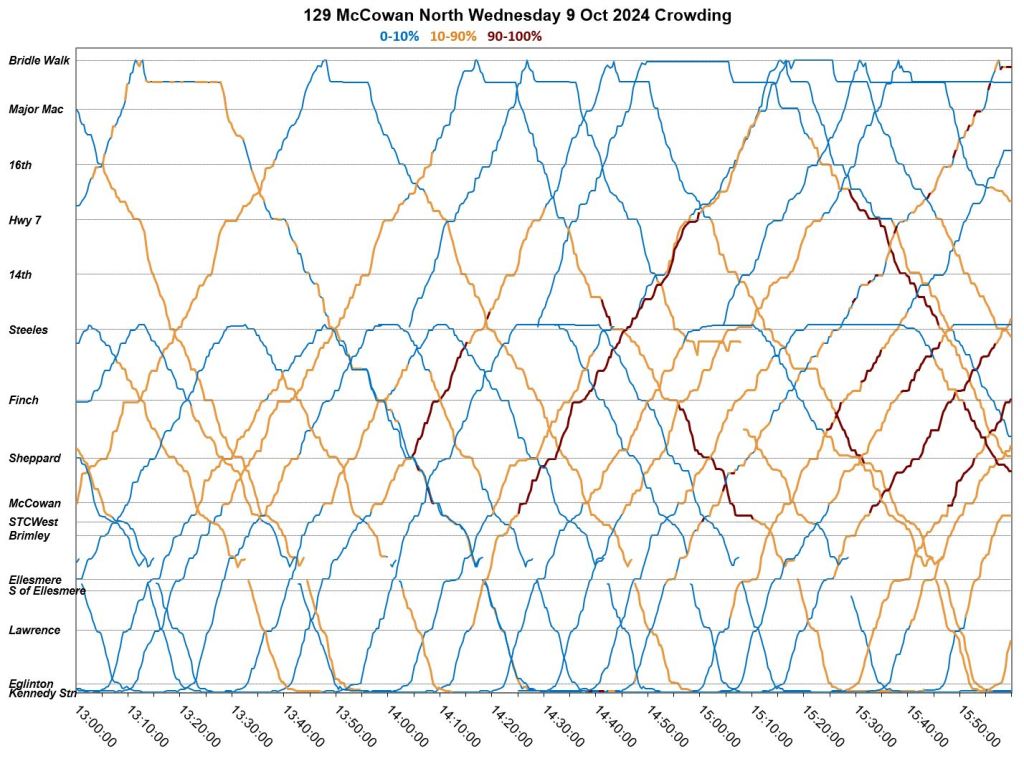
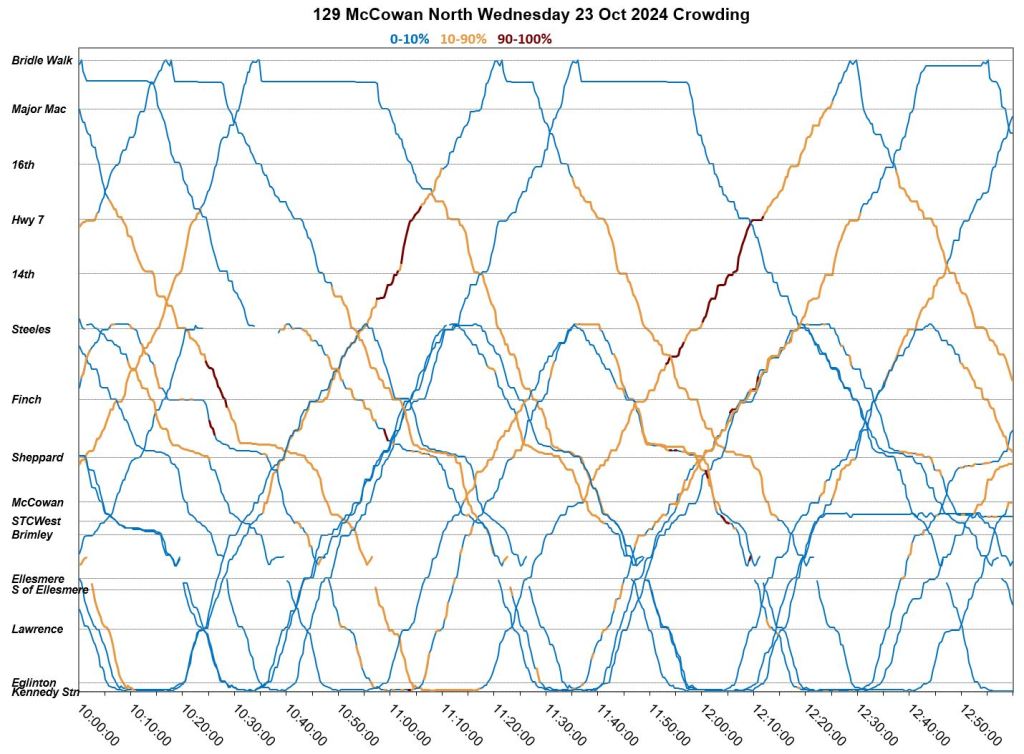
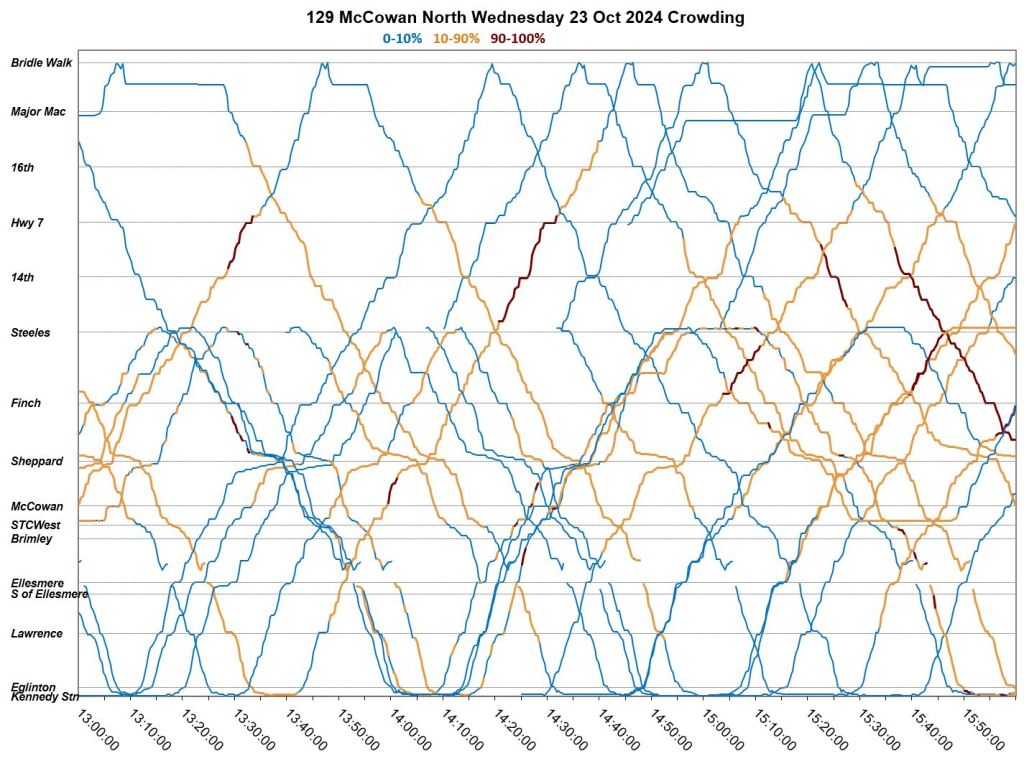
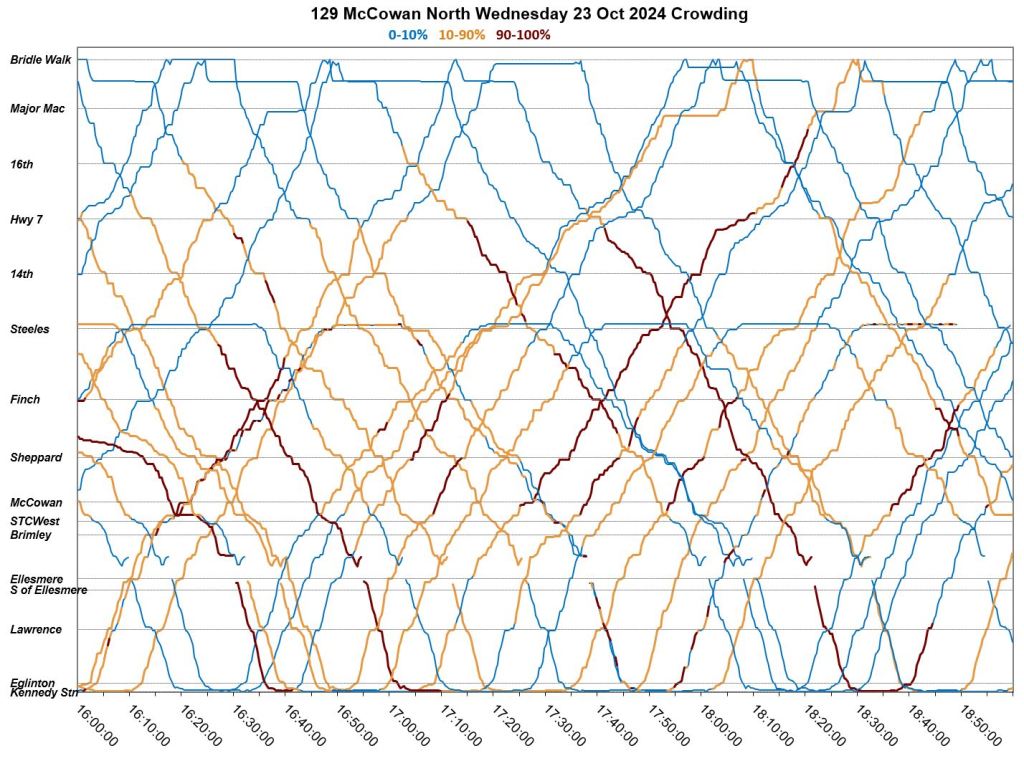
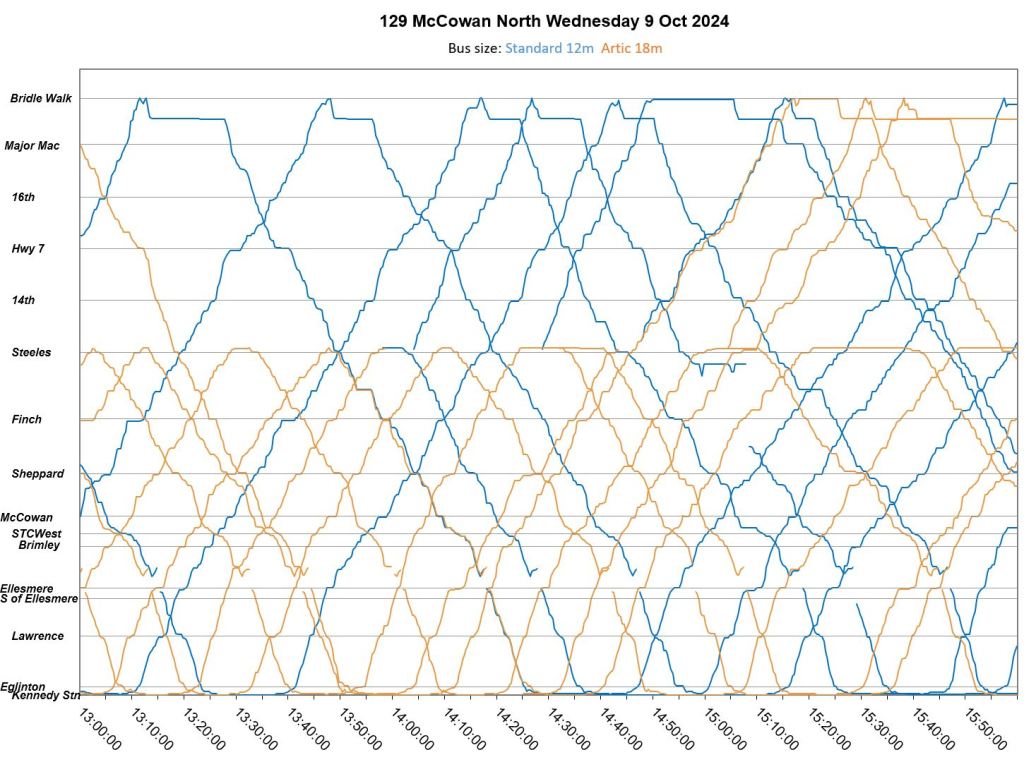
Wednesday, October 23
October 23 shows a very different pattern from the service two weeks earlier. In these charts the effect of congestion at Sheppard is quite clear. The effect is mainly southbound (the lines change to a more horizontal direction), but there is also some delay northbound in the afternoon. Layovers at both Steeles and at Major Mackenzie are shorter, and there is more bunching of service with less reliable merging of 129A and 129B buses southbound from Steeles than on October 9.
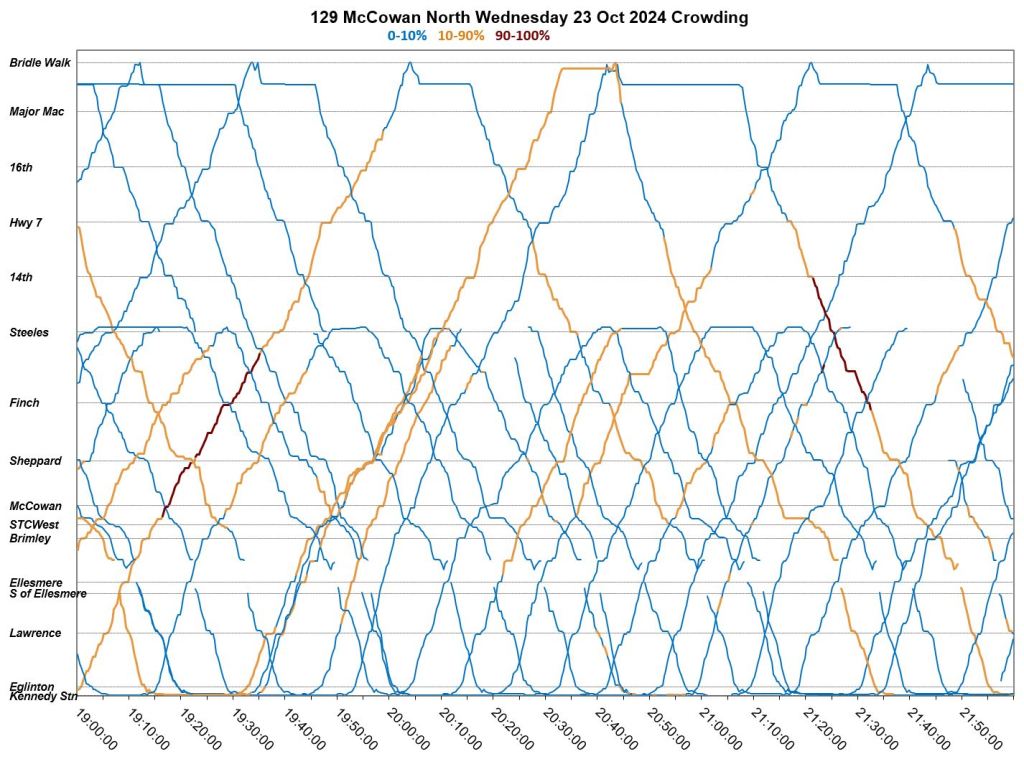
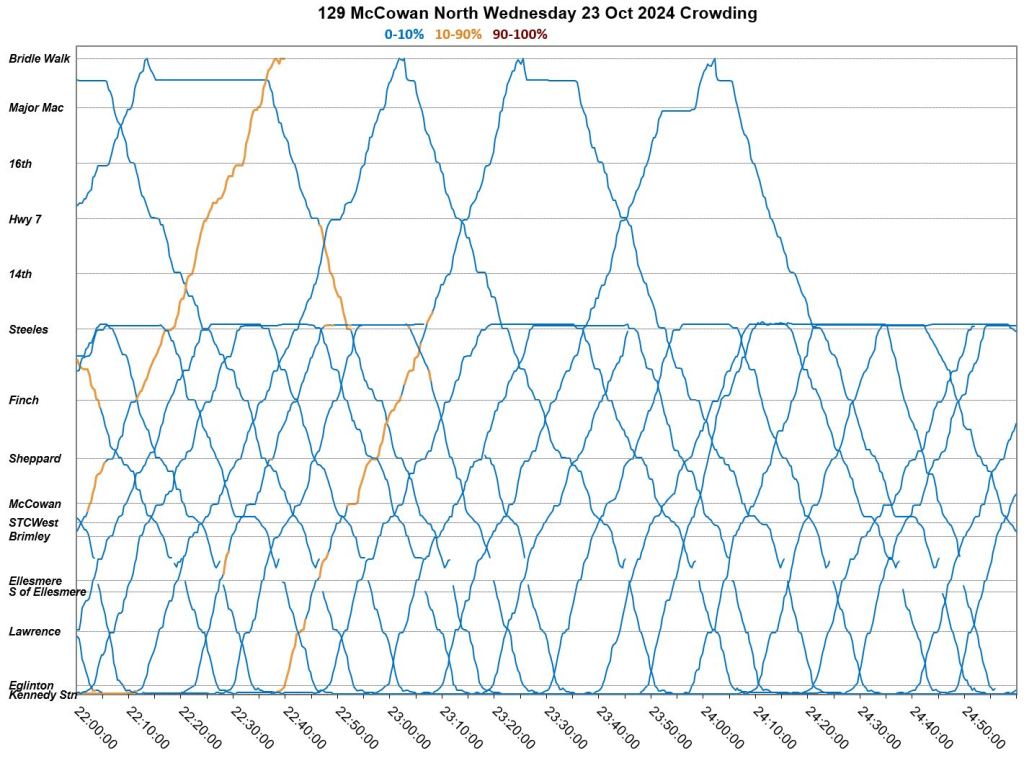
Bus Spacing Charts:


Saturday, October 12
October 12 was the first Saturday with the new schedule. Northbound service is fairly regular, but the southbound service suffers at time from poor blending at Steeles of the 129As from Major Mac and the 129B Steeles service. There is some crowding, mainly with buses in gaps.
Bus Spacing Charts:


Sunday, October 13
Two Sundays are detailed here for comparison.
October 13 data suffer from a problem with one bus (3135) that periodically vanishes from the tracking system in York Region. I reviewed the raw data, and there are no records for this bus for periods corresponding to gaps in the charts. Needless to say, this fouls up reports of headway reliability.
Even allowing for that, headways are uneven as shown earlier in this article in the weekly summary charts, and there is a small amount of crowding.
Bus Spacing Charts:


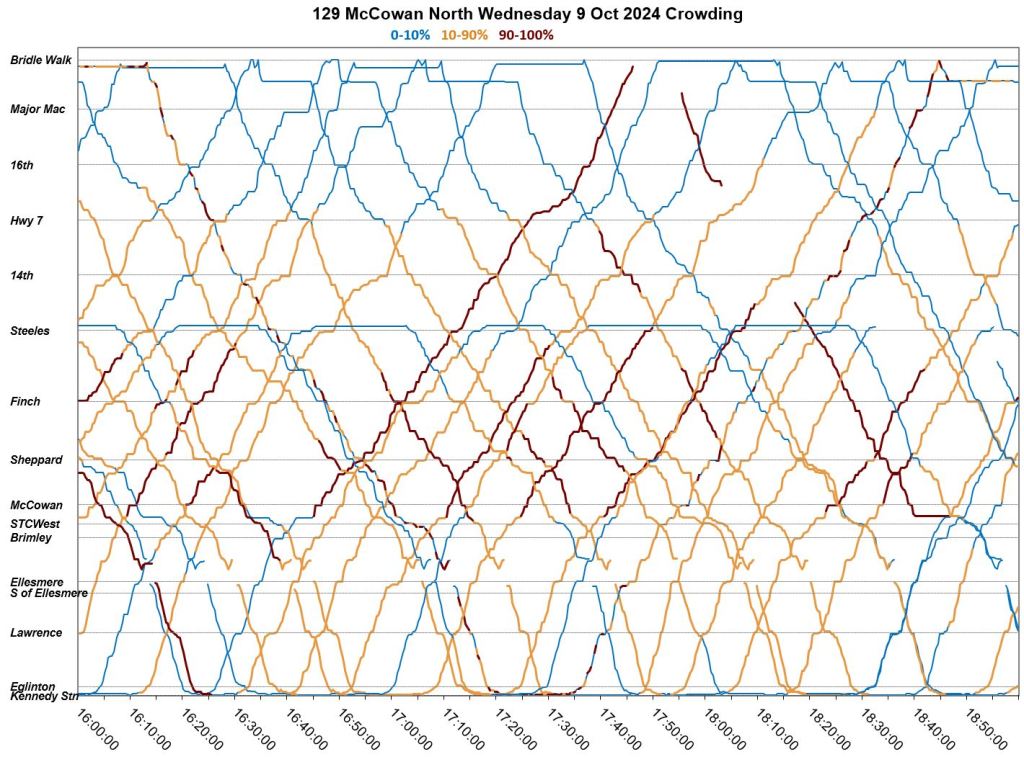
Sunday, October 27
On October 27, there are fewer gaps in the tracking data, but the service is still somewhat irregular. Points of note:
- There appears to be one bus missing from the 129B Steeles service. There are gaps northbound from Kennedy and southbound from Steeles that persist over round trips.
- There are a few data gaps in the evening where bus 9089 stops reporting for periods, notably southbound from Steeles.
- One bus, 9206, reports that it is crowded from leaving southbound at Major Mac about 9:20am over its entire round trip to Kennedy Stn. and return. This is not credible.
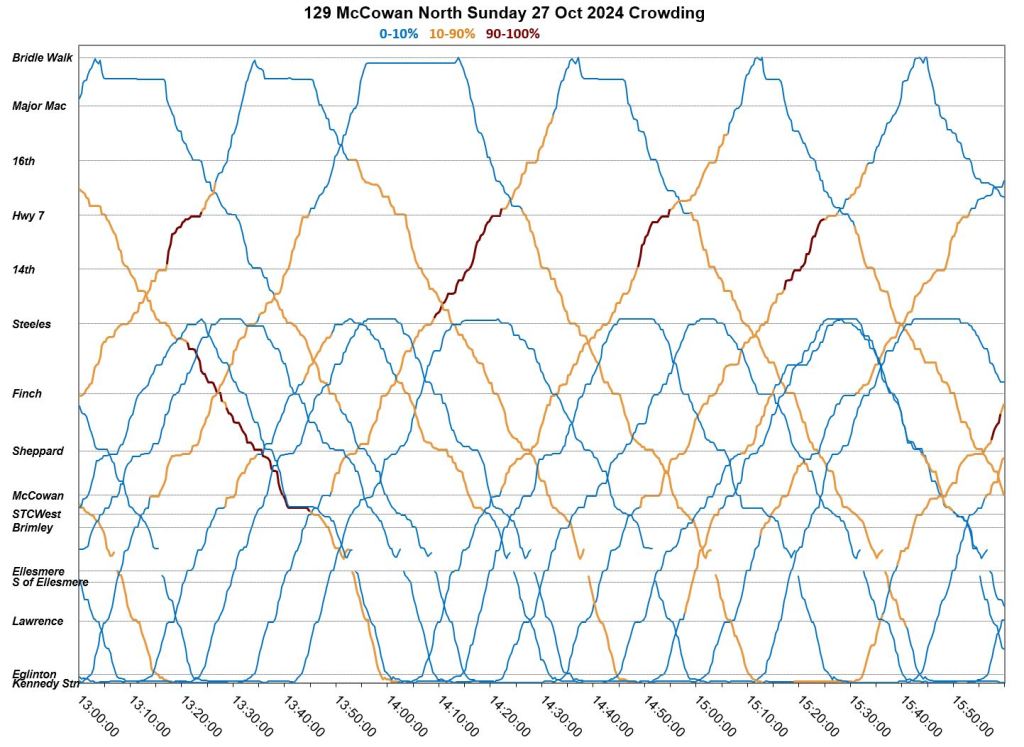
Bus Spacing Charts:


Travel Times Near Sheppard Avenue
The charts below show how the travel times changed approaching Sheppard northbound from McCowan at the east side of STC (left) and southbound from Finch (right) over the month. In the overall statistics (top charts), the changes in average headway and the standard deviation (measure of dispersion of the data values) are evident. The southbound average roughly doubles for much of the day, but the travel times for individual buses can be even higher (see week 4 below).
These charts illustrate two key points:
- Conditions can change on a route and severely disrupt service if only for a short period.
- The more abstract a view one takes of the data through month-long averaging, the more short-lived effects like this disappear.
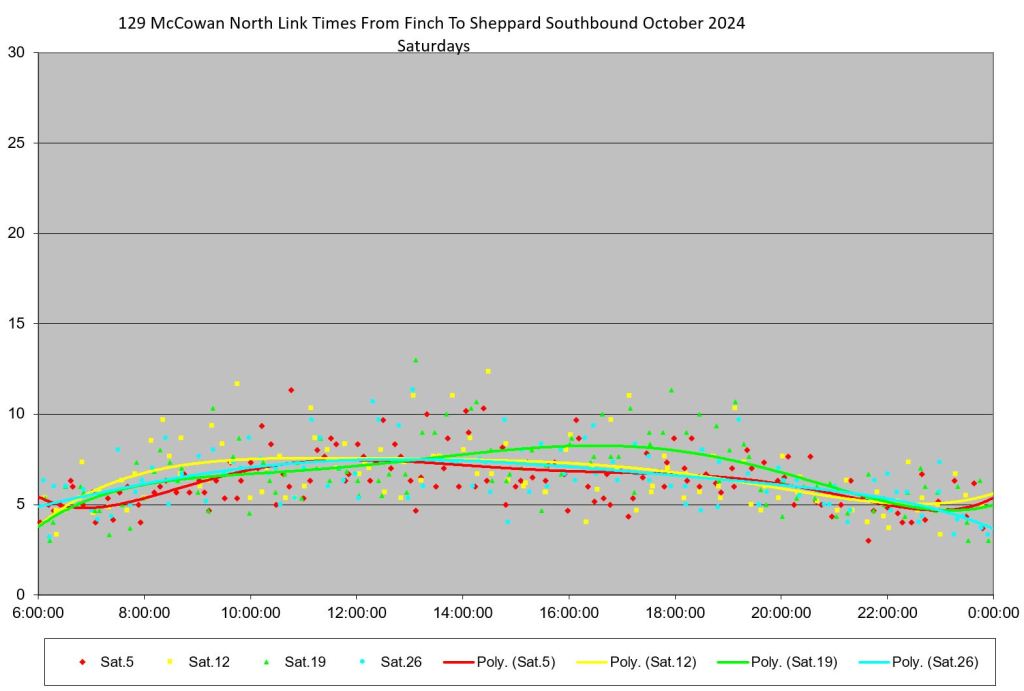
Weekend charts are included at the bottom of this set. There was only a minor change in travel times on the 26-27th.
Articulated vs Standard Sized Buses
According to the schedule summary (shown near the start of this article), the 129A service to Major Mackenzie is supposed to operate with standard sized buses (12m), while the 129B service to Steeles is supposed to run with articulated buses (18m). In practice, this is not necessarily how the buses are assigned. Partly this is due to the need for more artics offpeak when the Steeles service is comparatively more frequent, but partly it is rare on mixed-mode TTC routes for vehicles to be assigned exactly as scheduled. This can produce capacity problems when a standard sized bus runs on a headway designed for a larger vehicle.
(In the days of mixed size CLRV and ALRV streetcars, this was a common problem exacerbated by the relative unreliability of the ARLVs.)
The actual spacing of buses on 129 McCowan North varies from the schedule for many reasons, and so the actual gap a standard or artic might be carrying does not necessarily match the planned value. However, if peak periods were operated exactly as designed, it would be the artics on the 129B Steeles service carrying shorter gaps while some of the standard buses on the Major Mac service carried the wider ones. This is due to the 129Bs being inserted between two 129A runs.
The chart below shows the service for October 9 (already discussed above) with the lines coloured to indicate the type of bus on each run. Blue are standard buses, orange are artics. The day starts off with the 129B Steeles service operating with artics as designed and this is the case through to late evening when some of these runs have standard buses. However, this is a period of lighter loading when the smaller bus can handle the load. If anything, there are more runs operating with artics than the schedule summary would imply (note how many artics operate as 129As to Major Mac).


I feel they totally messed up the 129 service. They should have left it as it was before this change to artics. I remember when Malvern had it a long time ago, they’d send out artics on random rush hour runs. Now with this change, I see packed 129As and empty 129B artics. I don’t get why they did this… other than to save money to operate less buses? Also on a side note, on artic routes they often don’t fully run them as all artics. 939 is a good example which leads to overcrowding.
Steve: The TTC’s inability to run the correct vehicle for a scheduled service has been a problem for as long a they have had more than one size.
LikeLike
I have heard from the grapevine that the original plan was to make A and B variants both artic. However, there is an ongoing problem with artic buses dealing with level crossings, which is why the 129A was not made artic, forcing the uneven scheduling.
Steve: This begs the question of whether it was a good idea in the first place. BTW as you will see from the charts showing where the standard and artic buses actually go, several artic trips go to Major Mac. If there is a problem using these buses north of Steeles, someone has not told the dispatcher.
LikeLike
I have witnessed a few times the crowding on the 129 isn’t as bad as I thought it would be going northbound in afternoon peak hours. I guess the 939 can relieve some of the load up to Finch with people walking a little father than waiting 15 minutes if the miss a bus at that specific wide gap moment.
I have also witnessed how bad the 905 Eglinton East Express was with artics on a wide headway. Finally they removed them from weekday service. The 941 Keele Express is another route they made worse with almost 20 minute headways. Riders would rather take the local 41 Keele than to wait which means they can dispatch standard buses on half the runs in the afternoon without crowding. Now why does this service even exist in this case.
The 902 Markham Rd Express seems to be a case where artics did improve capacity. I think it was done mainly to serve as alternate to Line 2 since Scarborough lost the SRT.
LikeLike