
This is the third in a series of reviews of various transit lines in Toronto. Although the streetcar fleet is not yet reporting passenger loads (automatic counter installation is in progress), it is still worth looking at the quality of service provided on some of these lines.
For 505 Dundas, I will look at seven days’ operation from Monday, September 16 to Sunday, September 22. The intent is to show that conditions on the route are not “one of” instances, but a continuing pattern. The article includes:
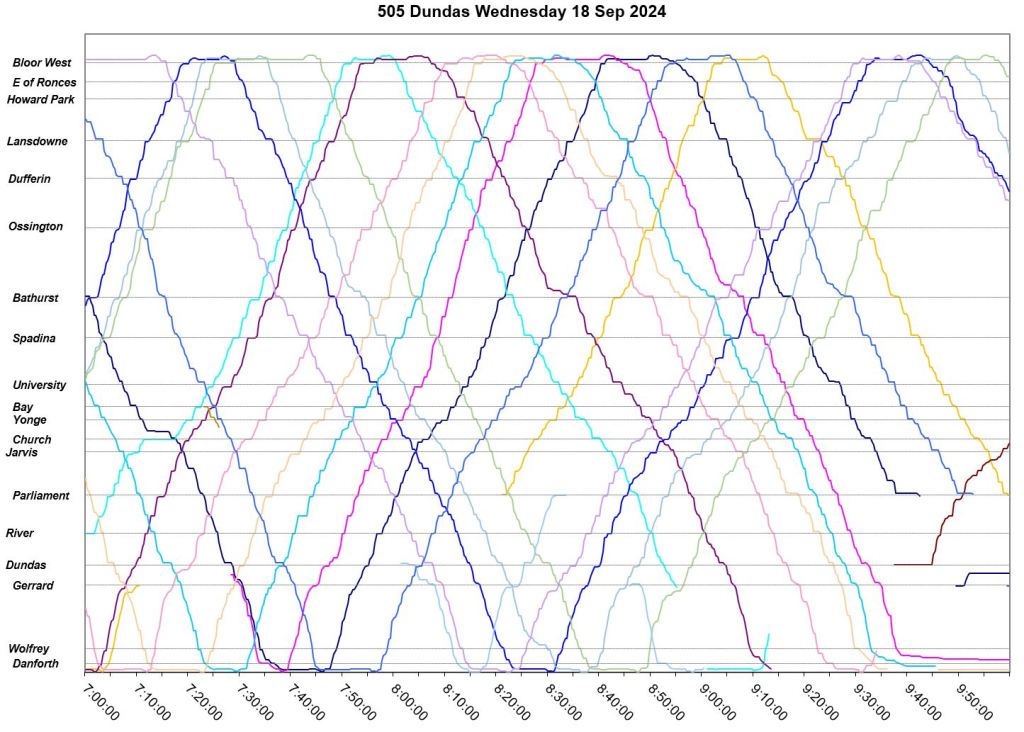
- operating charts (sometimes called Marey diagrams after their supposed inventor well over a century ago),
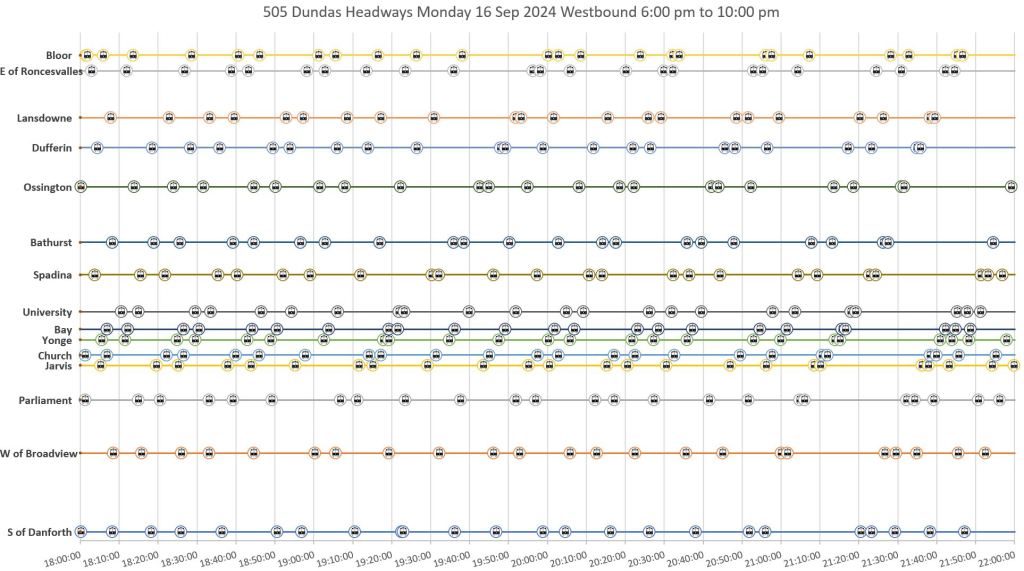
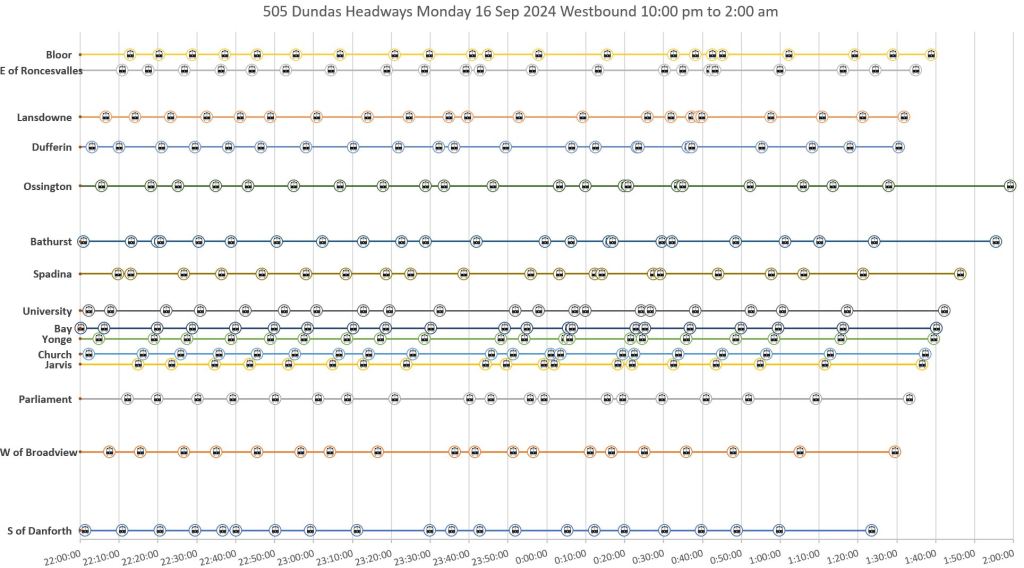
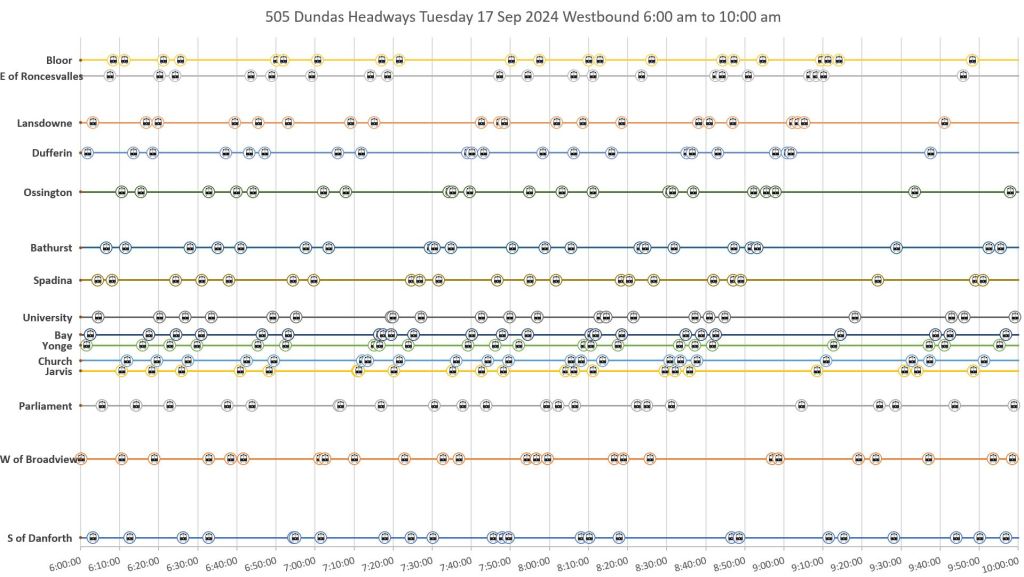
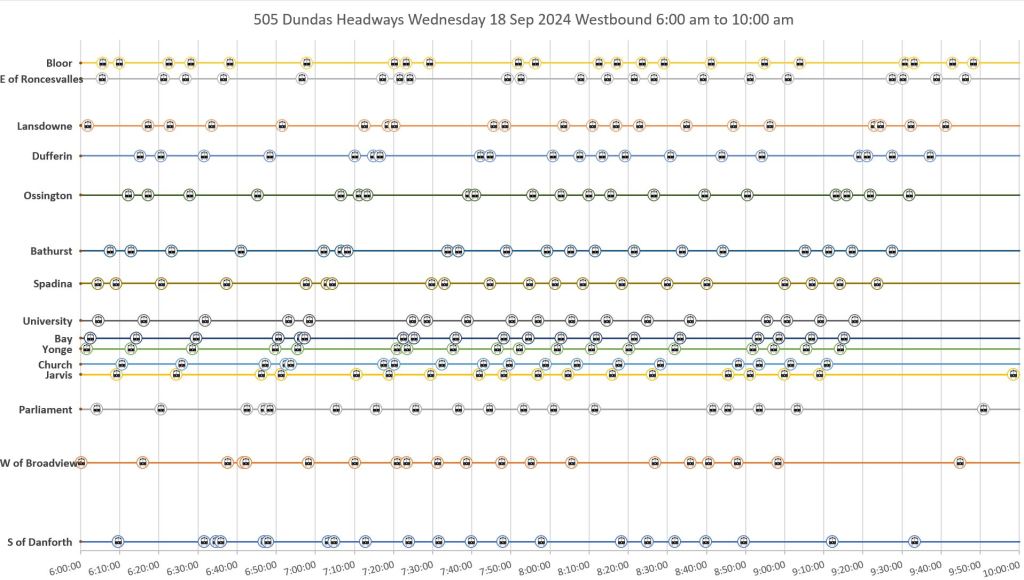
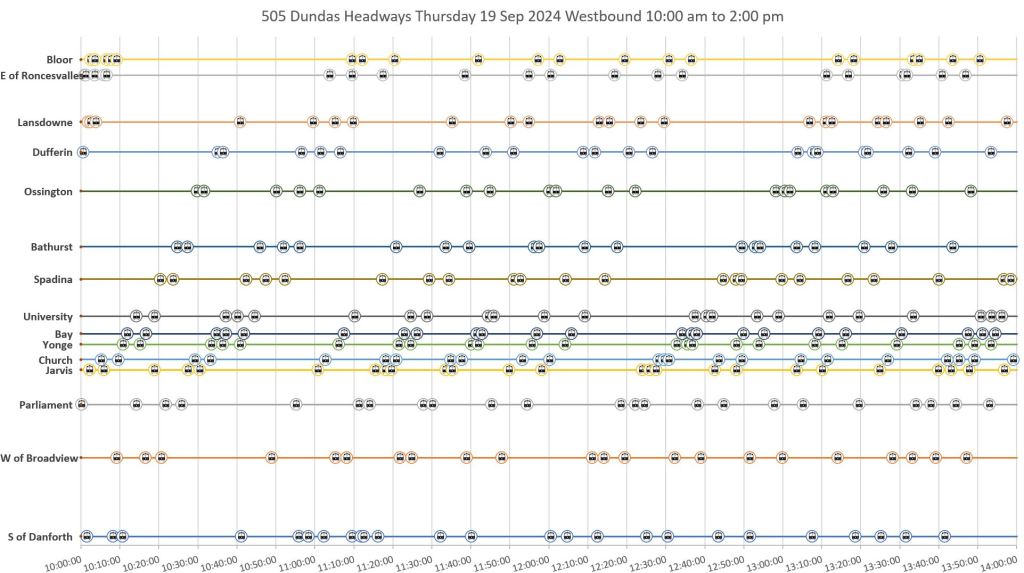
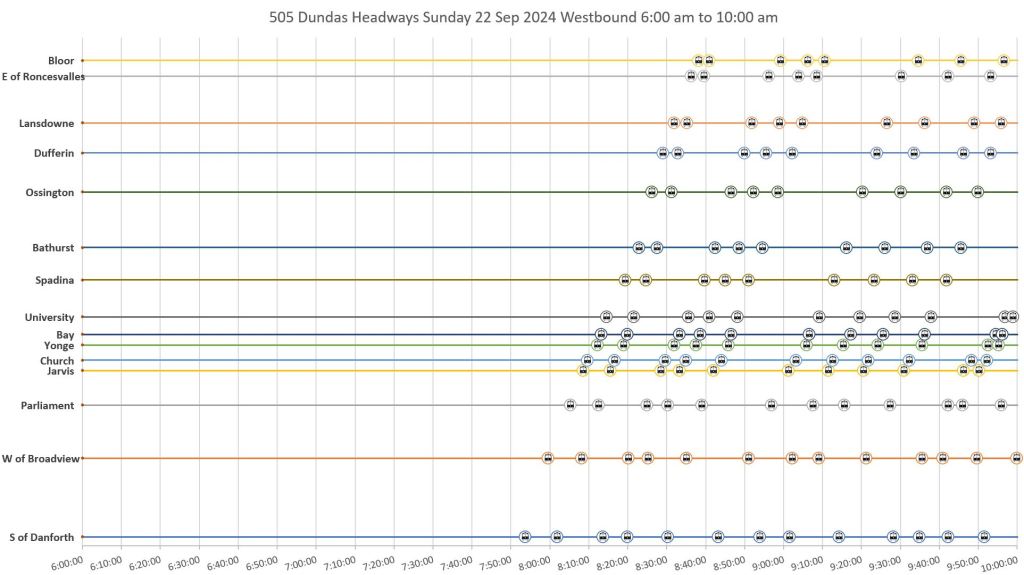
- vehicle spacing charts showing bunching and gapping of streetcars, and
- headway summary charts for the month showing the range of headways at various times and places along the route.
An added topic at the end is a review of travel times on Dundas between University Avenue and Bathurst Street and the effect of parking restrictions that were implemented there earlier in 2024.
Items of particular note:
- During some periods, streetcars leave terminals fairly evenly spaced, but do not stay in this condition across the route. The bunching and gaps seen by most riders are not as good as terminal-based stats might indicate.
- Some periods when there is no specific event impeding service see pairs, and occasionally trios, of streetcars travel together for extended periods.
- Terminal dwell times are adequate for a rest break in most periods, but there are times when this does not occur. Short turns, notably westbound at Lansdowne, become more frequent.
- Two major delays/diversion occurred during the period covered by this article from demonstrations downtown. The after-effects on service lasted hours beyond the events.
- Only one event, an early-morning “operational problem”, triggered the use of shuttle buses, at least to the extent that these were tracked and appear in the data feed.
There are a lot of charts in this article. For some readers, this will be a case of “TL,DR” but others really like all of the detail.
Scheduled Service
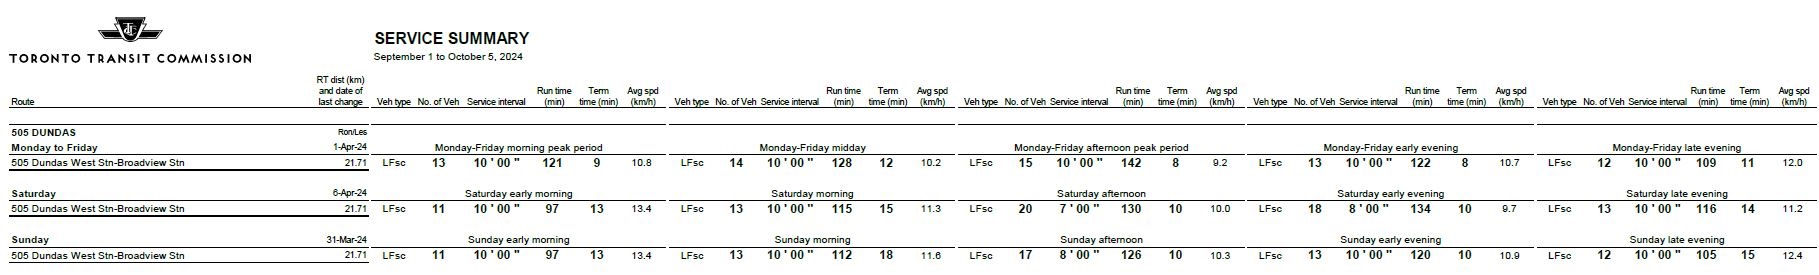
Monday, September 16
Service on September 16 was fairly well-behaved compared to other days, but some bunching and gaps are obvious in the charts below. Note how some pairs of cars stay together over round trips. There were no eAlerts issued on this day. Layover times at both terminals are reasonable, and no cars were short-turned.

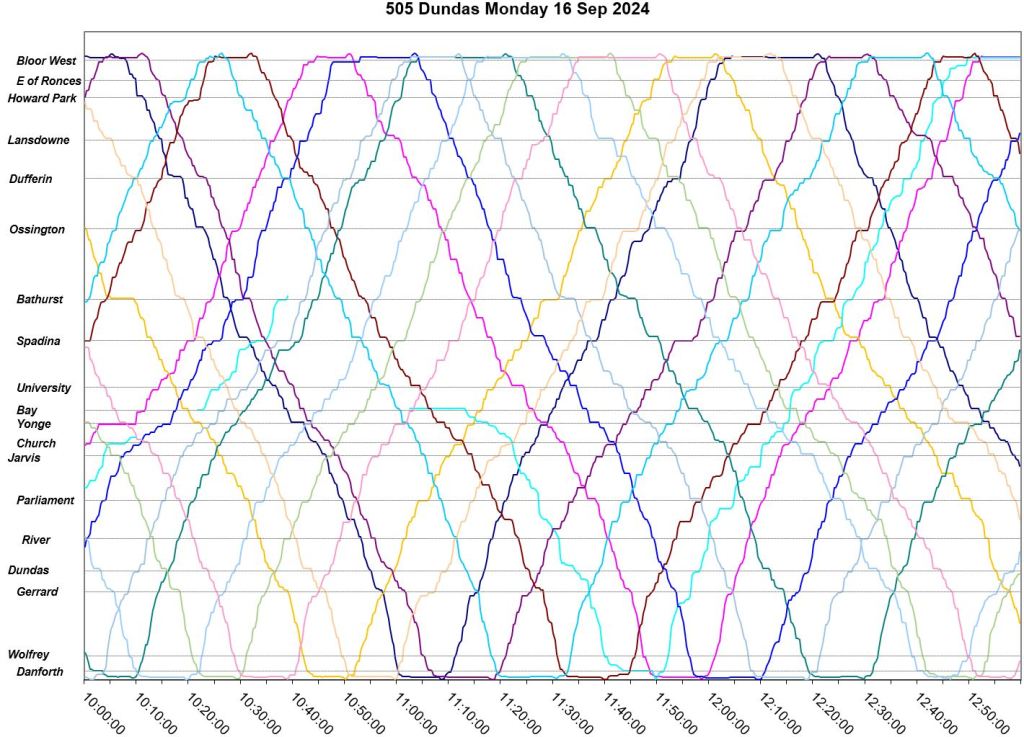


The charts below show the spacing of cars at key locations westbound. Note how even when cars leave Broadview Station on an even spacing (bottom of the charts), they are bunched by the time they reach Yonge Street.


Eastbound service shows a similar pattern with even service at Dundas West becoming bunched as cars move eastward across the line.


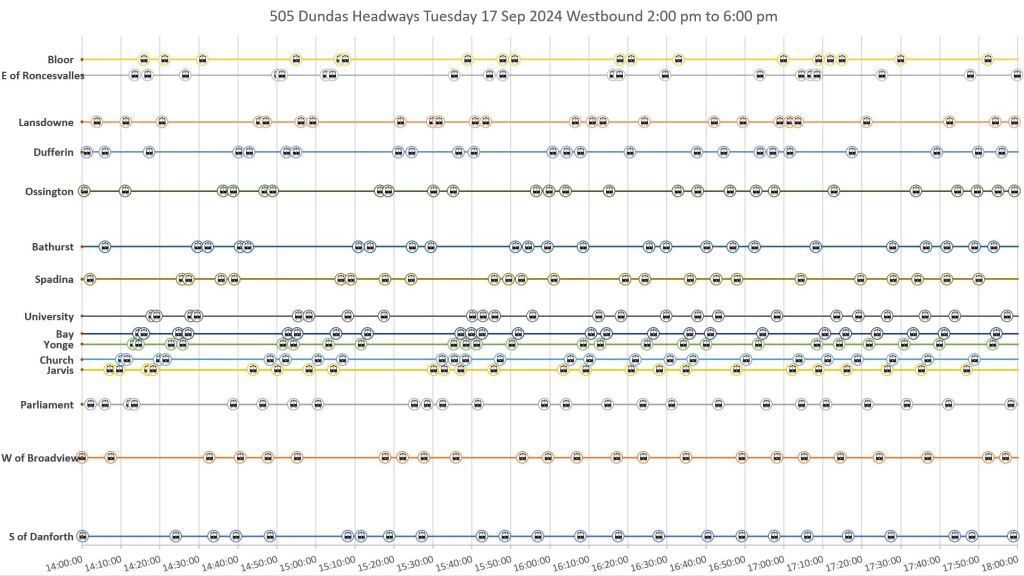
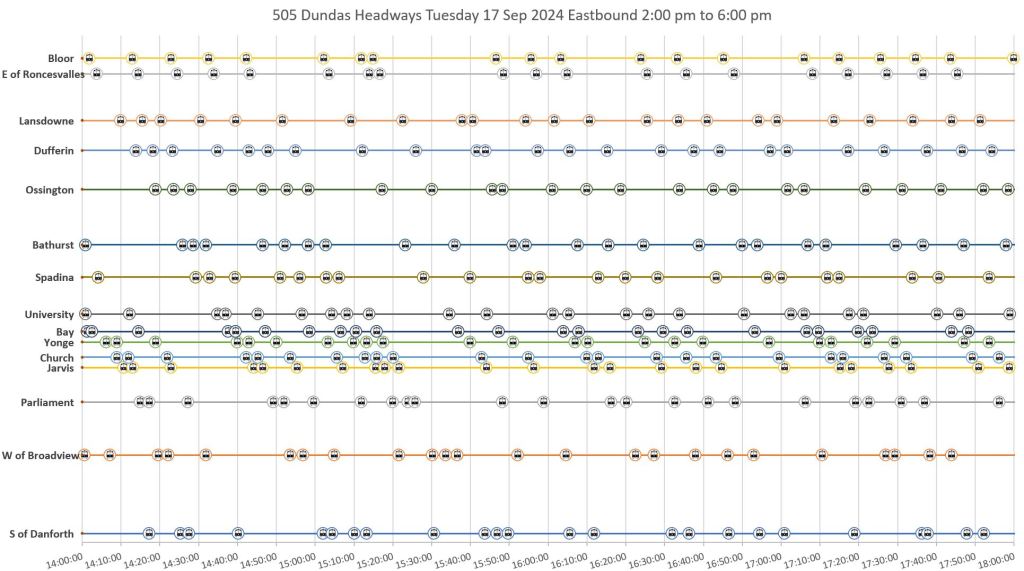
Tuesday, September 17
EAlerts:
- 9:02 Diversion via Bathurst/Carlton for a collision
- 1:20 Diversion via Parliament/Gerrard for a medical emergency
In the tracking charts:
- Service is broken in the central area just after 9am as cars go off route. The resulting westbound gap is not sorted out until the return trip from Dundas West after 10am.
- There is a break in service to Broadview Station caused by a short turn via Parliament and Gerrard just after 11am. The resulting very wide gap from Broadview Station travels across the route and is partly sorted out eastbound.
- There are occasional short-turns westbound at Lansdowne which fill gaps in some cases, or create pairs of eastbound cars in others.
- There is no track showing the 1:20 diversion at Parliament cited in the eAlert.
- There are few locations and times showing congestion effects (lines that become more horizontal through an area of delay.
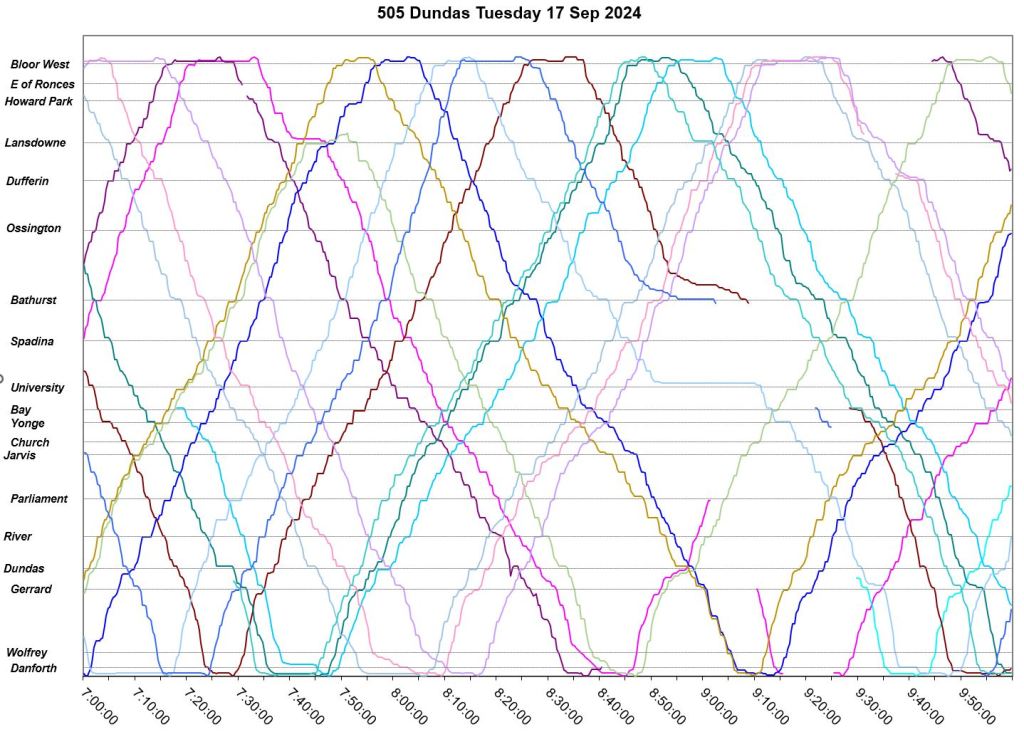

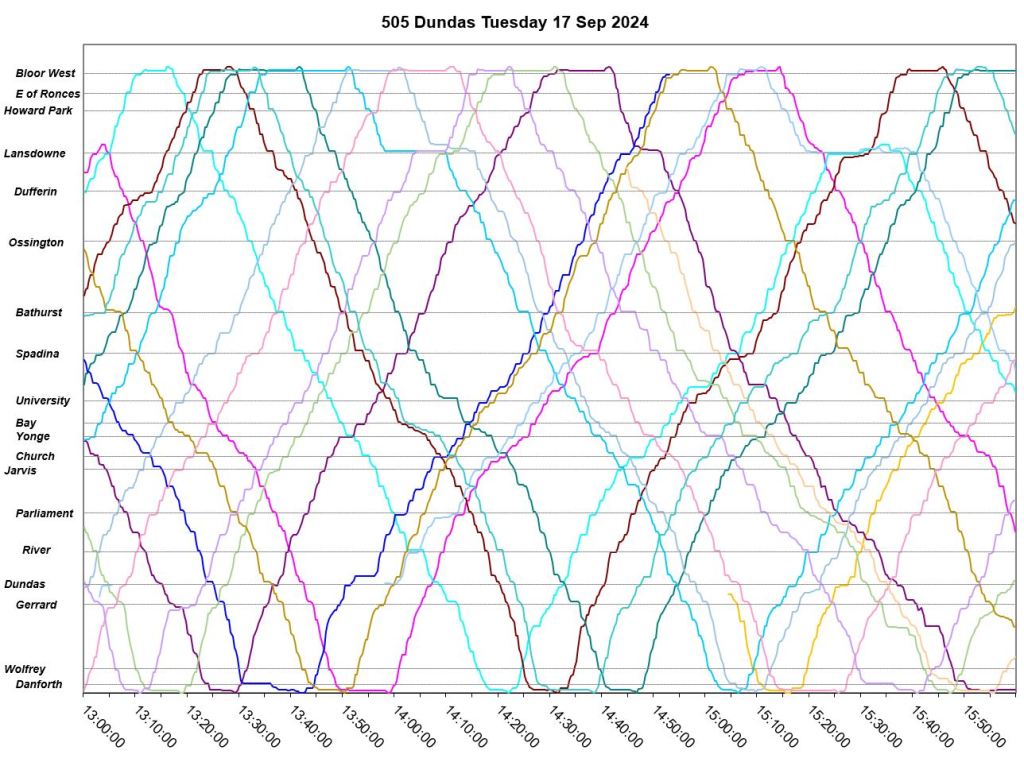
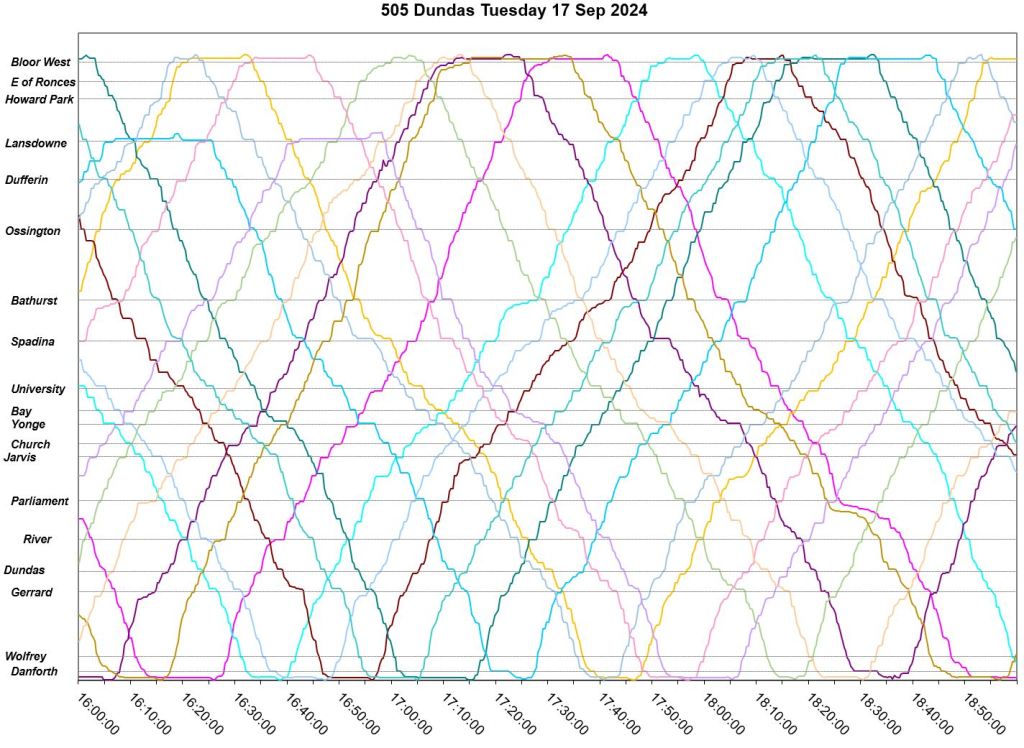


As on Monday, note that even when service is fairly well-spaced leaving terminals, bunches form over the course of the trip. This happens in both directions.
Westbound:


Eastbound:


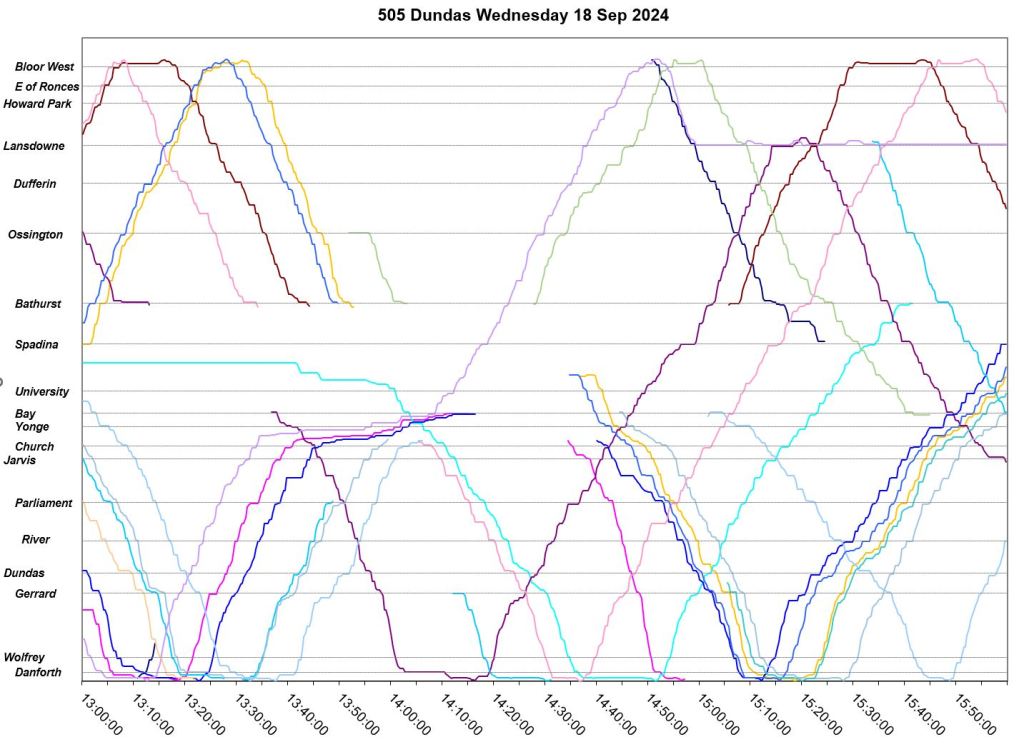
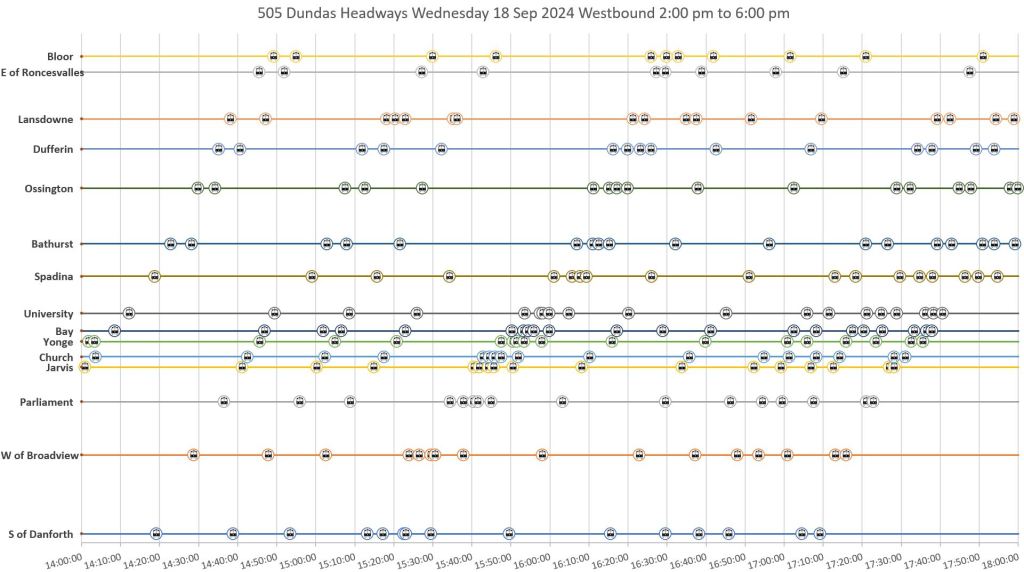
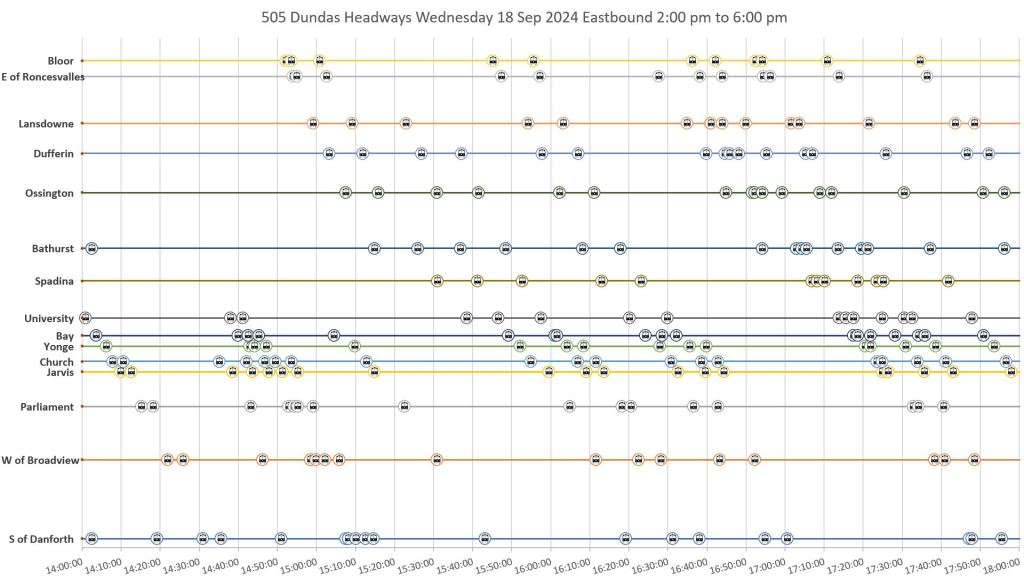
Wednesday, September 18
September 18 was a very different day from Monday and Tuesday with a fire, a demonstration and two road blockages.
EAlerts:
- 9:46 Divert via Parliament/Gerrard to Broadview due to a fire
- 13:12 WB diversion via Bay/College/Dundas for a demonstration
- 13:33 EB diversion via Bathurst Bathurst/College/Bay for a demonstration
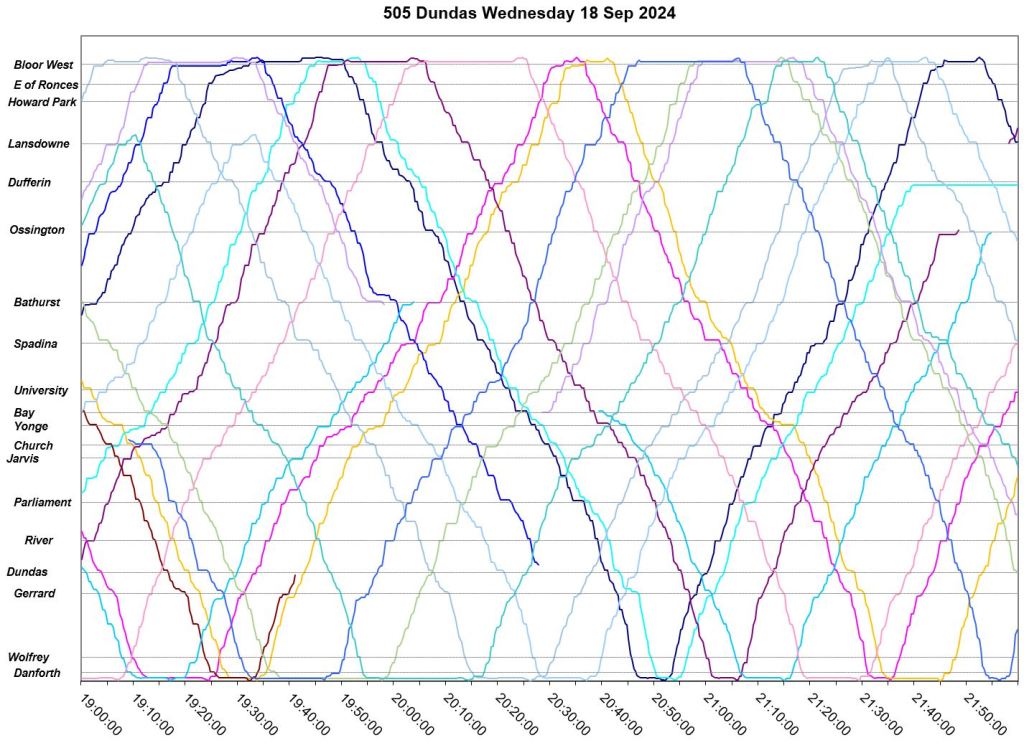
- 21:48 WB diversion via Ossington/College for a blocked track
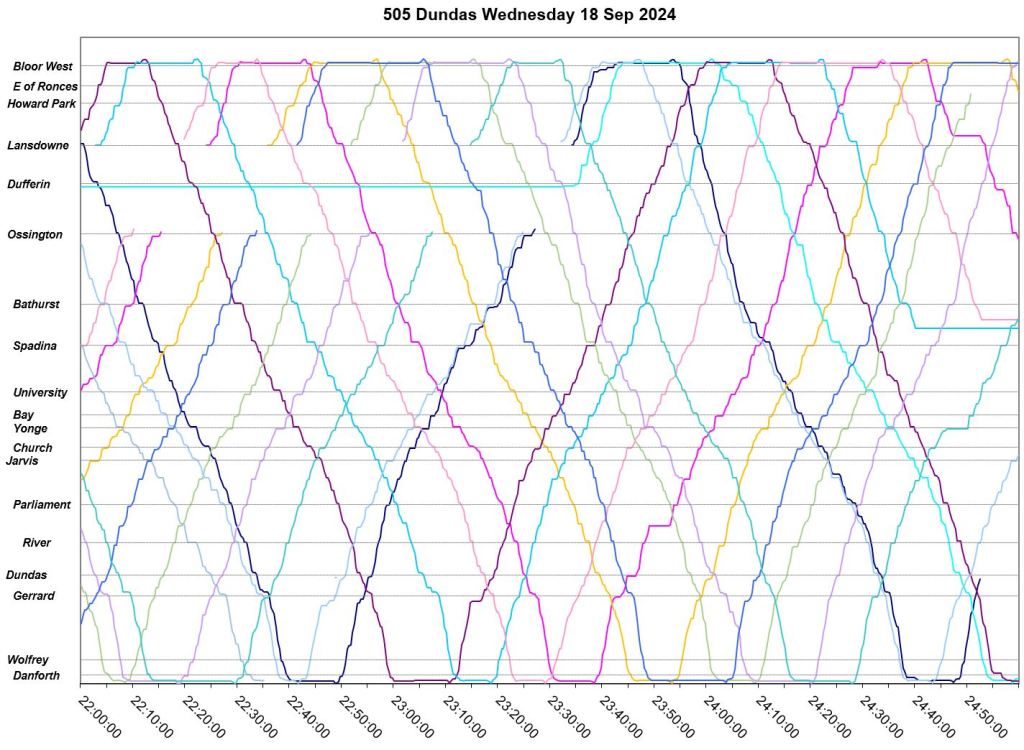
- 00:58 EB diversion via Bathurst/College/Bay for a blocked track
(Note: Data are missing for about 10 minutes just after 10am.)
The combination of a fire just after the AM peak and a demonstration at Yonge Street severely disrupted service through the day.
Even before the eAlert for the fire was posted, cars were holding at Broadview Station for over an hour. Some cars disappear in the east end and reappear later at or near Dundas West Station likely having travelled via a parallel route and not necessarily in service. When service did resume, it was badly bunched with may cars eastbound and few westbound between 11:30am and 1pm.
The demonstration left many cars east of Yonge Street and there was no service at Dundas West for over an hour. Through the afternoon and PM peak large gaps remained that were not resolved until early evening.
The “blocked track” even held one car on Dundas at Dufferin for two hours. Westbound service diverted via Ossington and College, but regular spacing was maintained.
After midnight there was a delay eastbound between Bathurst and Spadina that caused all cars to be diverted via Bathurst, College and Bay until the end of service. (The chart for the period after 1am is included in the PDF chart sets at the end of the article.)
It is not clear what, if any, supplementary bus service filled in these gaps as the replacement buses are not reliably included in the tracking data. There is no mention of shuttles in the eAlerts.


The charts of vehicle spacing show the large service gaps and bunching that persisted through the day.
Westbound:


Eastbound:


Thursday, September 19
EAlerts:
- 7:13 Diversion to High Park Loop for an operational problem
- 8:49 Operational problem at University
- 16:04 No service to Dundas West for a medical emergency, service turned back at Lansdowne
Although there were three alerts, there were additional problems affecting service.
The operational problem reported at 7:13 actually began at about 6:40 am holding three eastbound cars south of Dundas West. One car diverted to High Park. Eventually they returned as a parade at about 7:20am.
Shortly later, a car held eastbound at Lansdowne creating a gap behind that parade that travelled east to Broadview Station. Between 8:25 and 9:10, 12 cars left Broadview Station westbound. At this point, much of the route’s service was westbound with only a few cars eastbound.
Their progress was impeded west of Jarvis by traffic congestion, and a large, widening gap followed them across the city. A few streetcars diverted to Carlton/College to make their trips after 9:40am, and they eventually reappear in the west end.
At about 1:40pm, a car holds eastbound at Lansdowne for about half an hour. Eventually it circles College Loop (Lansdowne/College/Dundas) and lets following cars proceed. Service is sorted out later with several short turns, but regular spacing over the route is not restored until late in the PM peak.
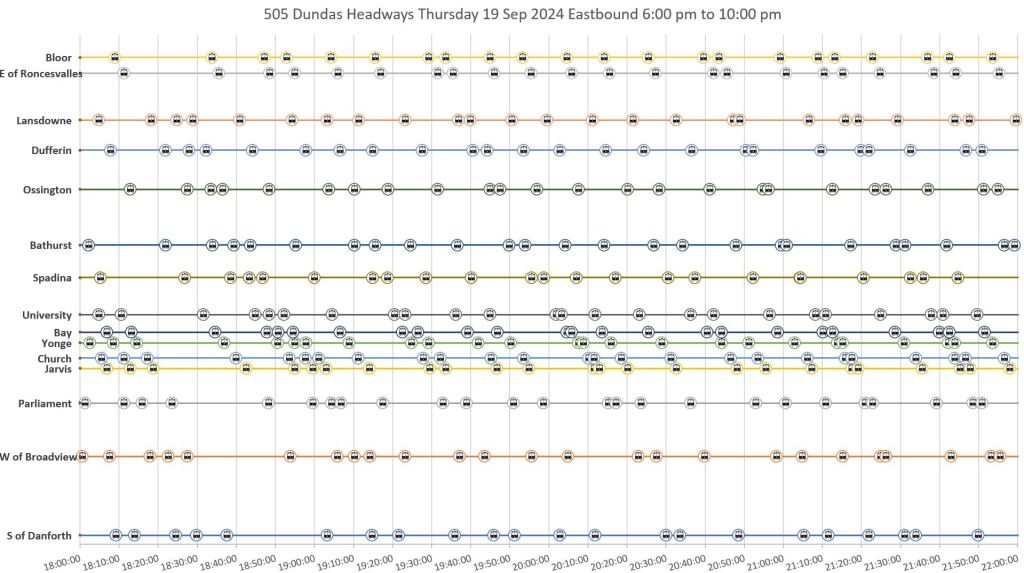
Evening service includes some bunched departures from terminals.
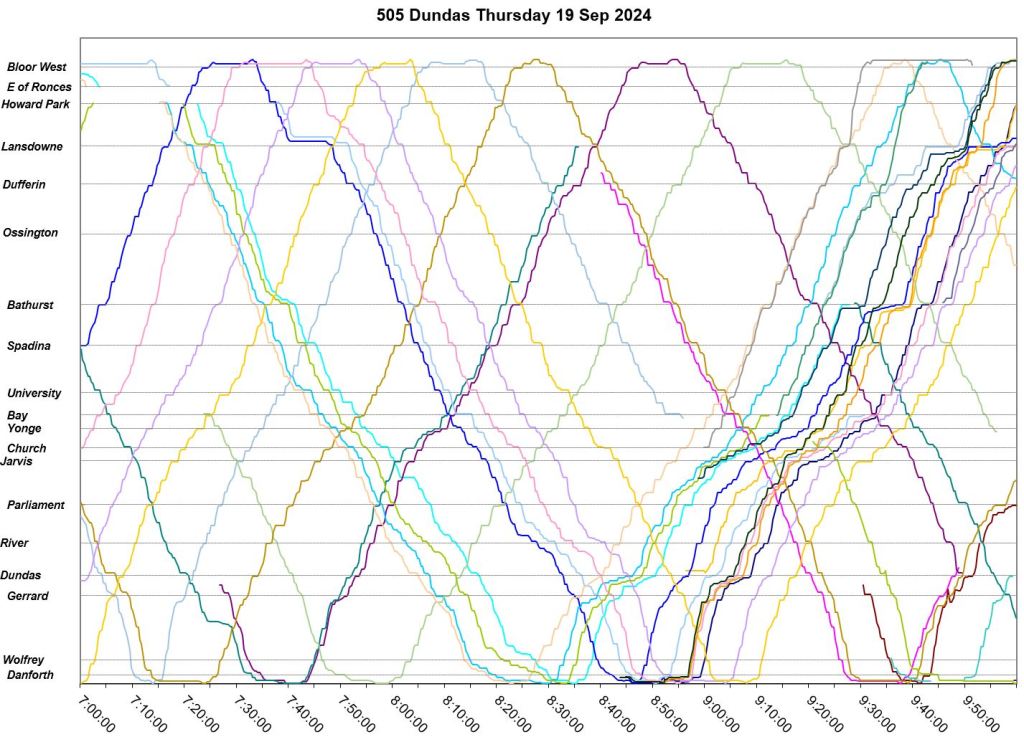
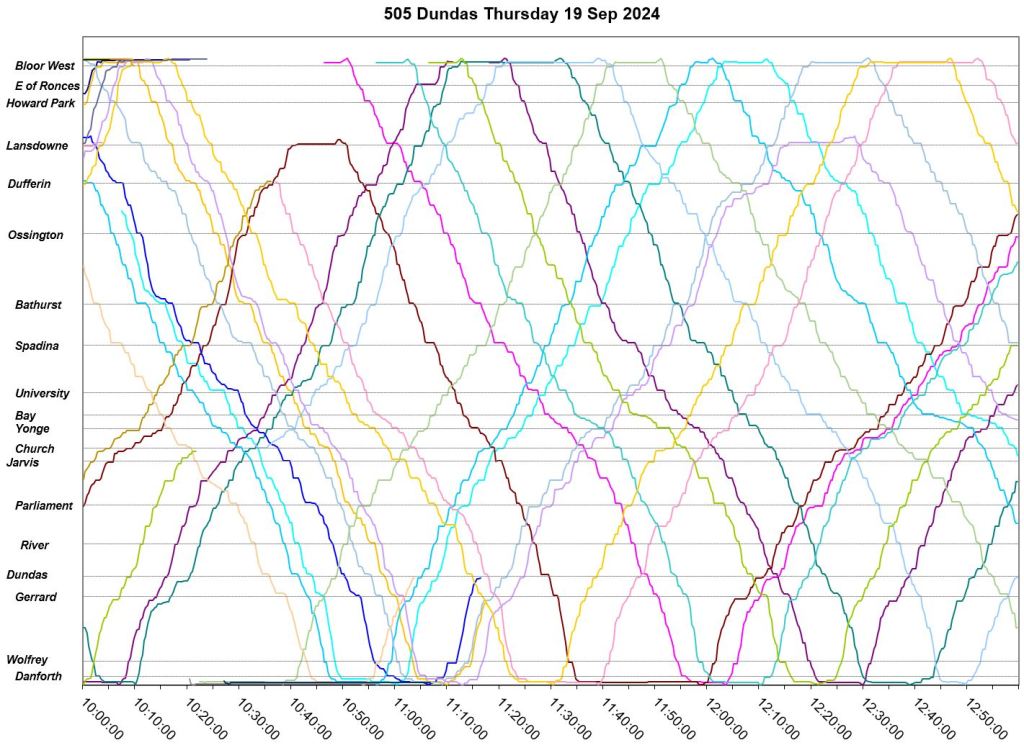

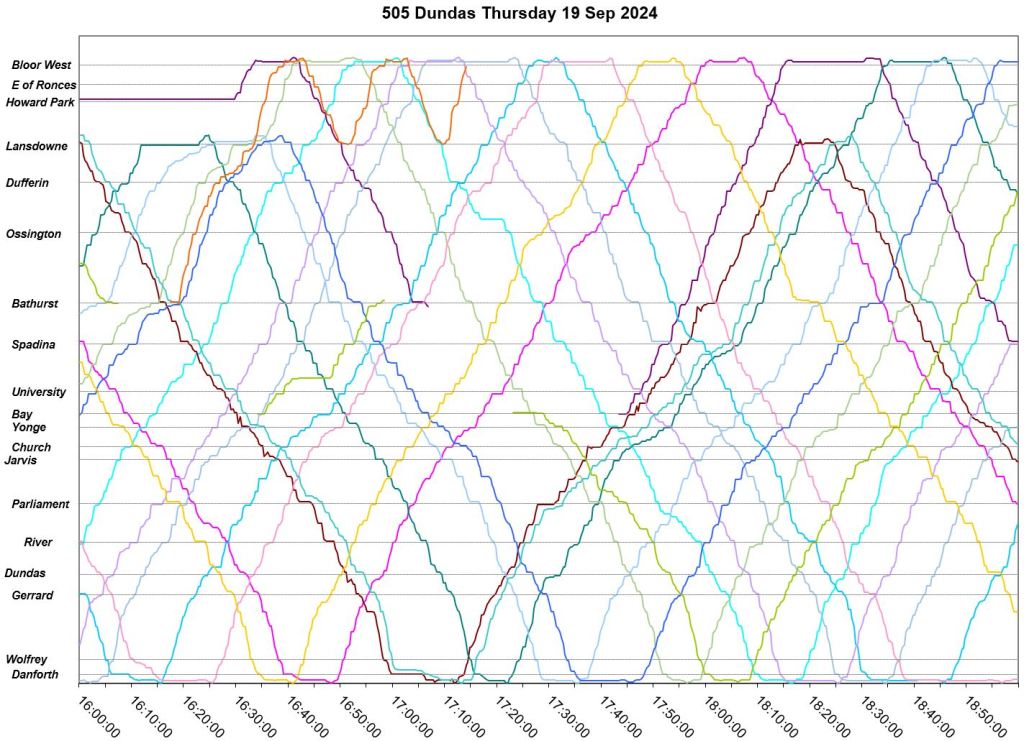
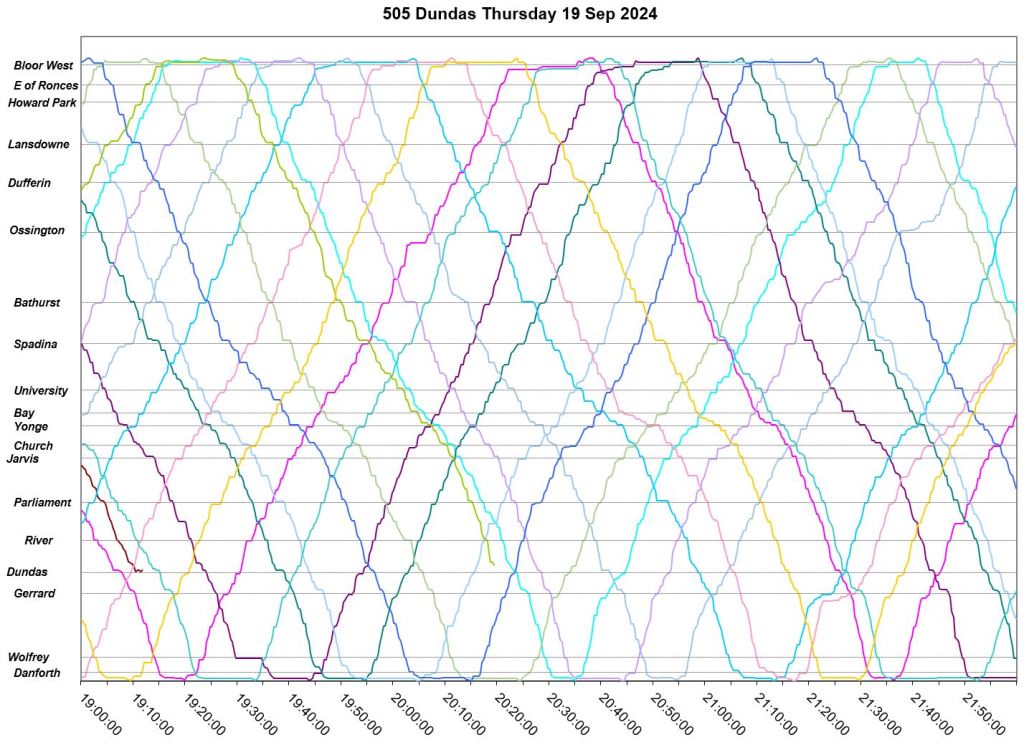
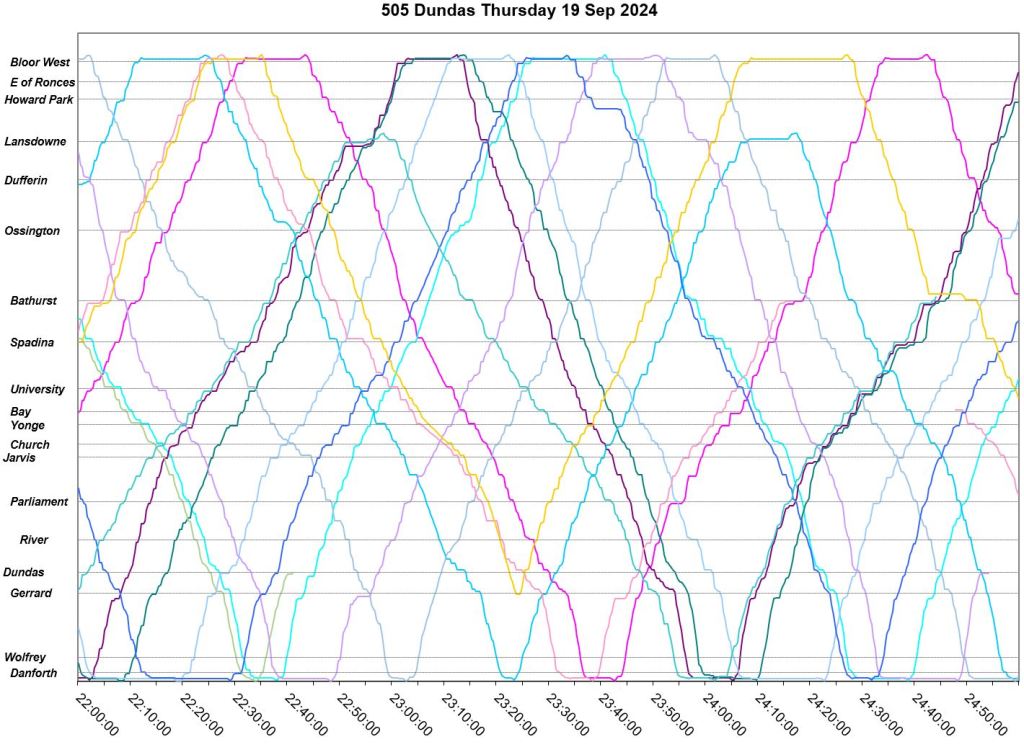
The vehicle spacing charts underscore how much of the service disruption affected the west end of the line even while service at Broadview Station remained comparatively regular.
Westbound:


Eastbound:


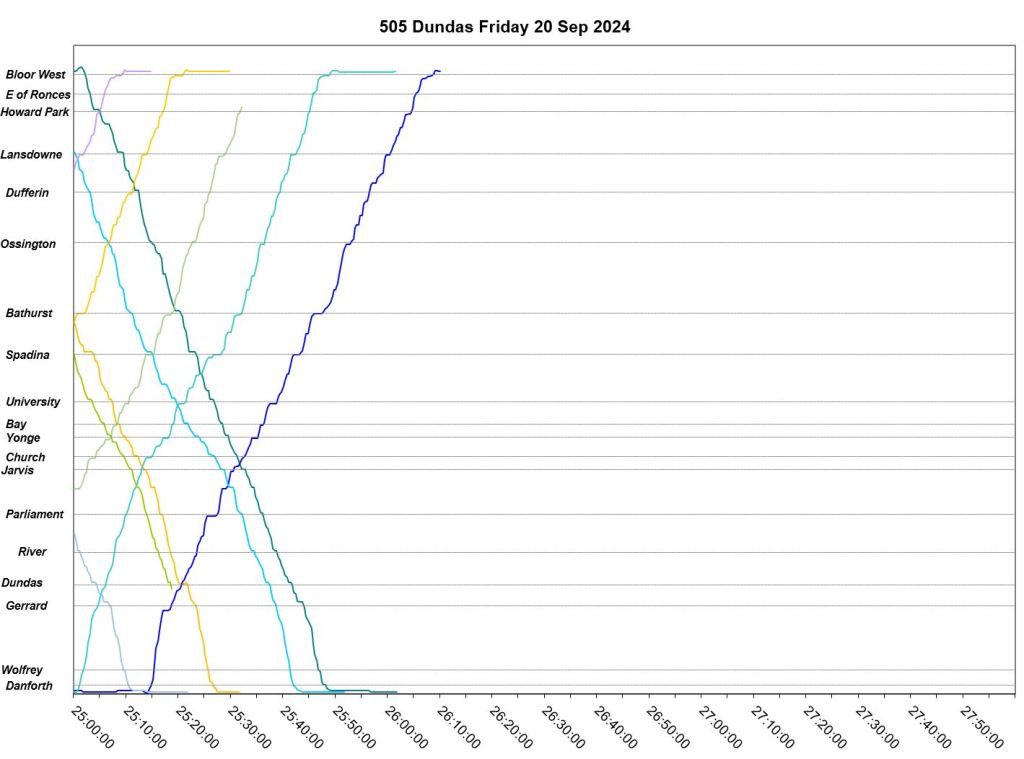
Friday, September 20
In this section, I have included the chart for the period between 4 and 7am to show the effect of the only event for which an alert was issued.
EAlert:
- 5:46 No service west of Lansdowne for an operational problem
It is not clear just what the “operational problem” was, but it required all streetcars to turn back from Lansdowne until about 7:40am. Shuttle buses operated between Dundas West Station and Dufferin Street.
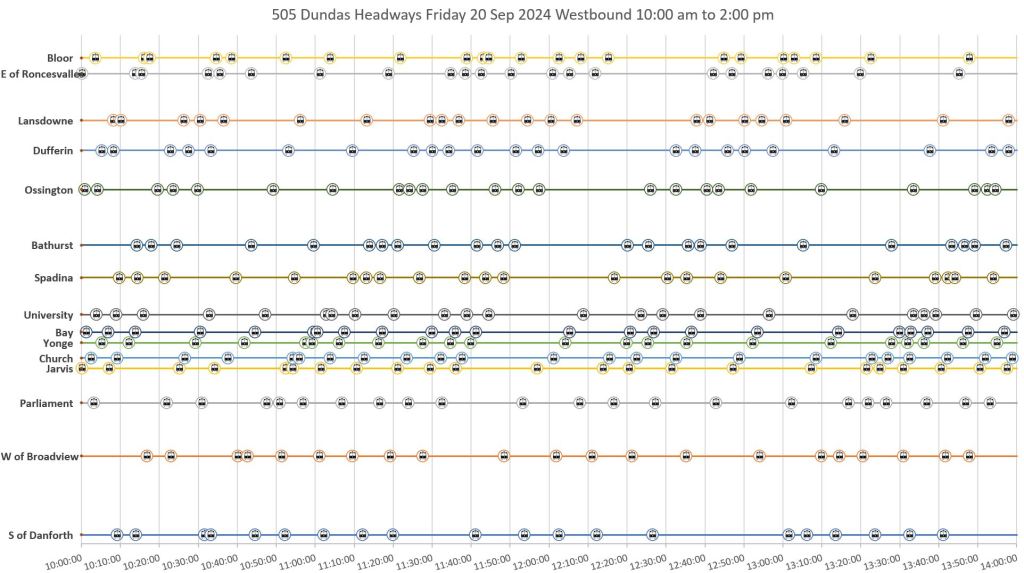
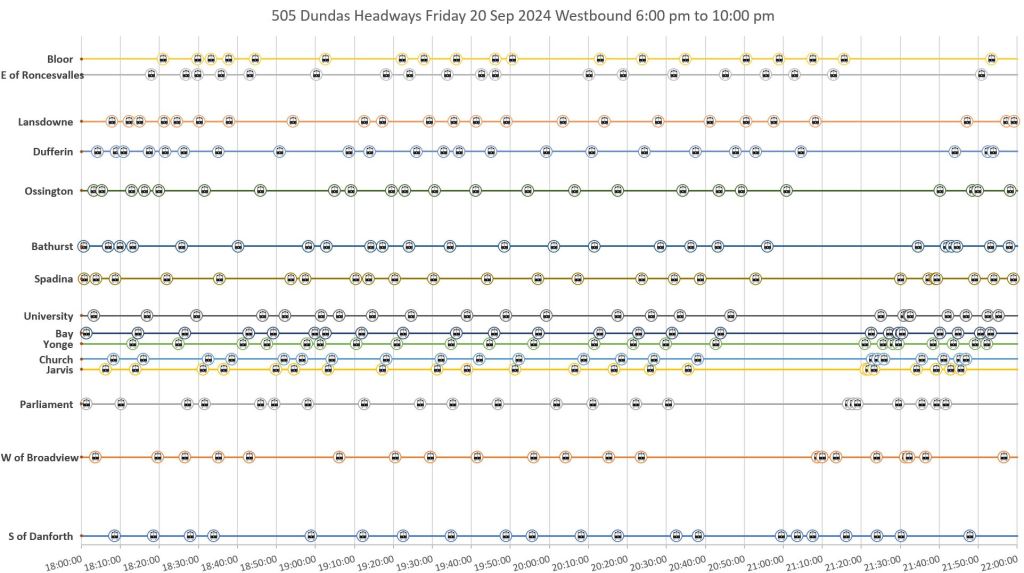
Service for the remainder of the day was relatively uneventful although there were a few persistent bunches of cars travelling across the route. Short turns at Lansdowne were used to restore service after 6pm where a group of westbound cars had been delayed by traffic near Yonge Street, and through the evening. The length of terminal layovers for some cars suggests that scheduled travel times are too tight, but further review beyond my scope here is needed to determine typical travel times day-by-day.


As on other days, service departing from terminals might be fairly evenly spaced, but does not necessarily stay that way.
Westbound:


Eastbound:


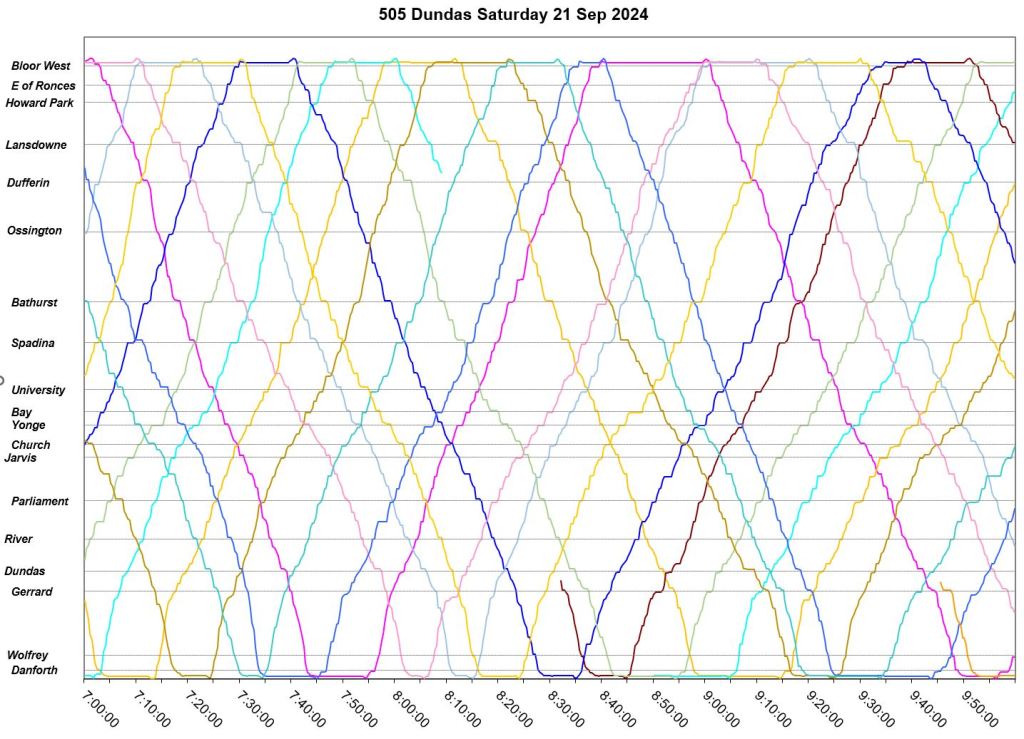
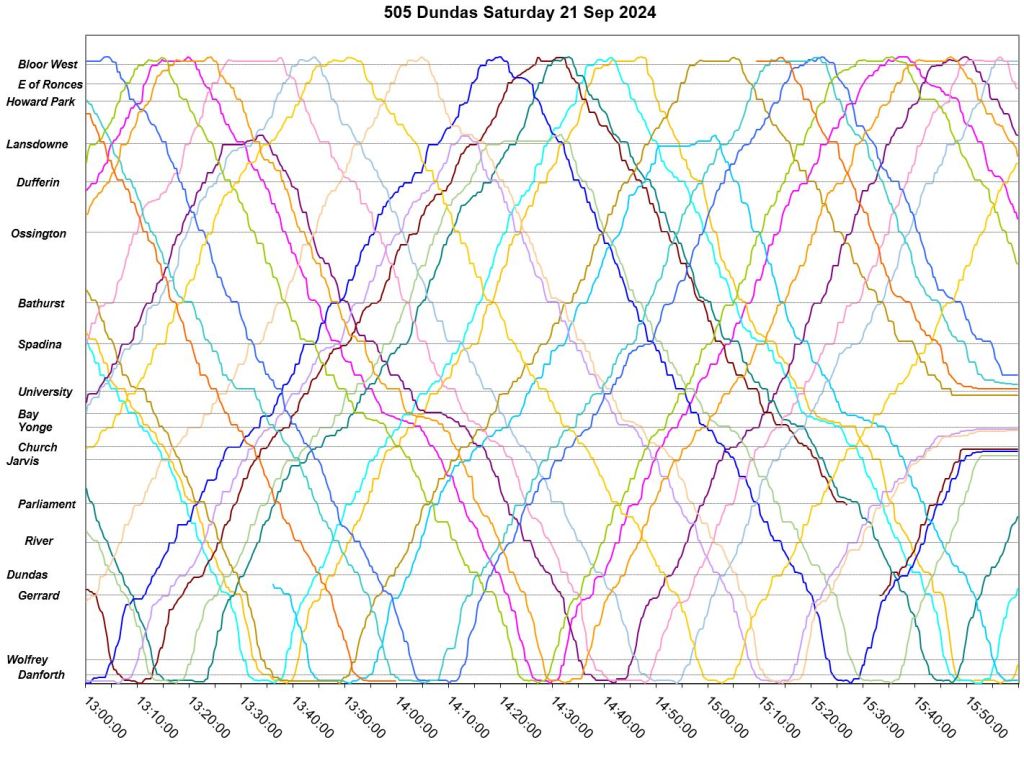
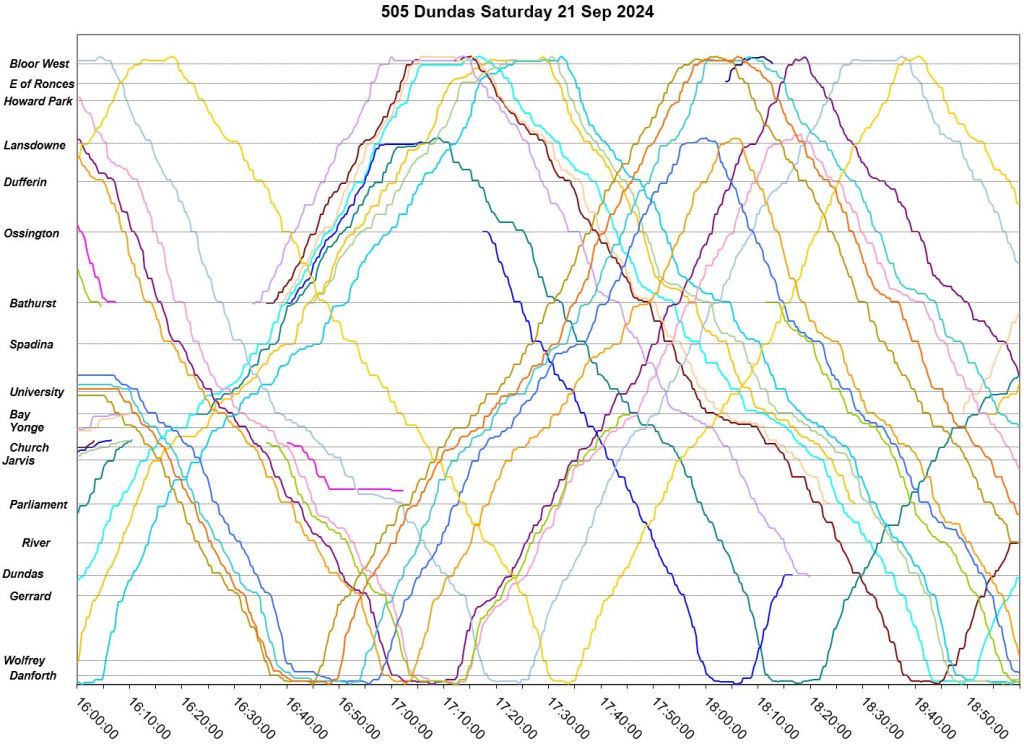
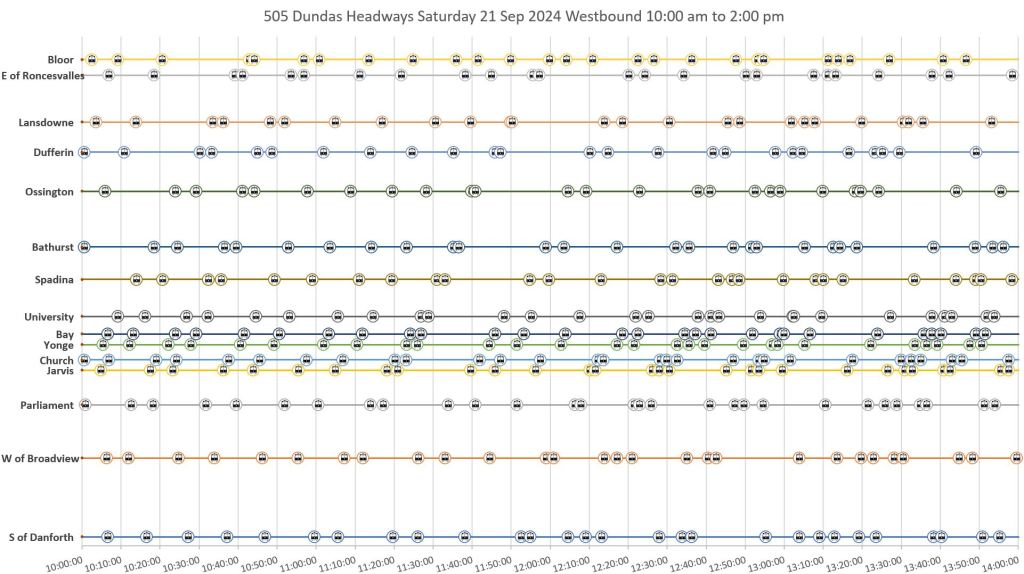
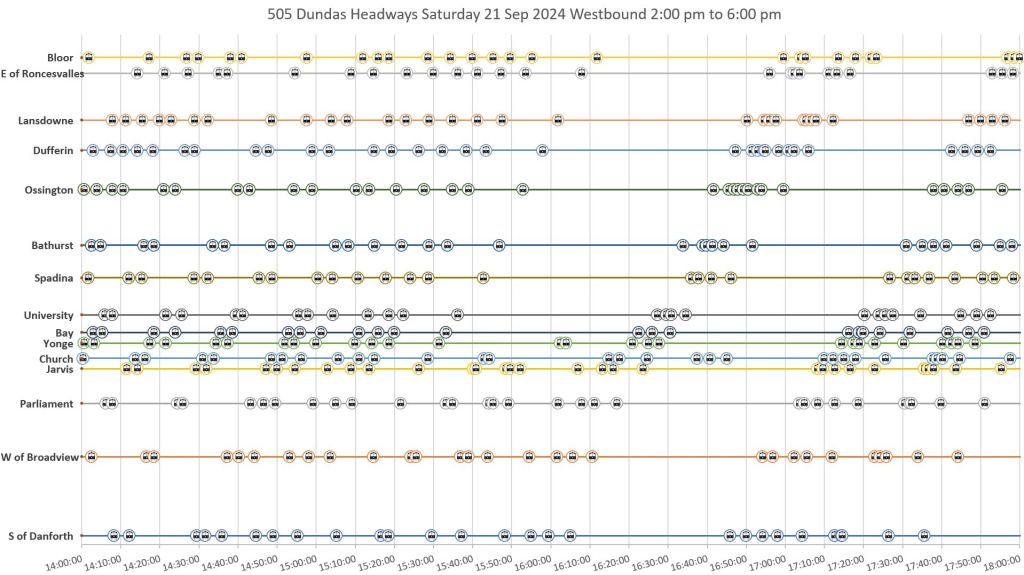
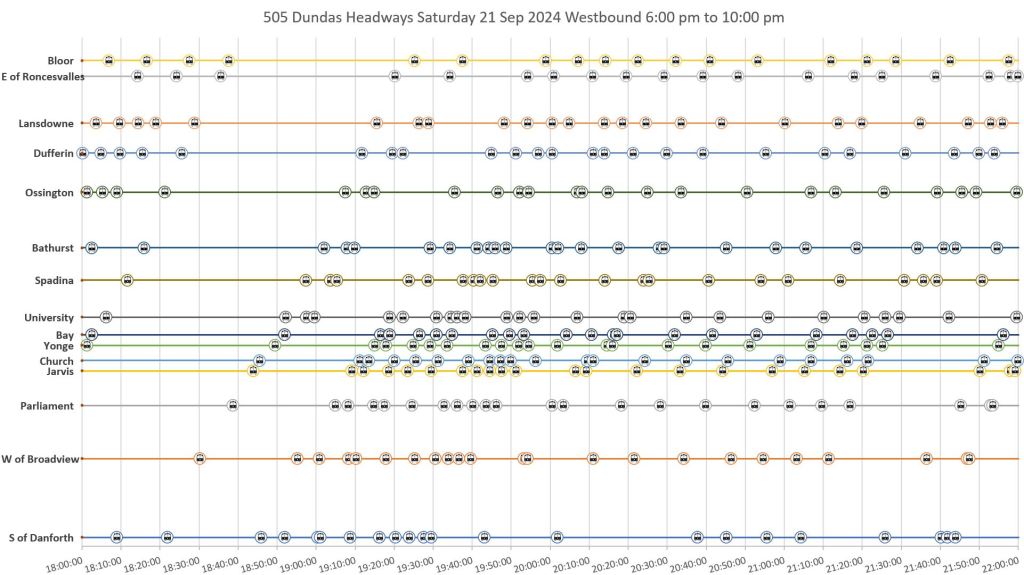
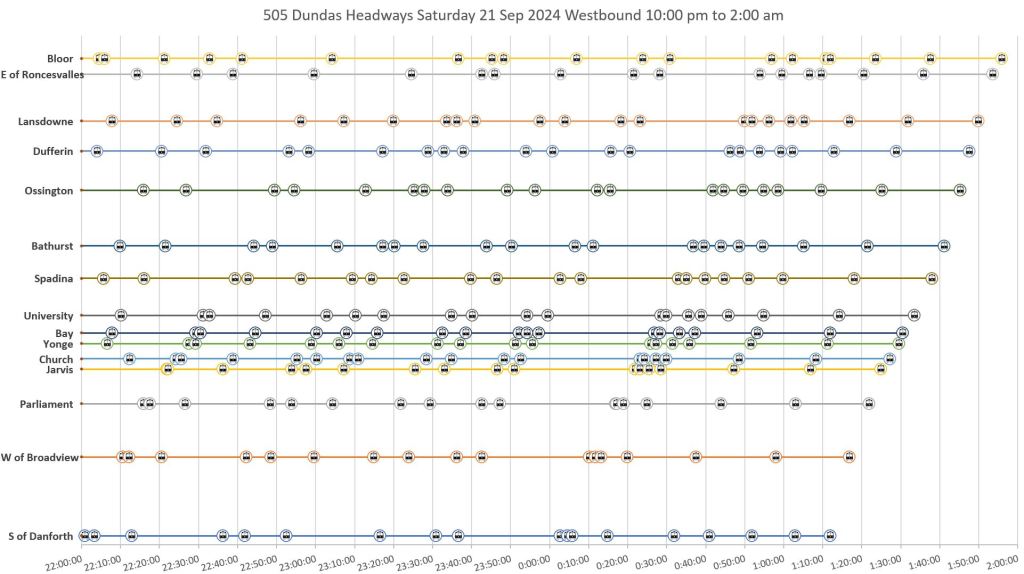
Saturday, September 21
Only one alert was issued during the day for a demonstration that blocked service from about 3:30 to 4:15pm. The alert was not issued until 30 minutes after the blockage, and the tracking data show that the diversion actually extended west to Bathurst.
The aftereffects of this, as with the event on Wednesday, extended well beyond the period service was actually blocked. Service was bunched with some wide gaps until mid-evening. Note that the wide gap in service echoes back and forth on the line until arriving at Broadview Station at 8pm, four hours after the event causing it had ended.
EAlert:
- 15:59 Diversion via Bay/College/Church for a demonstration


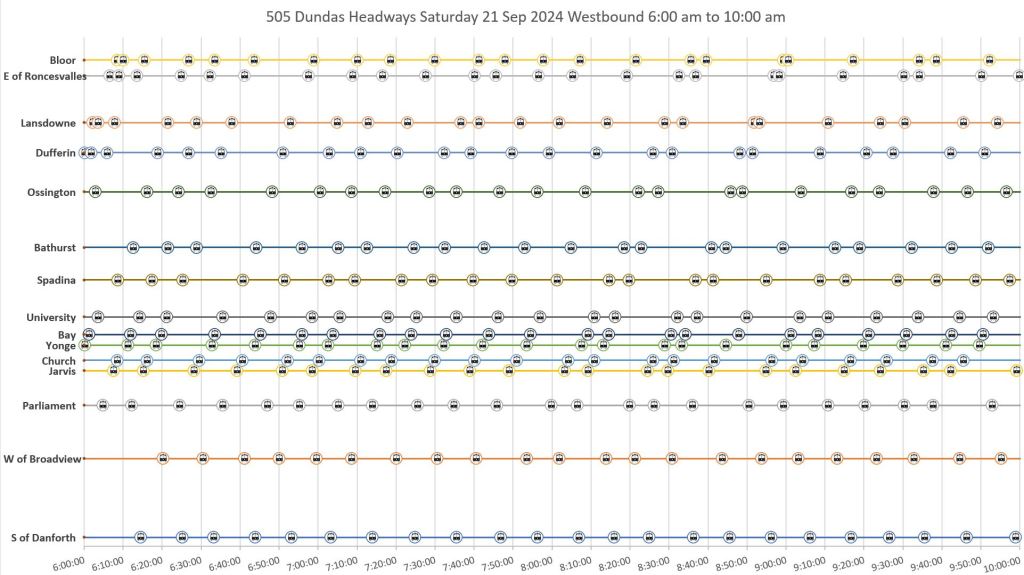
Westbound service spacing:
Eastbound:


Sunday, September 22
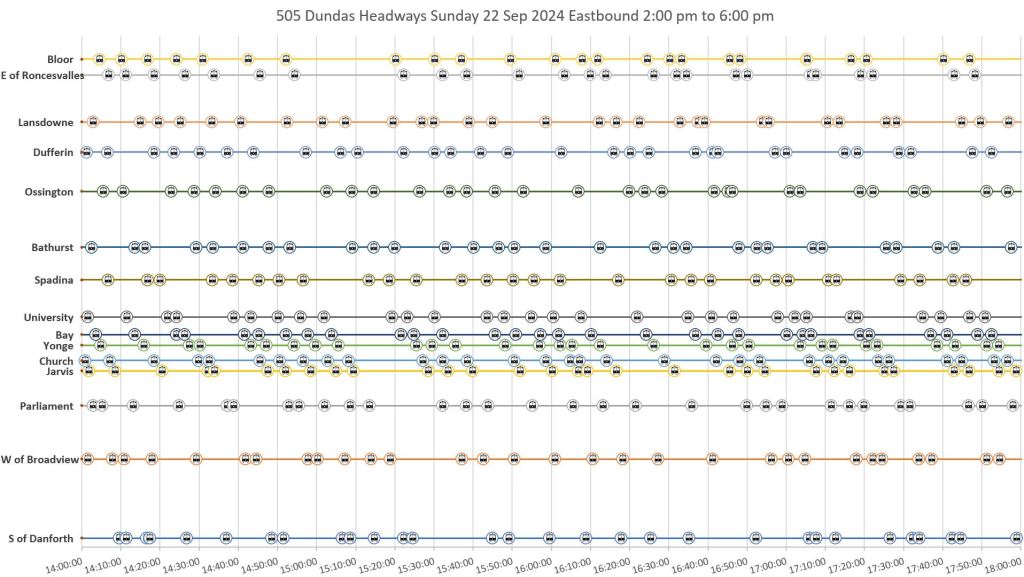
No alerts were issued on Sunday the 22nd. Service was more reliable than on most other days, but some bunching and gaps in service are quite evident. Cars were short turned mainly at Lansdowne westbound, but a few eastbound at Parliament.
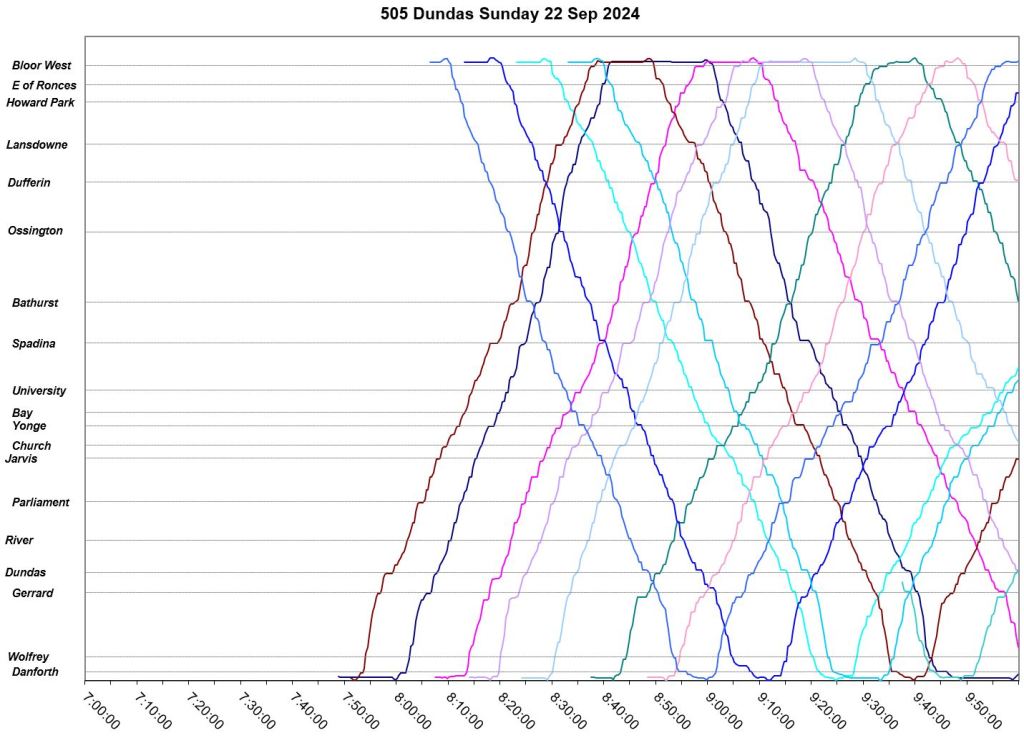
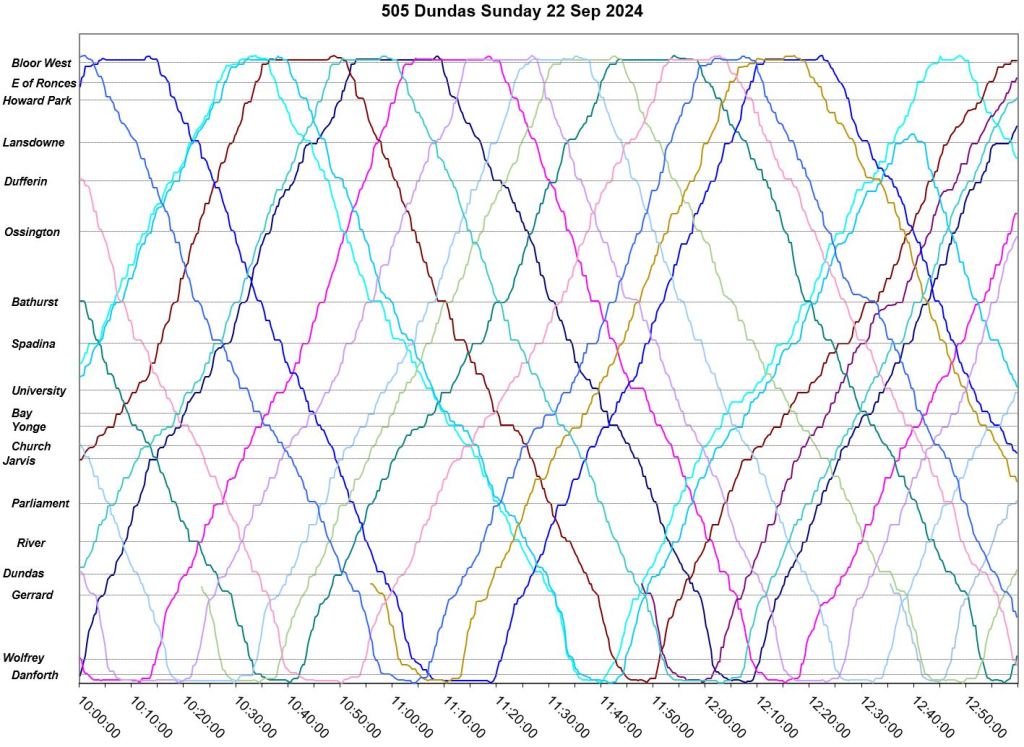


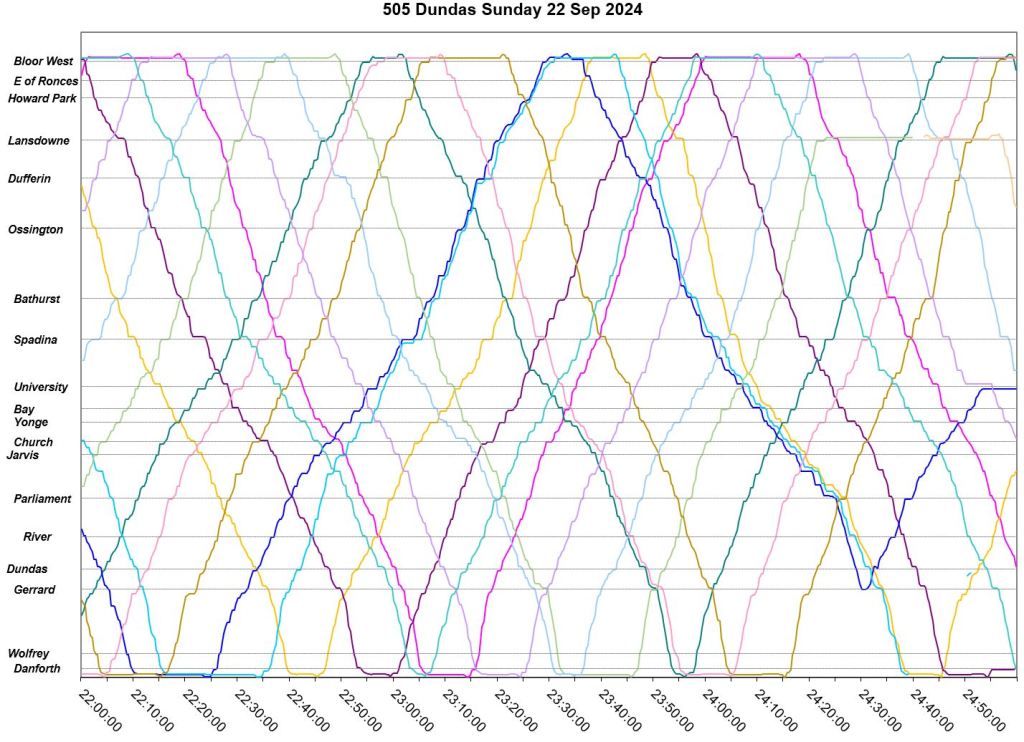
The spacing charts show clearly how service ran in packs of two or more vehicles during the daytime and early evening, particularly westbound.


Eastbound:


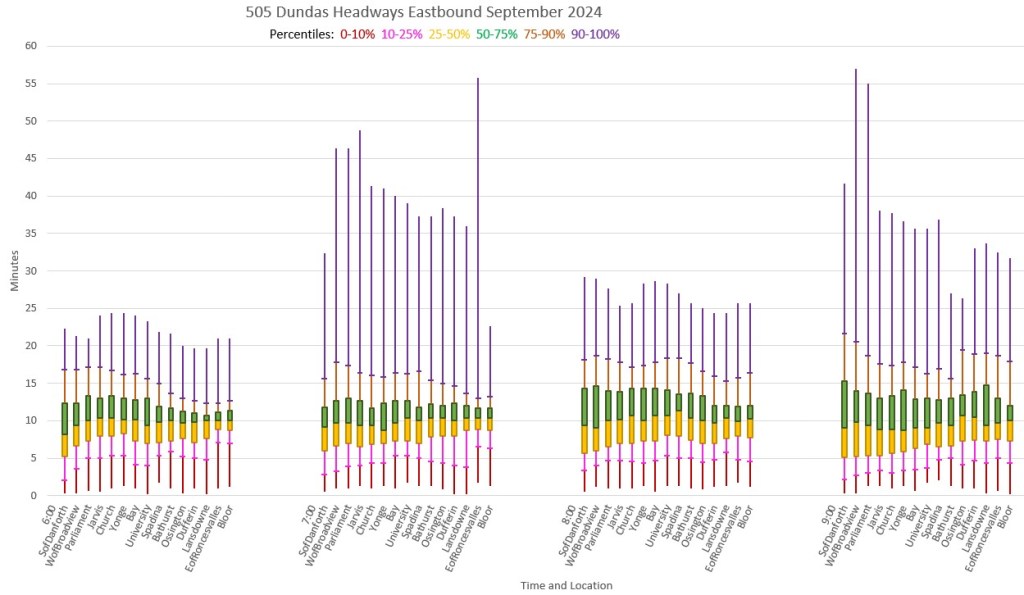
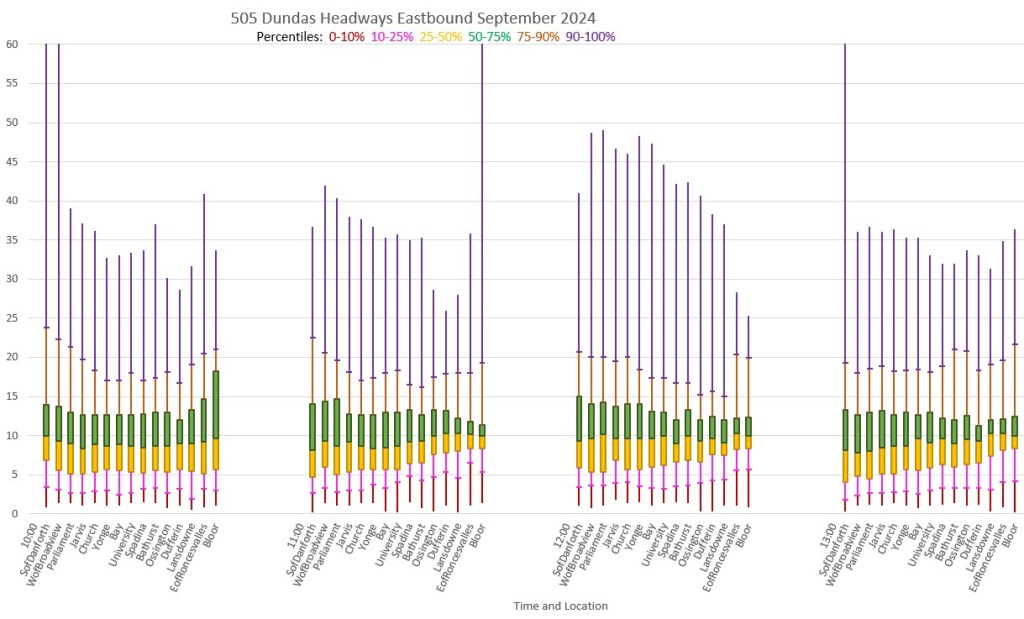
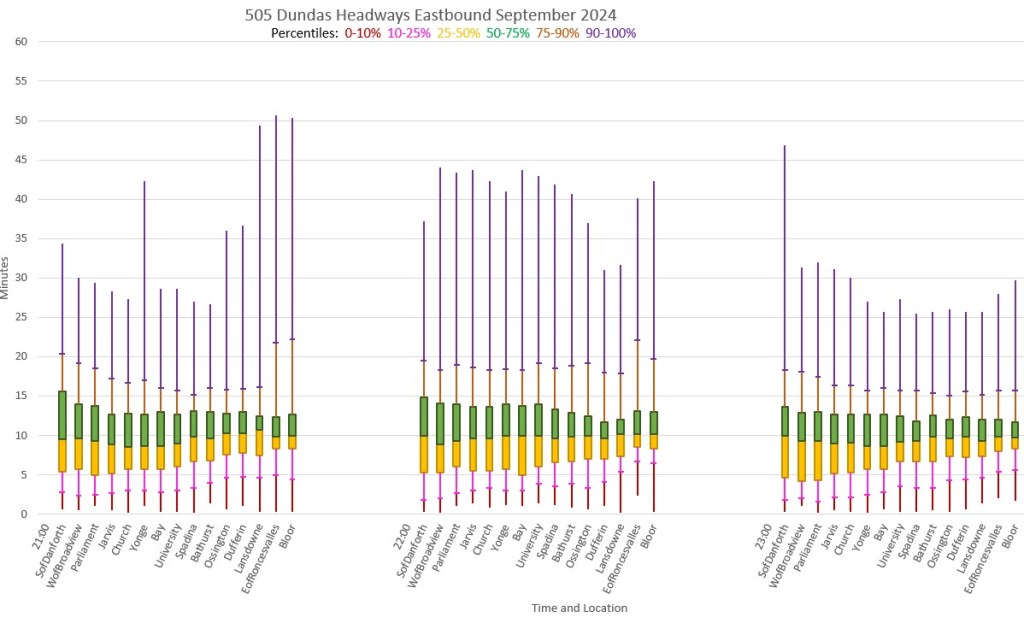
Month Headway Summaries
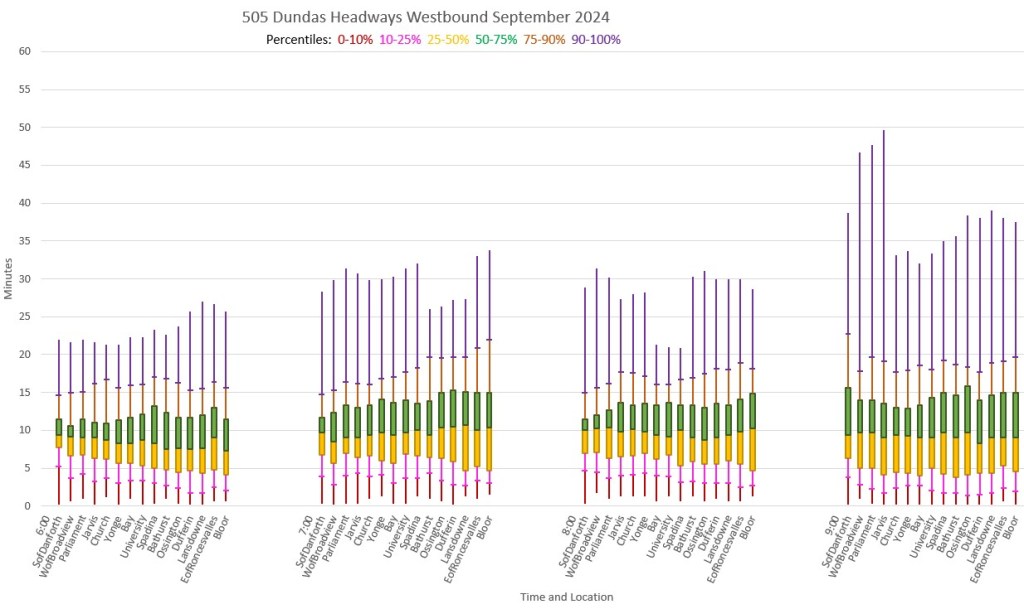
The following charts summarize statistics of the actual headways on weekdays at key stops along the route, by hour. There are six bands on the charts corresponding to percentiles of the data. From bottom to top:
- Red: 0-10th percentile.
- Pink: 10th to 25th percentile.
- Between them, these give the range of the lowest quartile of headways. One quarter of trips for the month lie within this range.
- Yellow: 25th to 50th percentile.
- Green: 50th to 75th percentile.
- Between them, these give the range of the second and third quartiles. Half of the trips for the month lie within this range.
- Taupe: 75th to 90th percentile.
- Mauve: 90th to 100th percentile.
- These cover the fourth quartile, and one quarter of all trips lie in this range.
In effect, these charts show what the probability was during September of encountering waits of various lengths at carstops along the route. Half of the service lies in the middle band, and to half of the time a rider will encounter this spacing between cars. However, the other half of the time the spacing is outside that central range.
Note that the span of the middle group gets wider as one goes along the route (left to right for westbound charts, right to left for eastbound). This illustrates the inherent limitation of reporting “on time” stats only for terminals because that is not where most riders actually encounter the service. Also, the height of the upper quartile usually rises along the route as wide gaps get wider. (This can also be affected by short turns where outer ends of a route get less service.)
A separate calculation, a subject for a separate article, is the difference between wait times for scheduled versus actual service. The wider the gap, the more riders will be waiting at a stop and the average wait time goes up. Conversely, cars running close together accumulate few waiting riders, and only they benefit from a short than scheduled wait.
Westbound


Eastbound


Travel Time Between University and Spadina Avenues
In anticipation of increased congestion on Dundas during TTC’s planned work on Spadina, Council implemented parking restrictions on Dundas between McCaul and Spadina. These went into effect in late July. The charts below show the median and 85th percentiles of travel times between University and Spadina in each direction during the AM peak, midday, PM peak and mid-evening on weekdays from January to September 2024.
Although these values have their peaks and valleys, there was little change in travel times from late July onward during some periods. The effect was primarily westbound and in the PM peak period. Although there is a spike in late April and early May, this settles down well before the parking change took effect, and was likely due to a construction blockage somewhere in the area.
As on King Street, an important benefit appears to be the reduction in variability of travel times, as opposed to an absolute reduction from “before” conditions early in the year. The restrictions are to be removed in January 2025, and I will update these charts once there is “after” data for comparison.
Note that the bounds for my measurements extend slightly east of the area where parking regs were changed because University Avenue, not McCaul, is a screenline in my standard model of the Dundas car. This could be changed, but I doubt there would be any effect on the overall shape of the data.


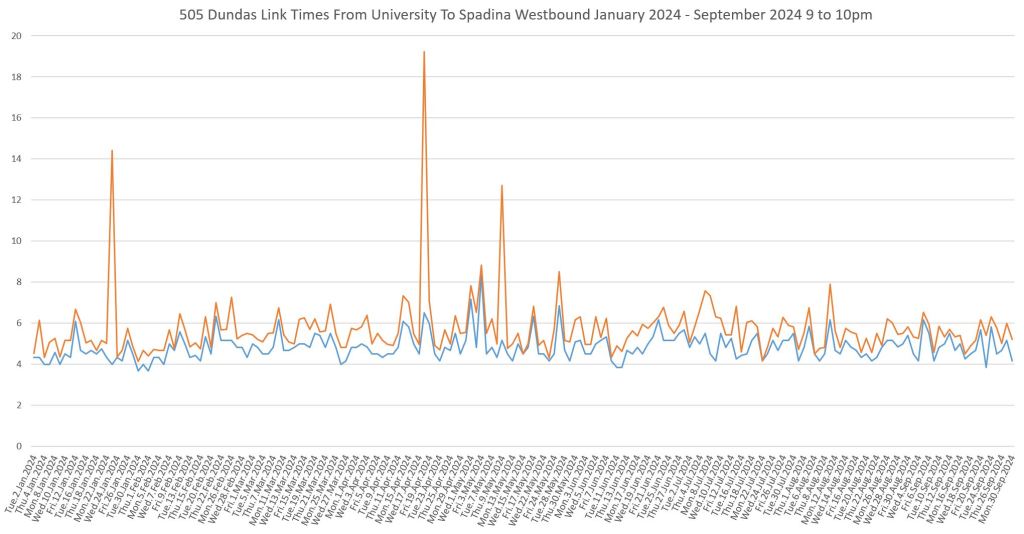

Chart Sets
- Monday, Sept. 16
- Tuesday, Sept. 17
- Wednesday, Sept. 18
- Thursday, Sept. 19
- Friday, Sept. 20
- Saturday, Sept. 21
- Sunday, Sept. 22
- Month Headway Stats
- University-Spadina Travel Times

Thanks, as always, for your work on this.
Steve: You’re welcome. This is a work in progress both to examine route behaviour and to find ways to present the information visually.
LikeLike
Excellent detail, really well presented.
Steve: Thanks!
LikeLike