
In a recent thread on X/Twitter (and no doubt other venues) there has been some controversy about the relative speed of 6 Finch LRT versus the bus service it will replace. Writers have based their arguments on speeds published in the Scheduled Service Summaries, although these are not always reliable for various reasons:
- The speeds shown are over the full route. For the 36 Finch West service west of Keele Street (Finch West Station), this includes the portion south of Humber College to Humberwood Loop.
- Actual speeds vary from the scheduled ones, and there is a fair amount of scatter around these averages. An important factor in any reserved lane implementation, regardless of technology, is the hope that, as on King Street originally, better reliability can be brought to travel times and hence to service quality.
The purpose of this article is to review actual travel time data on weekdays for selected months between 2017 and 2023. The specific months were chosen both for variety, but also within the limitations of data that I have been collecting for several years. 36 Finch West fell off my radar, so to speak, in 2022 and I was not tracking it, but began again in 2023 in anticipation of the LRT opening to get some “before” data.
The data are shown in two formats.
- Weekly average travel times by hour together with the standard deviations in data values, a measure of the scatter in the data.
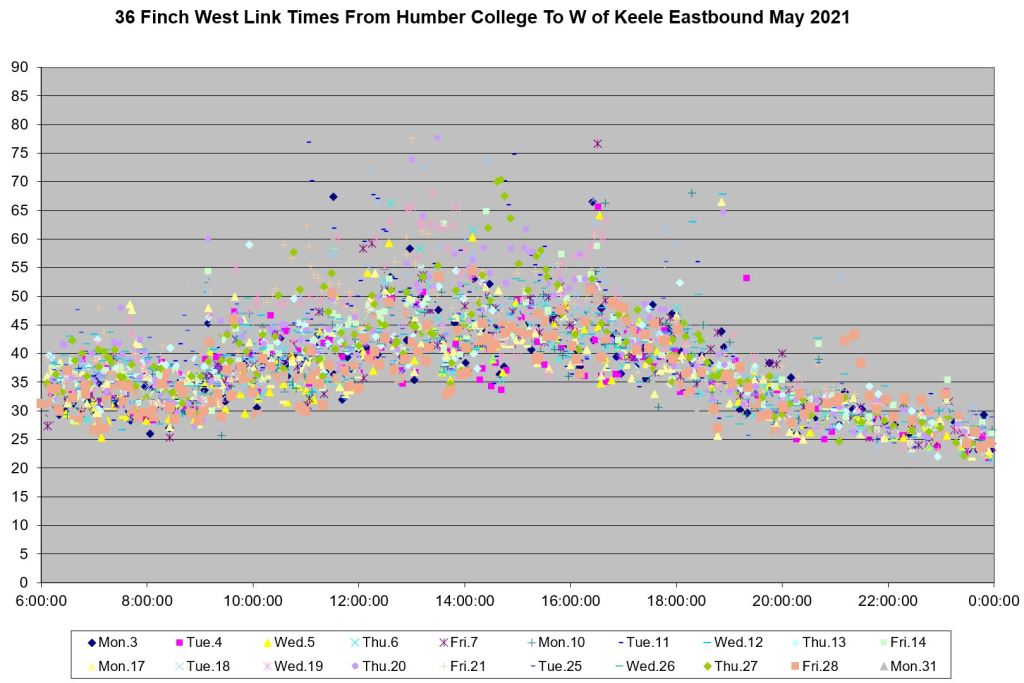
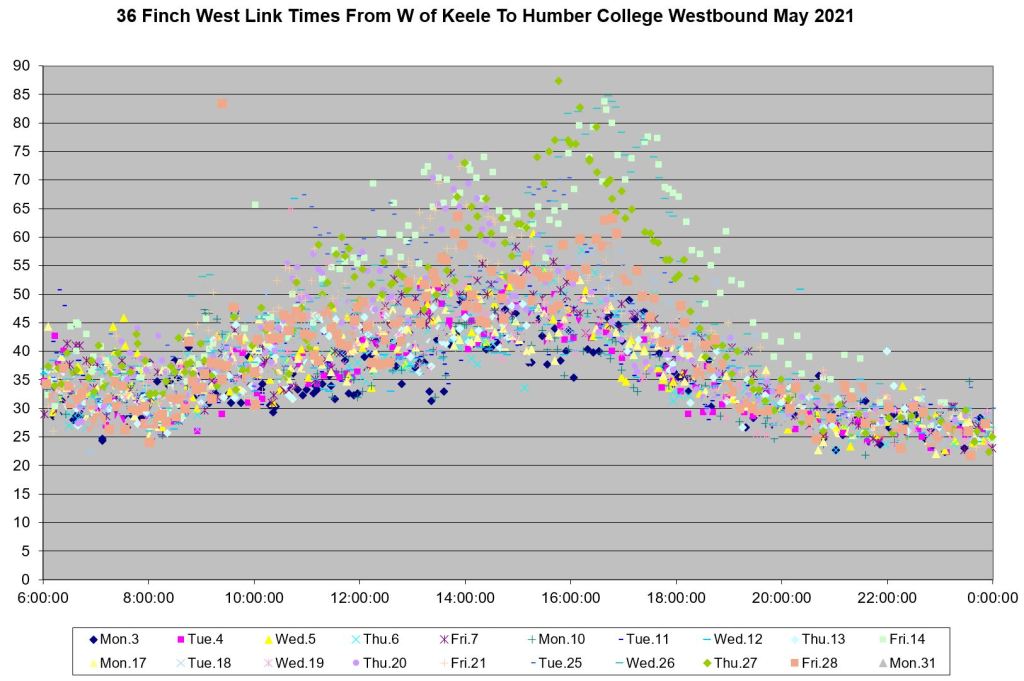
- The raw data points to give readers a sense of the range of travel times that can occur on a day-by-day, hour-by-hour basis.
The challenge for the LRT line is to both reduce the averages times, and to narrow the band in which these times lie.
The section measured is from west of Keele Street to Humber College. This is chosen to ensure consistent data for departures from Finch West Station in the post-TYSSE era, and coincides roughly with the LRT portal from Finch West Station. This also eliminates station time which can vary considerably, especially for the bus service, due to the station’s location.
Data for October 2017 and April 2018 precede the opening of the TYSSE and the start of construction on Line 6, and they are included as a stating point against which any improvement might be compared.
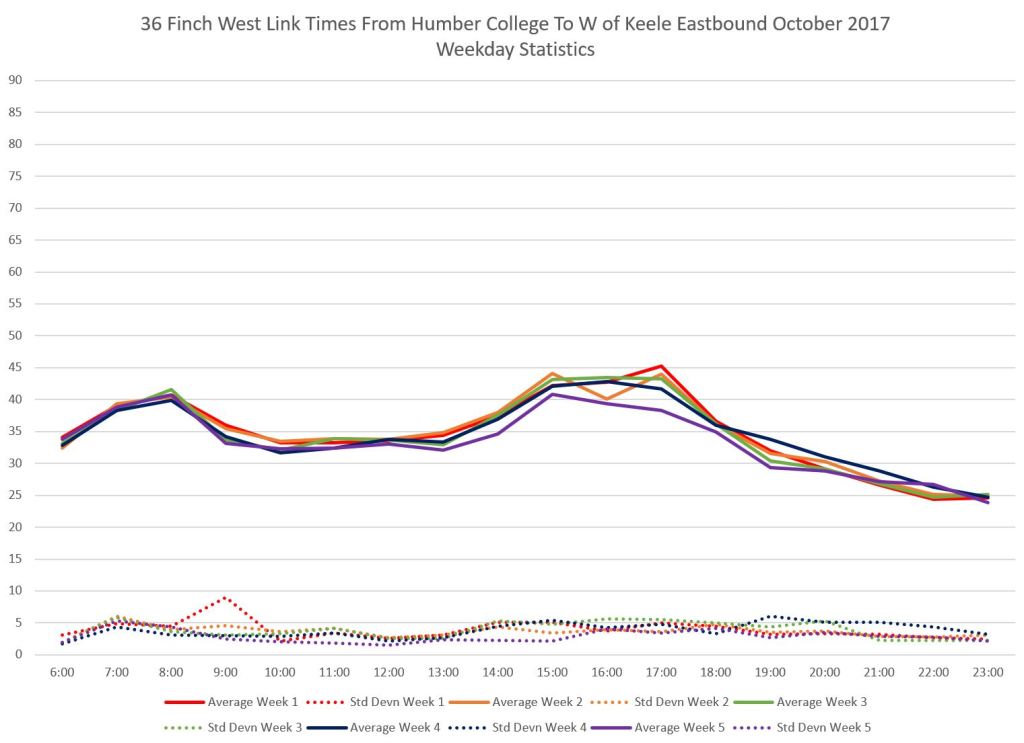
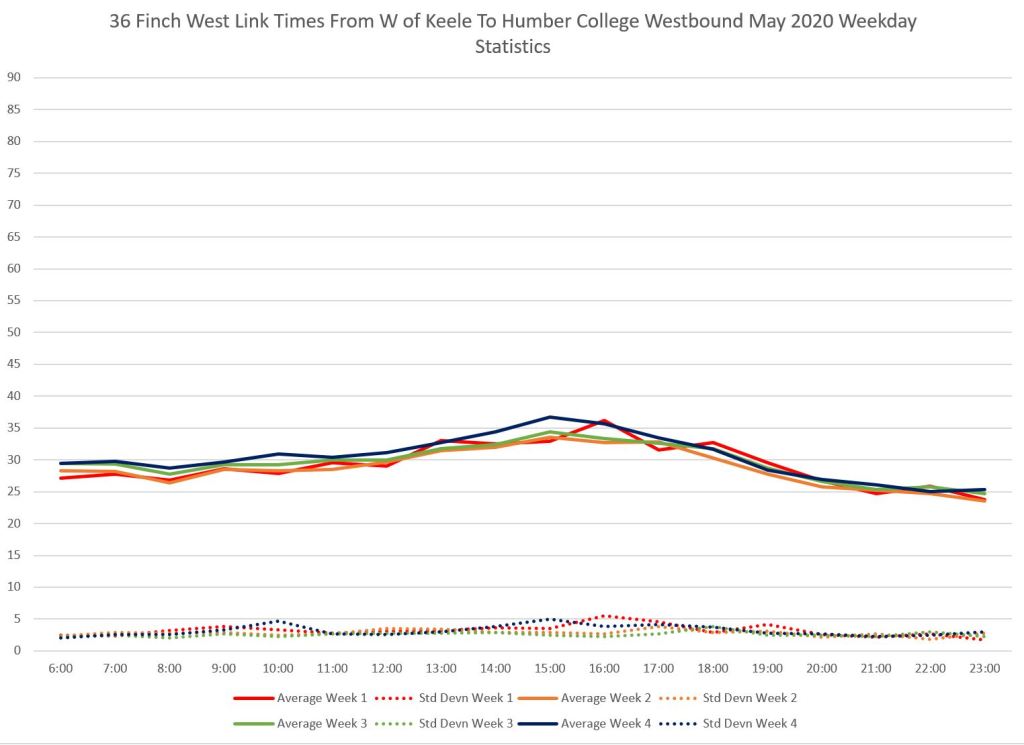
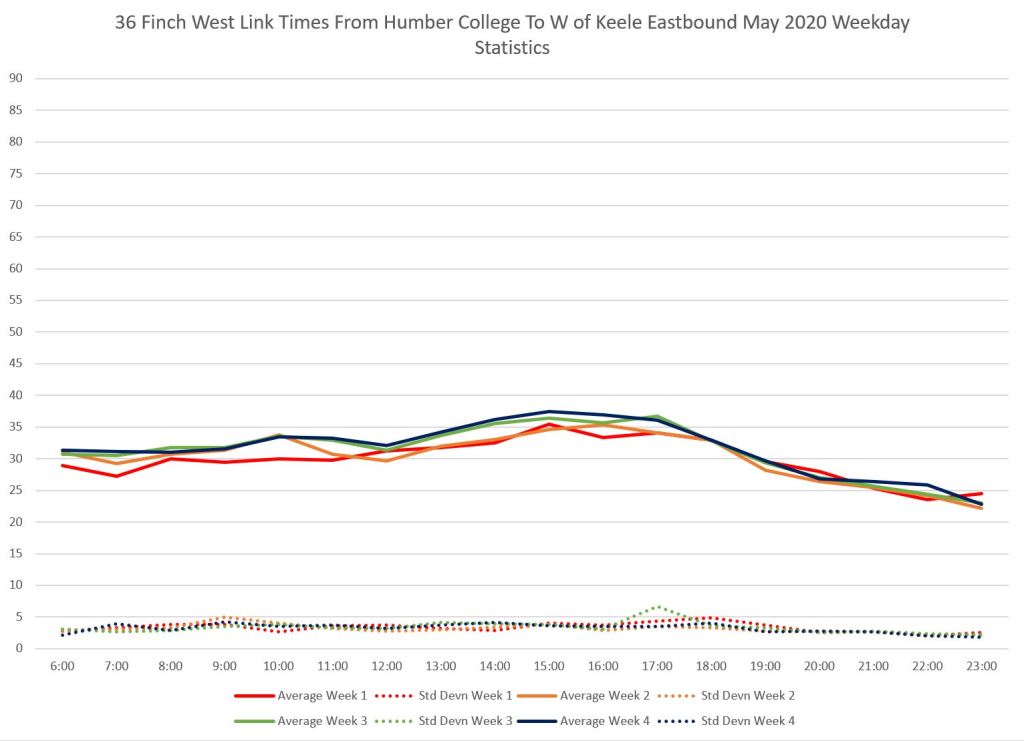
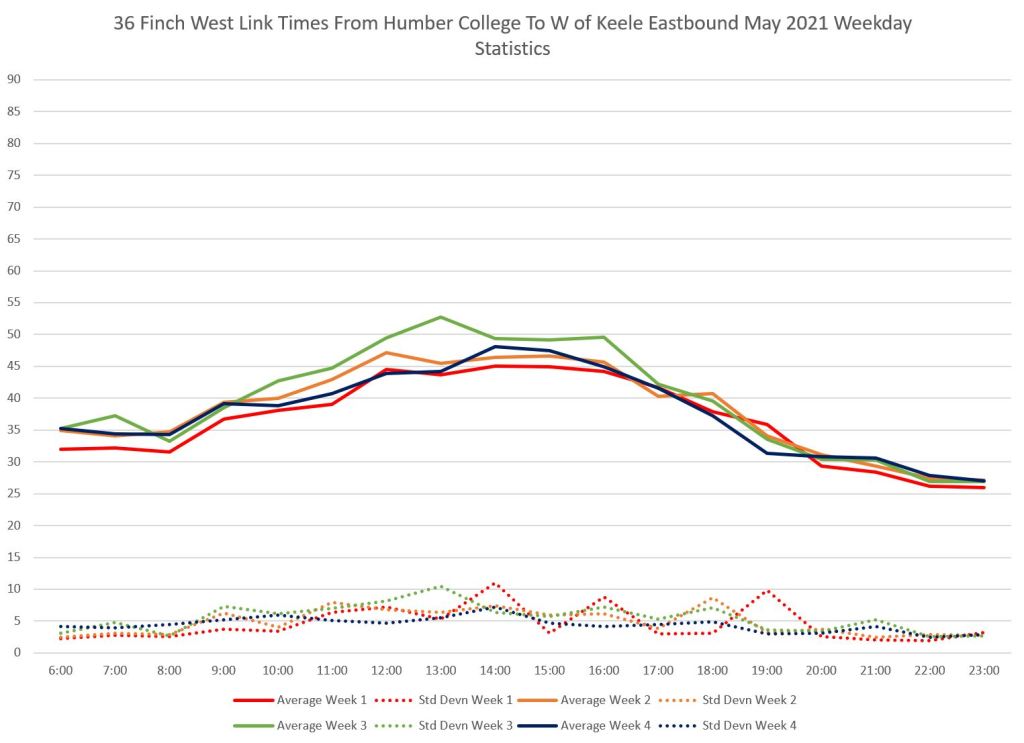
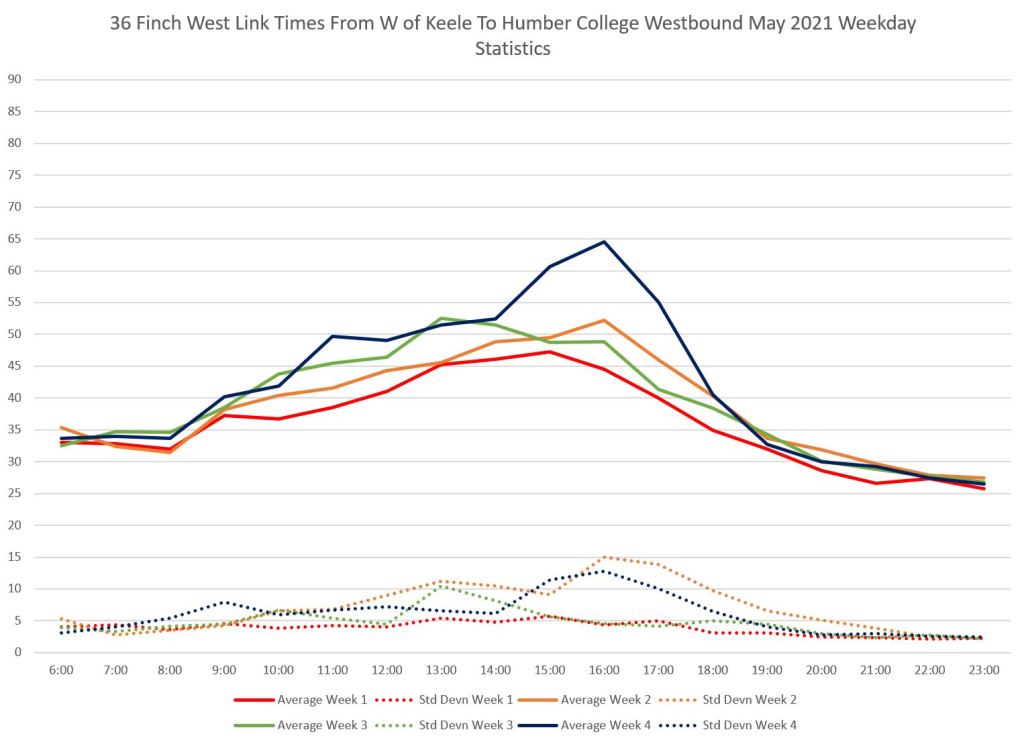
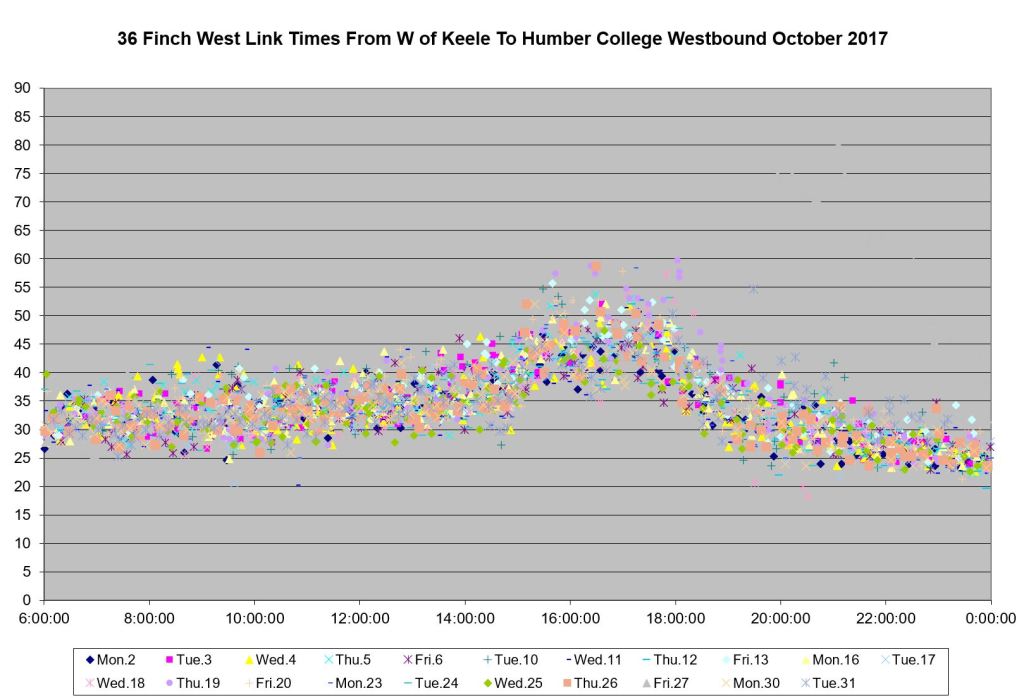
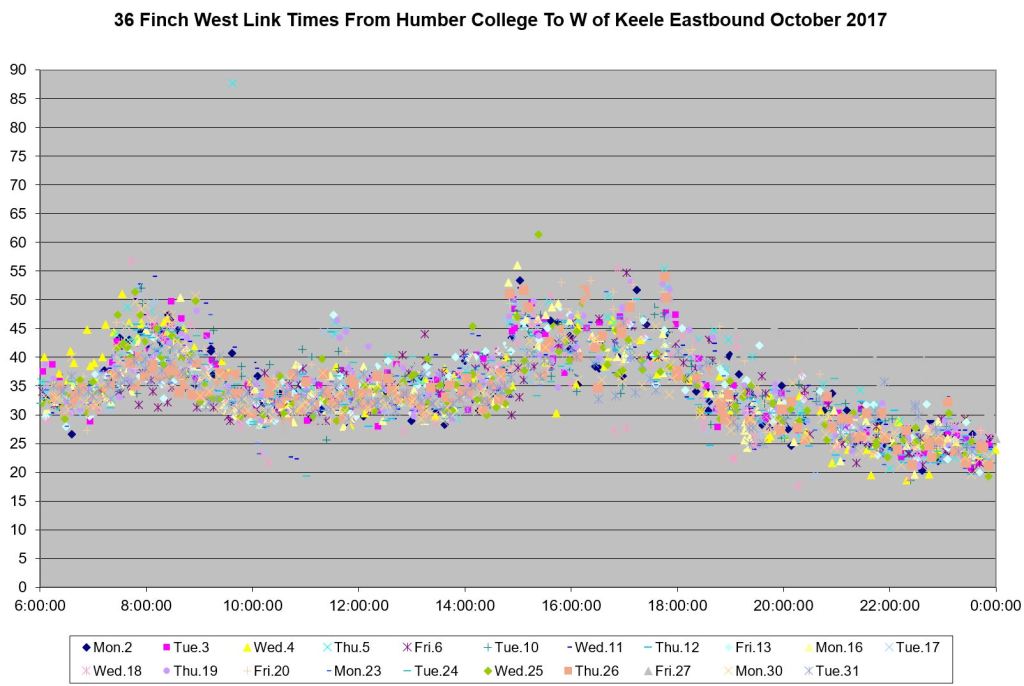
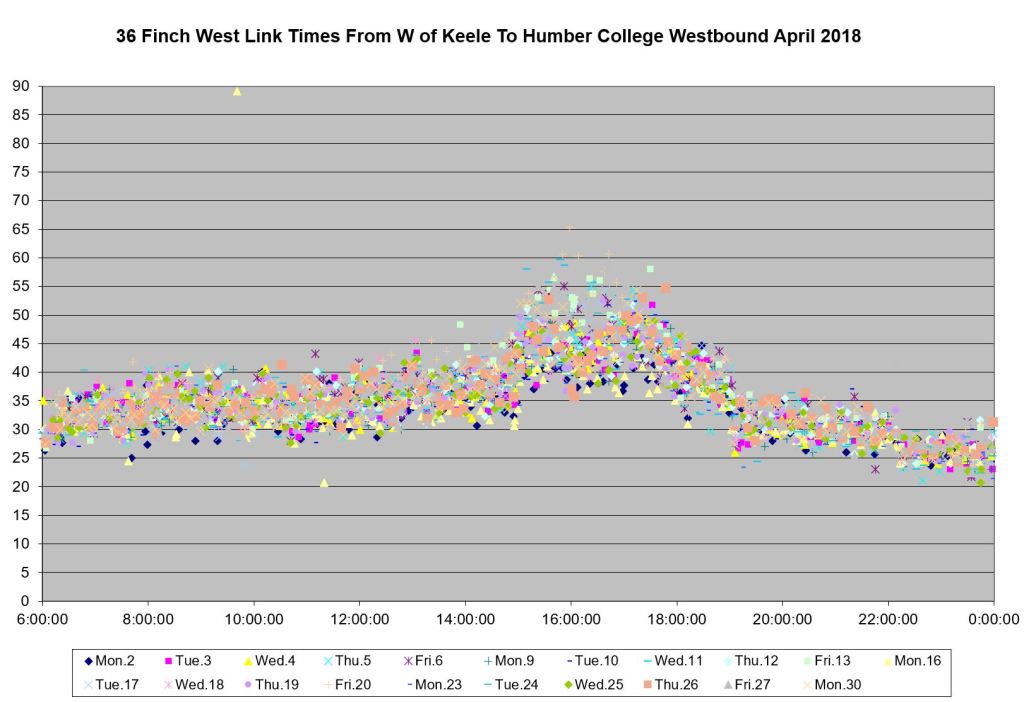
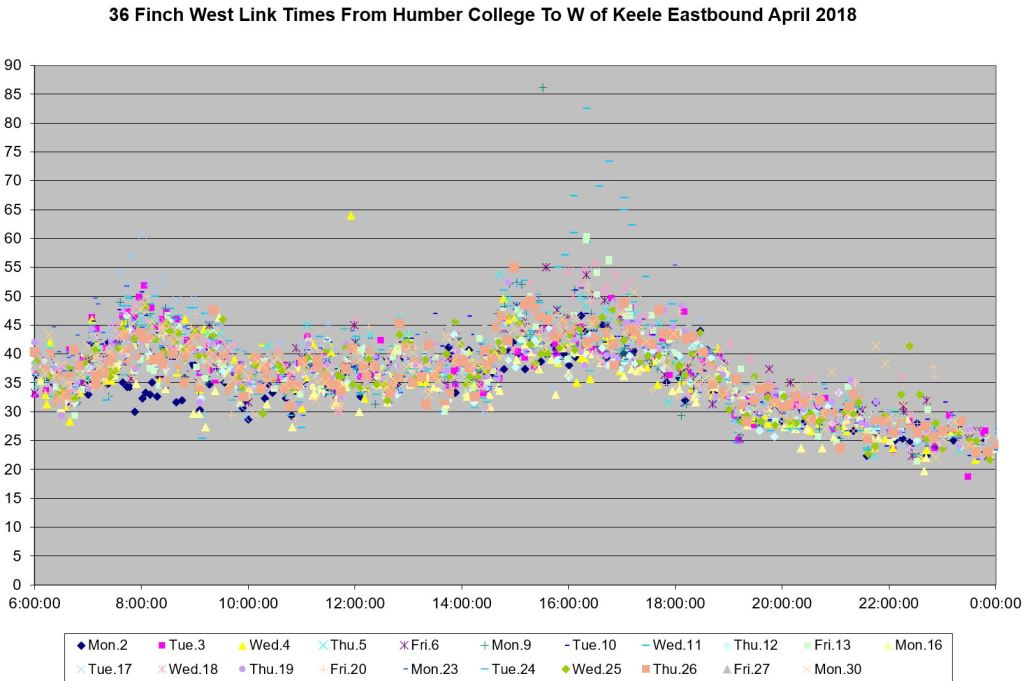
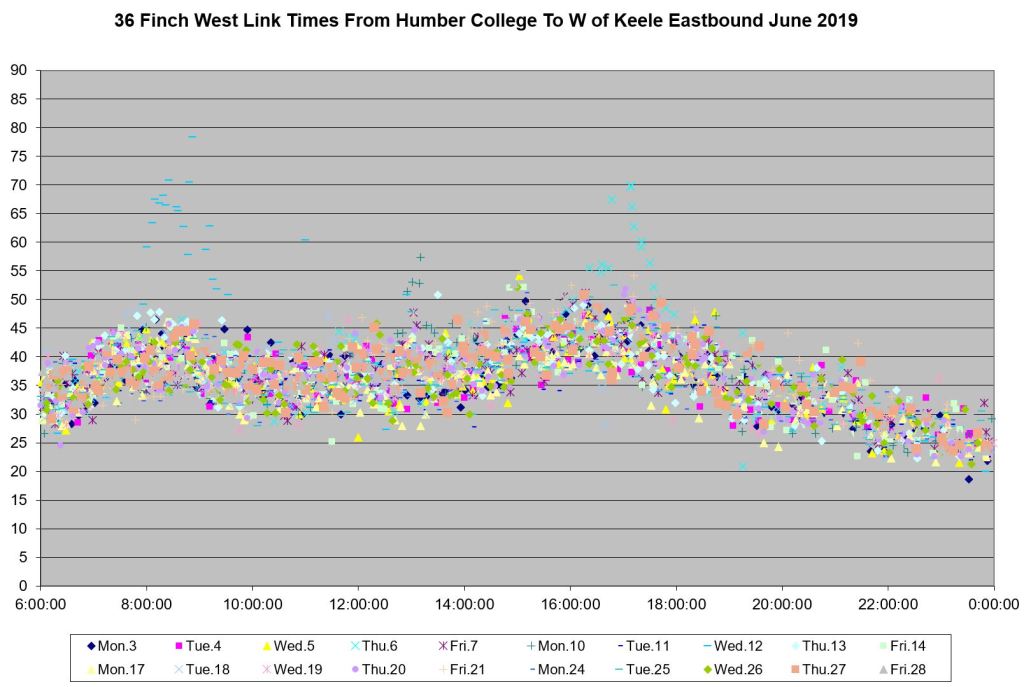
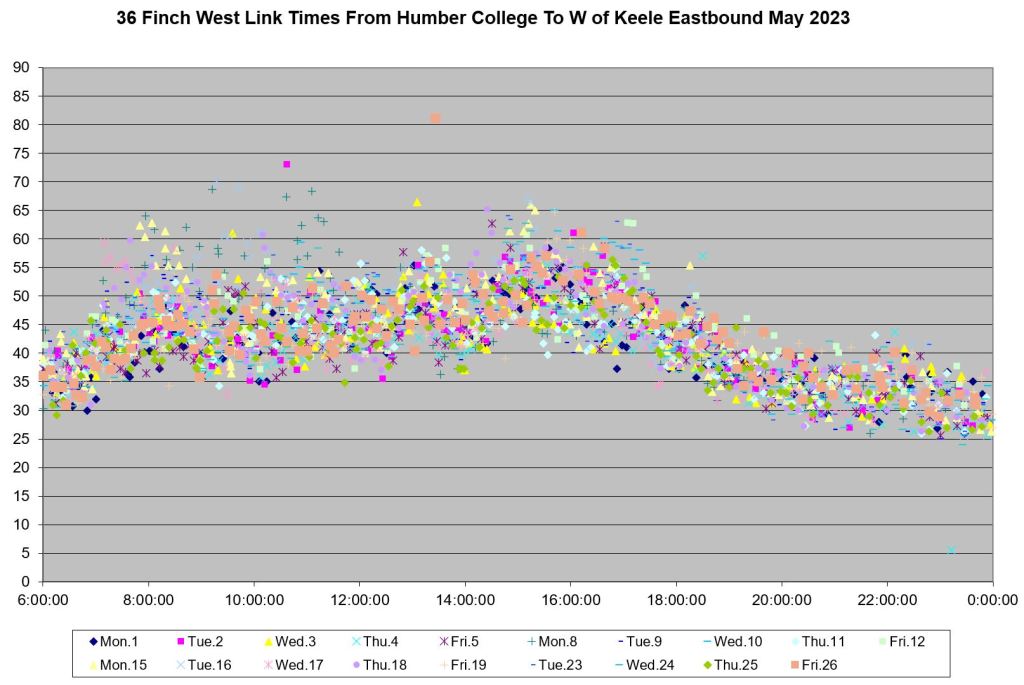
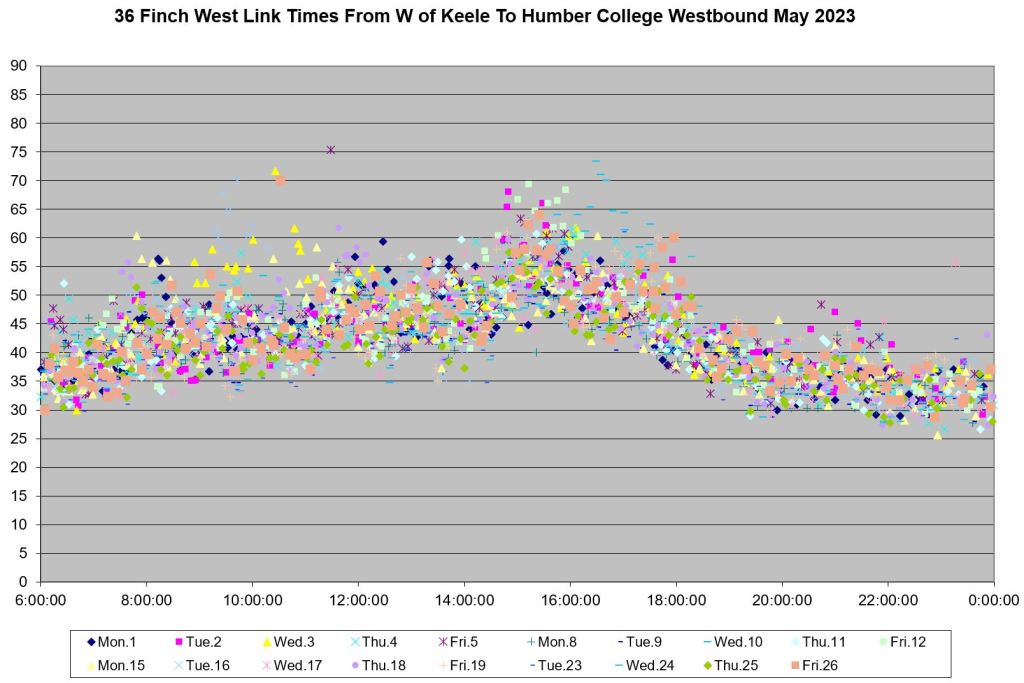
Westbound and eastbound data are shown side by side, and the charts move forward in time from top (2017) to bottom (2023)
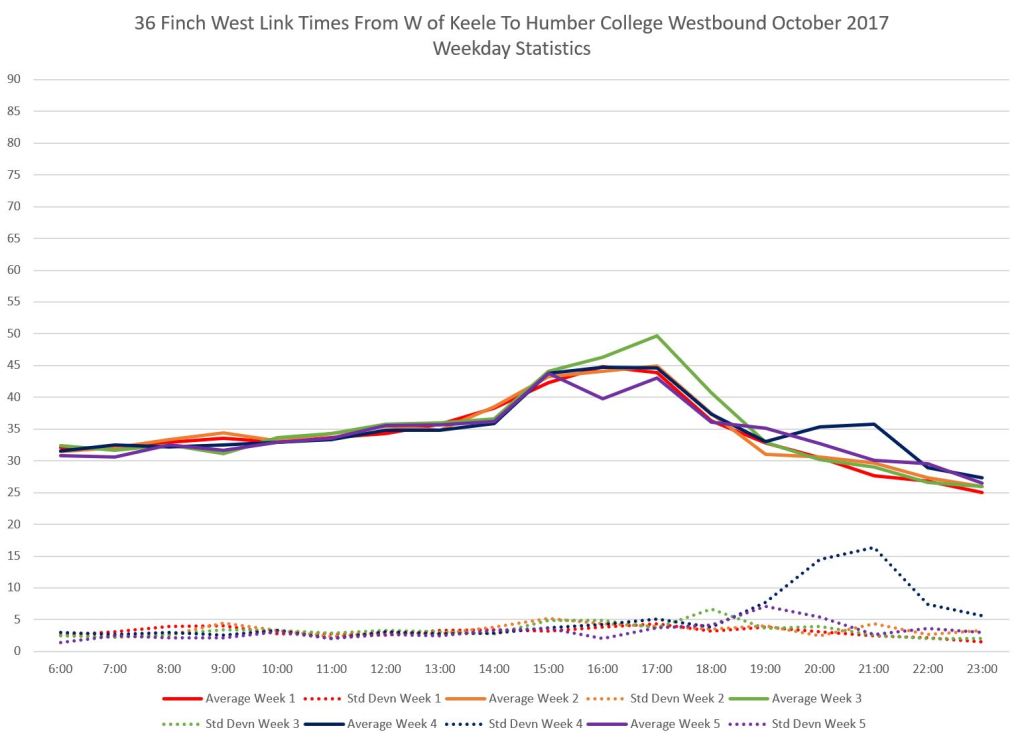
Average Travel Times
Items of note in these charts:
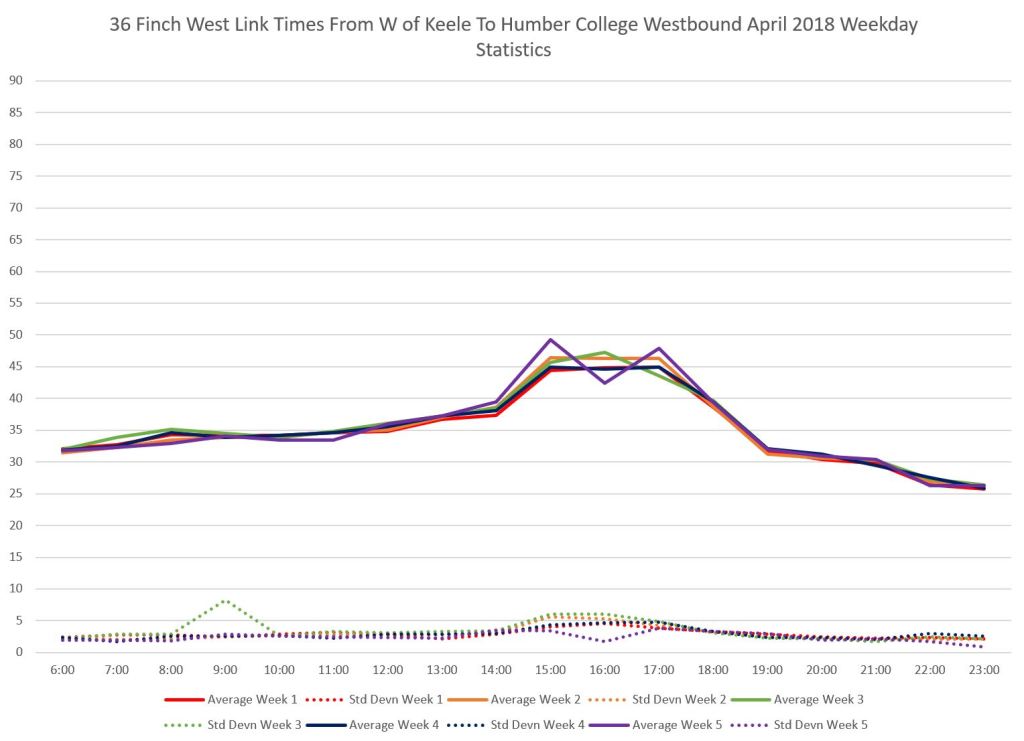
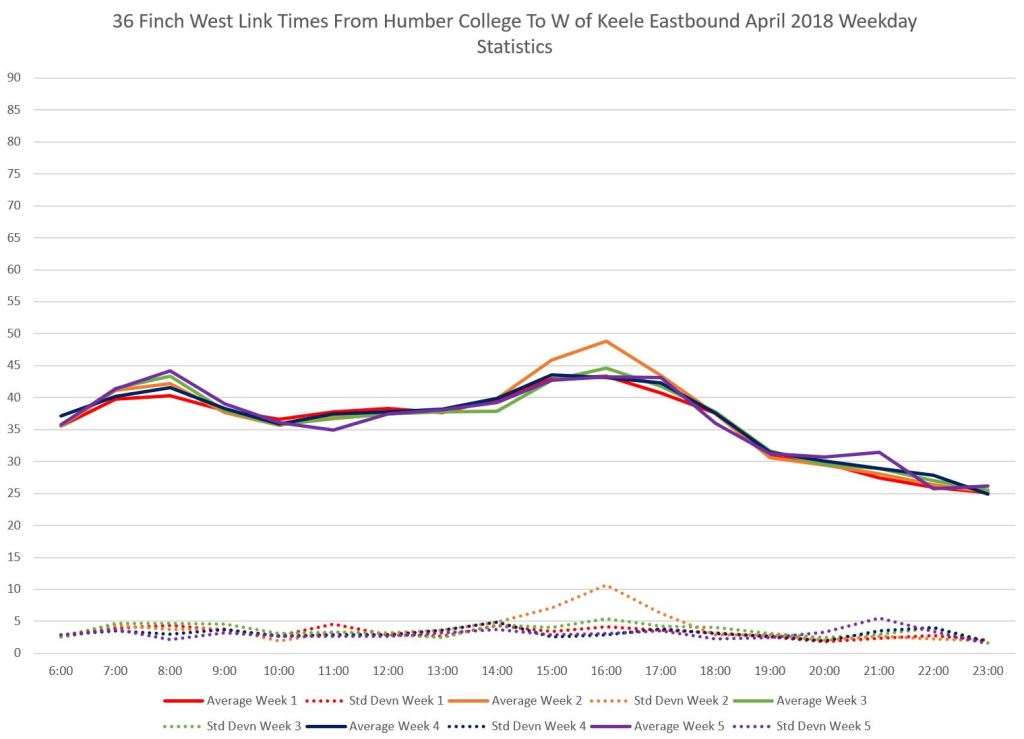
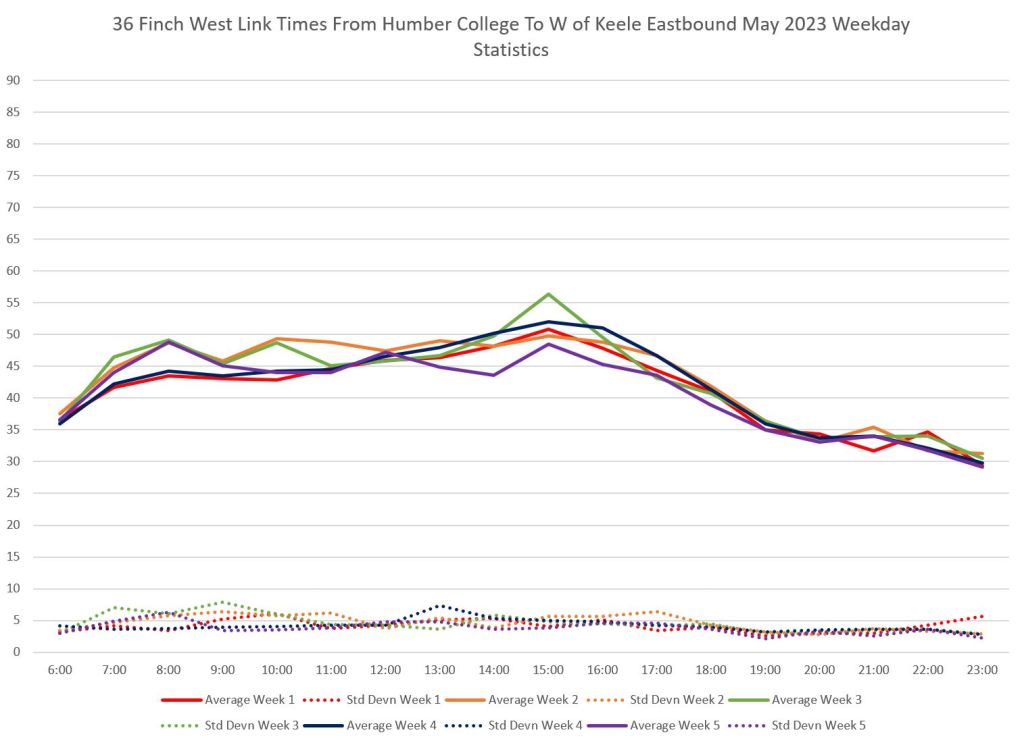
- The October 2017 travel times during PM peak periods lie in the 40-45 minute range. The standard deviations are 4-5 minutes indicating that a substantial number of trips lie in a band 8-10 minutes wide around the average. Note that the PM peak shows the highest travel time, and this peak lasts for three hours.
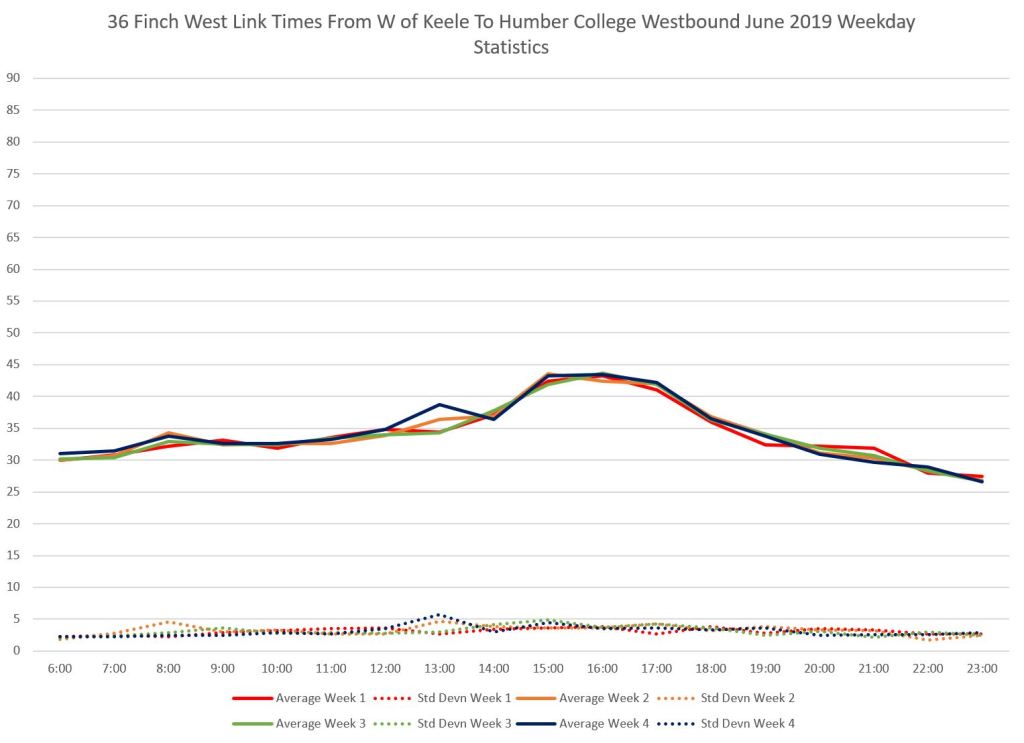
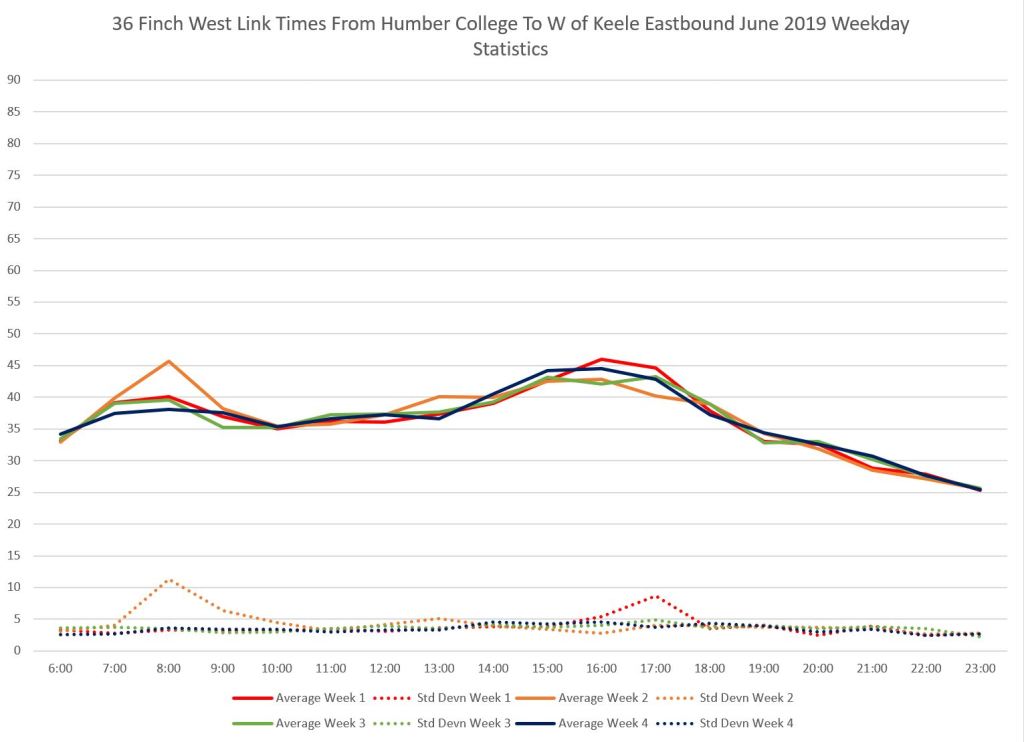
- The values for April 2018 and June 2019 are similar to October 2017. Note that the TYSSE opened in late 2018, and so the route’s service design changed with separate services originating and terminating at Finch West Station.
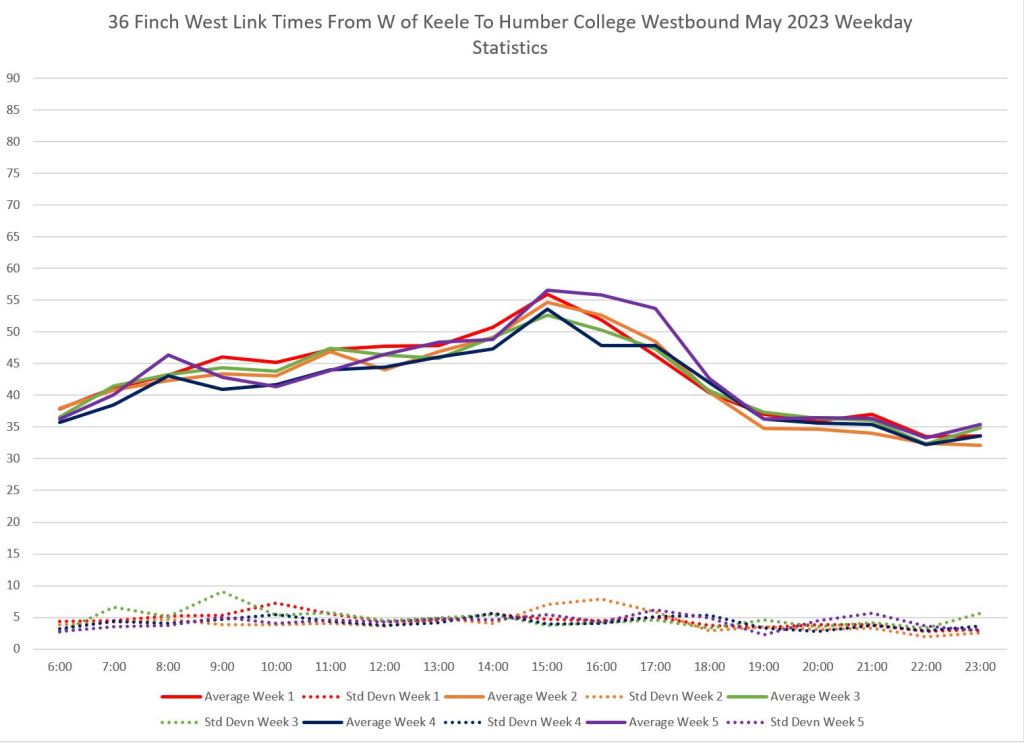
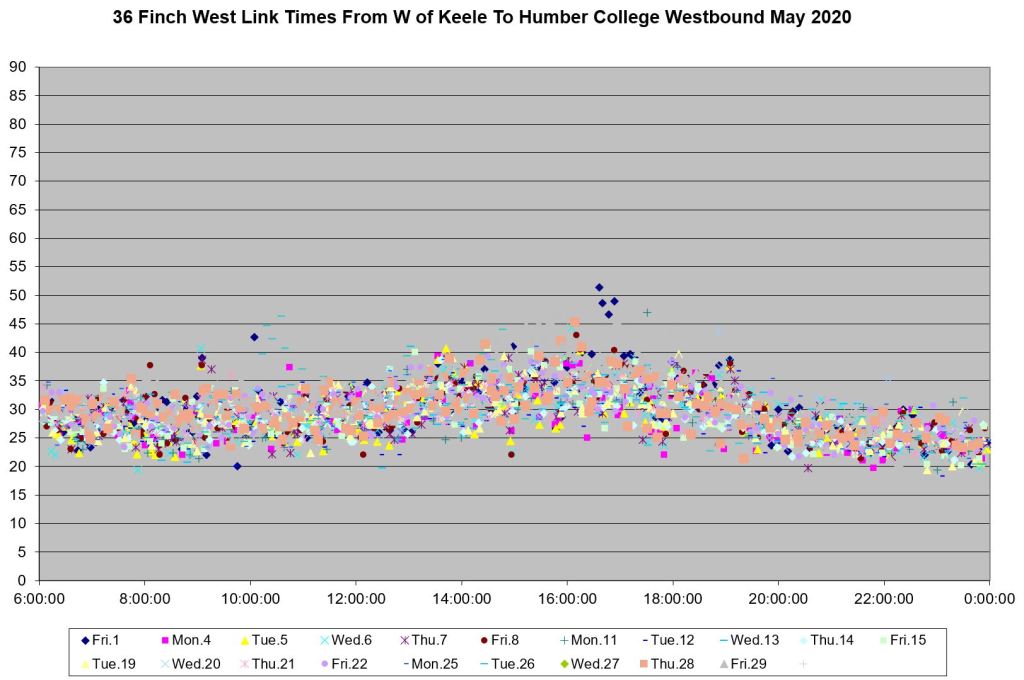
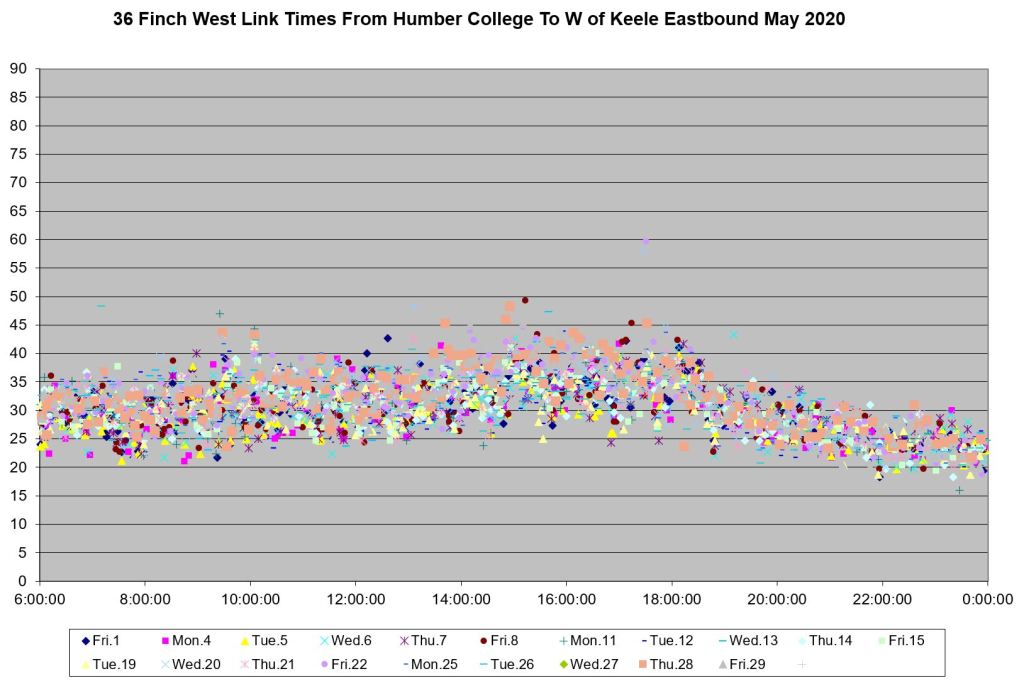
- May 2020 shows the effect of the COVID reduction in ridership and traffic on the travel times with the averages falling to 35 minutes or less.
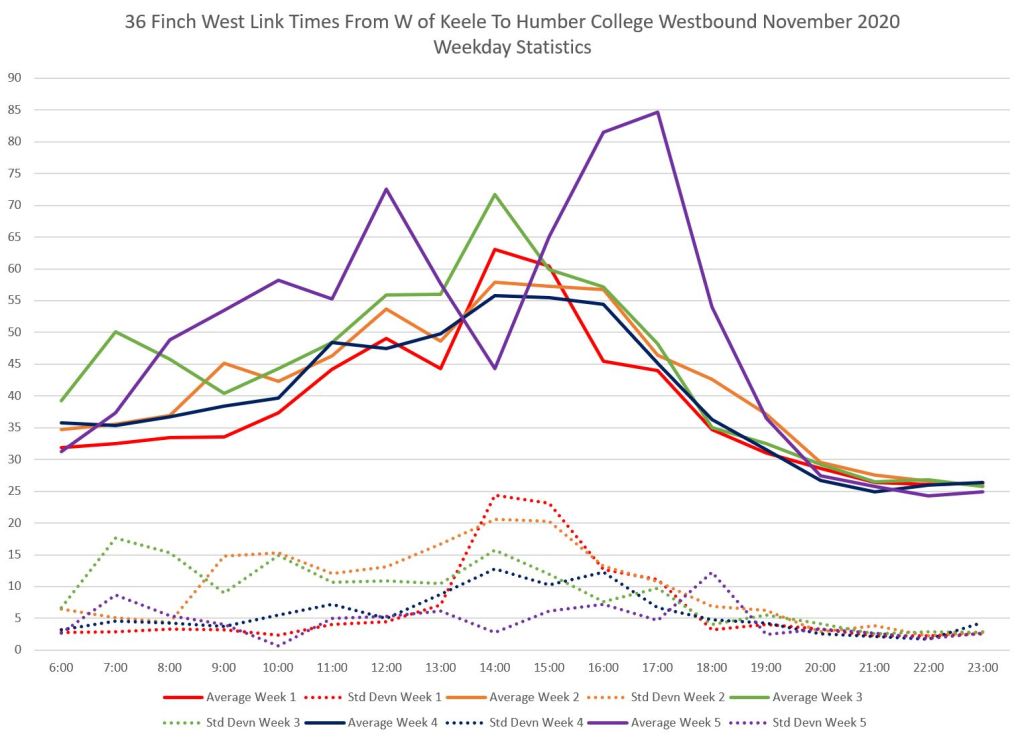
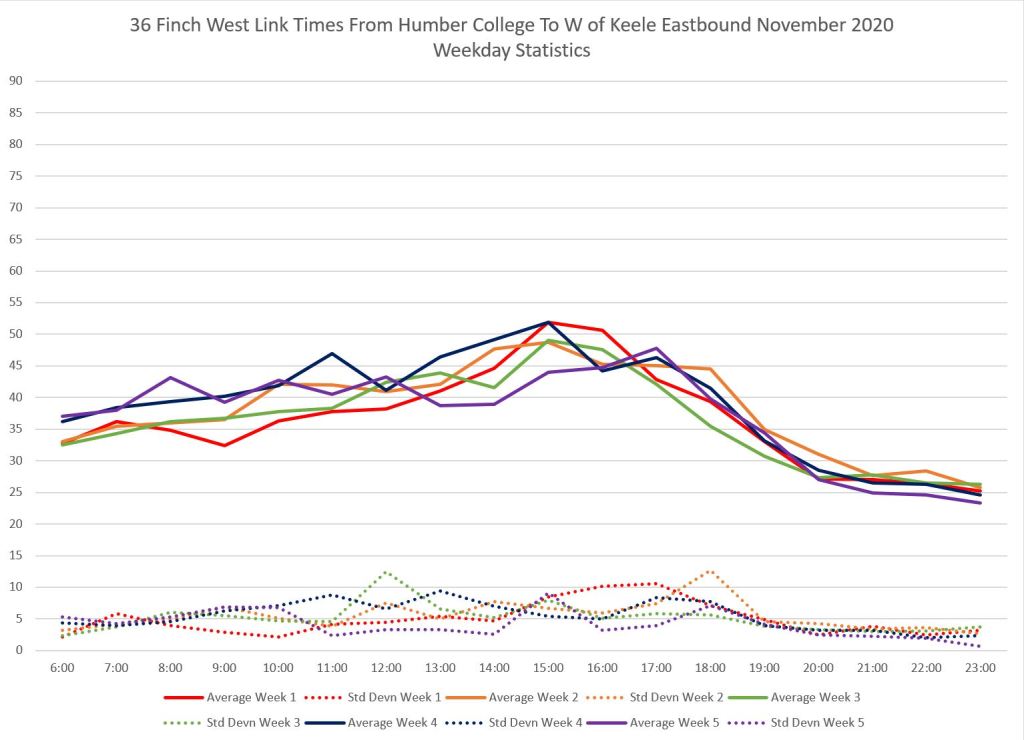
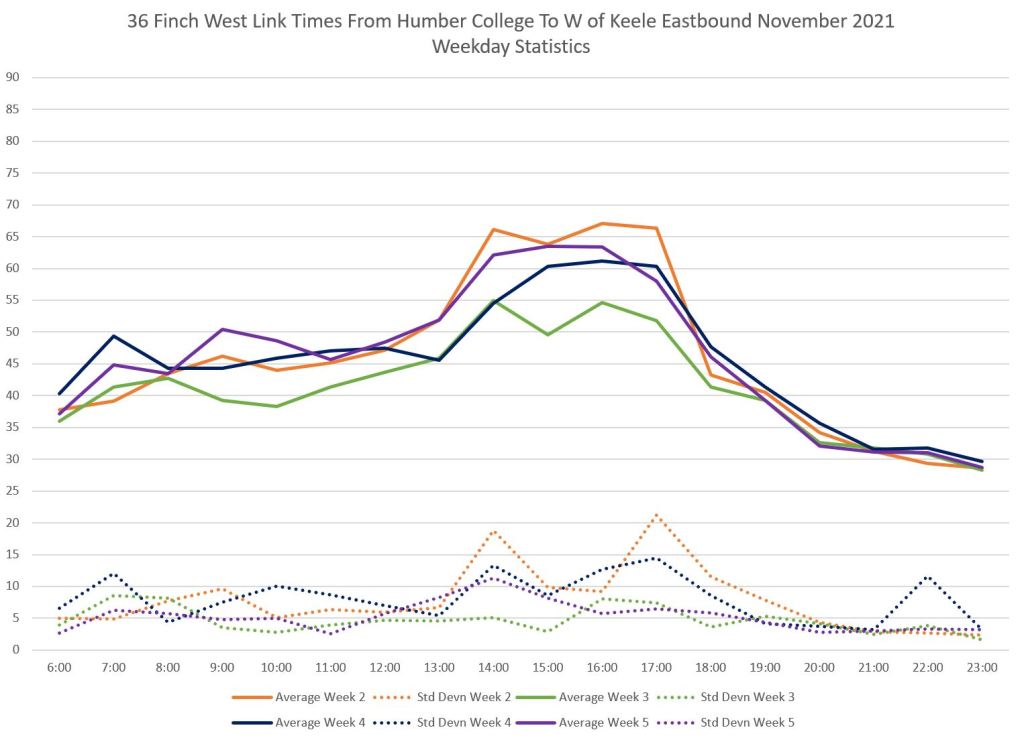
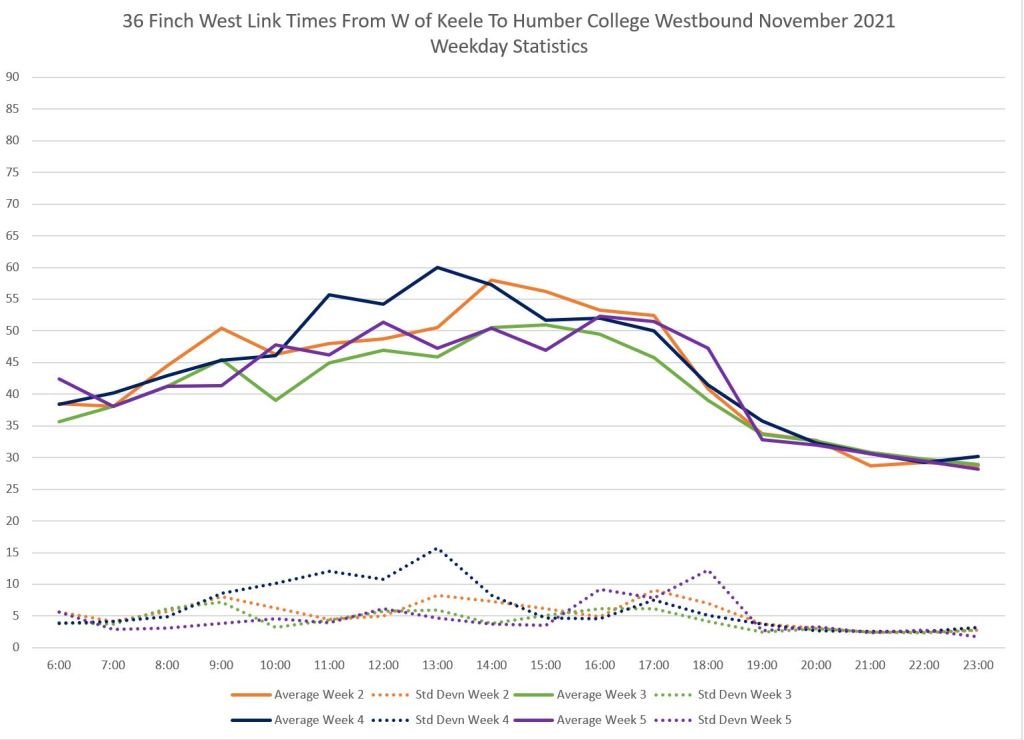
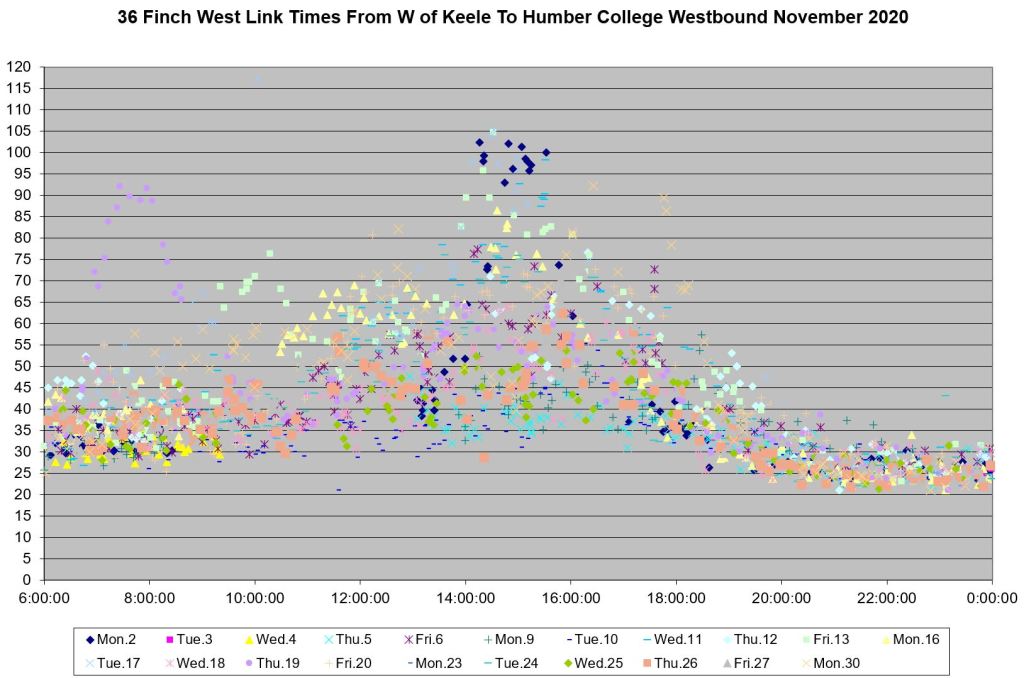
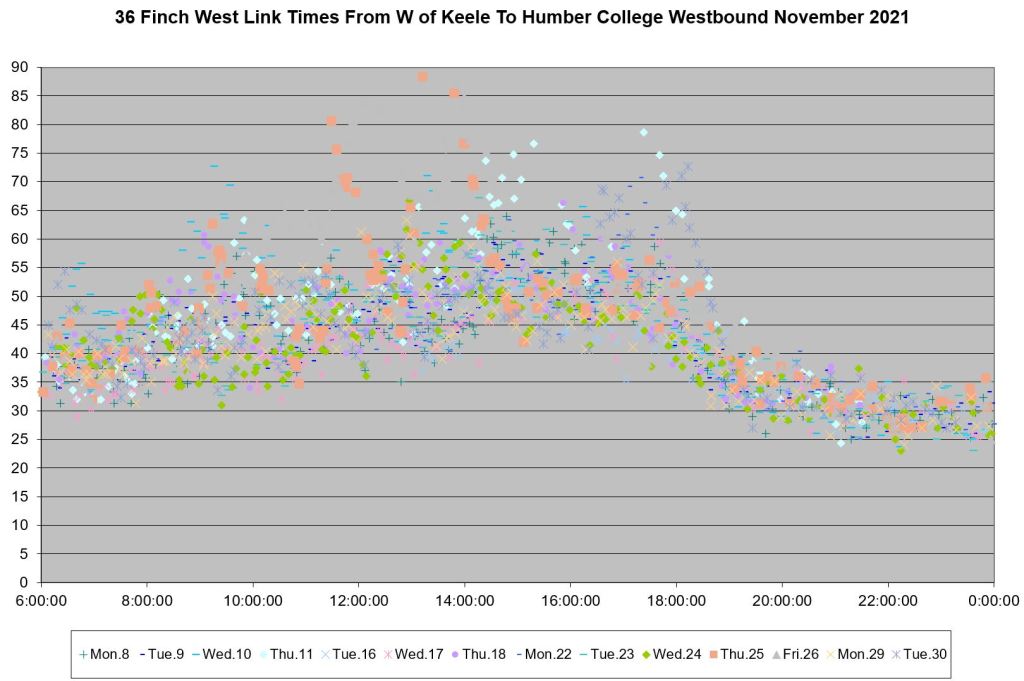
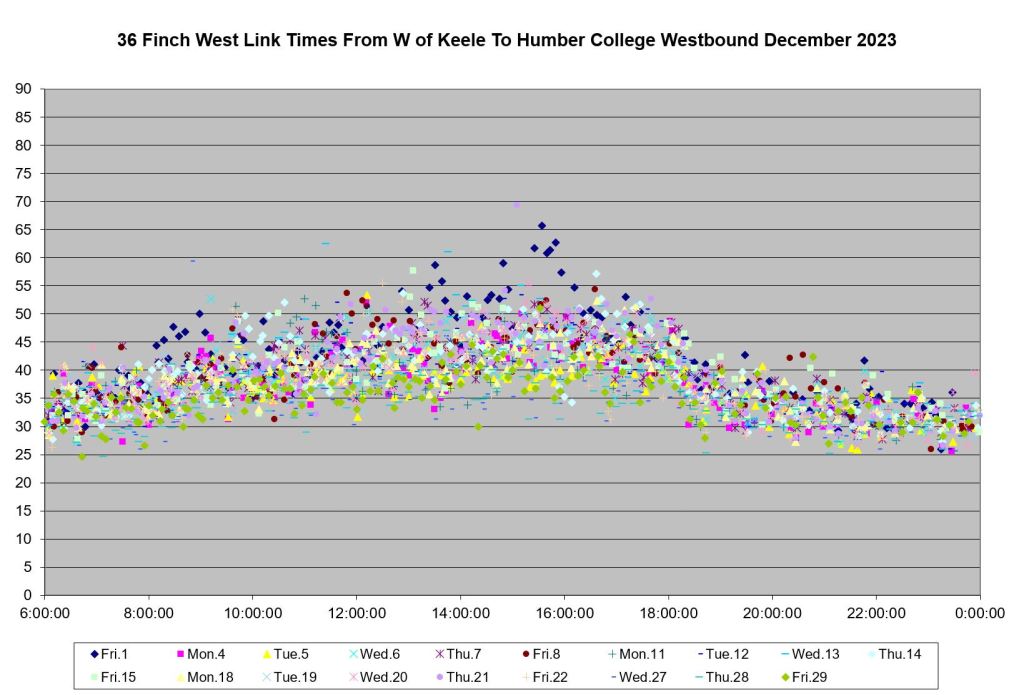
- By November 2020, pandemic effects remained in the city, but construction of Line 6 Finch shows its impact on bus travel times in the corridor, especially westbound. This continues in varying degrees through to 2023.
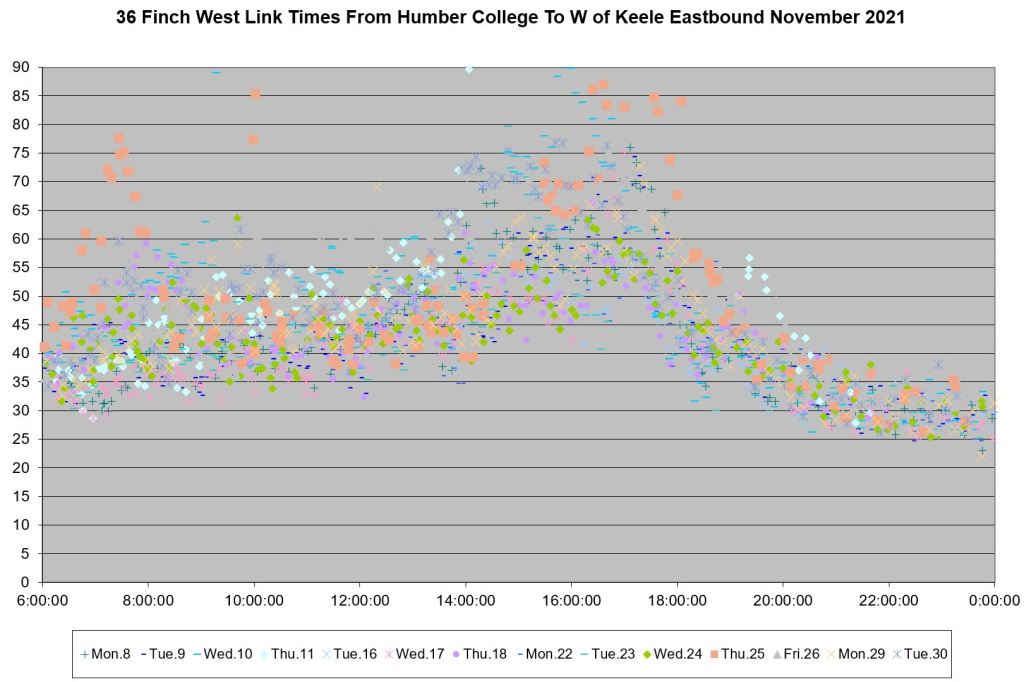
- There are no data for Week 1 in November 2021 due to the cyber attack that disabled TTC systems.
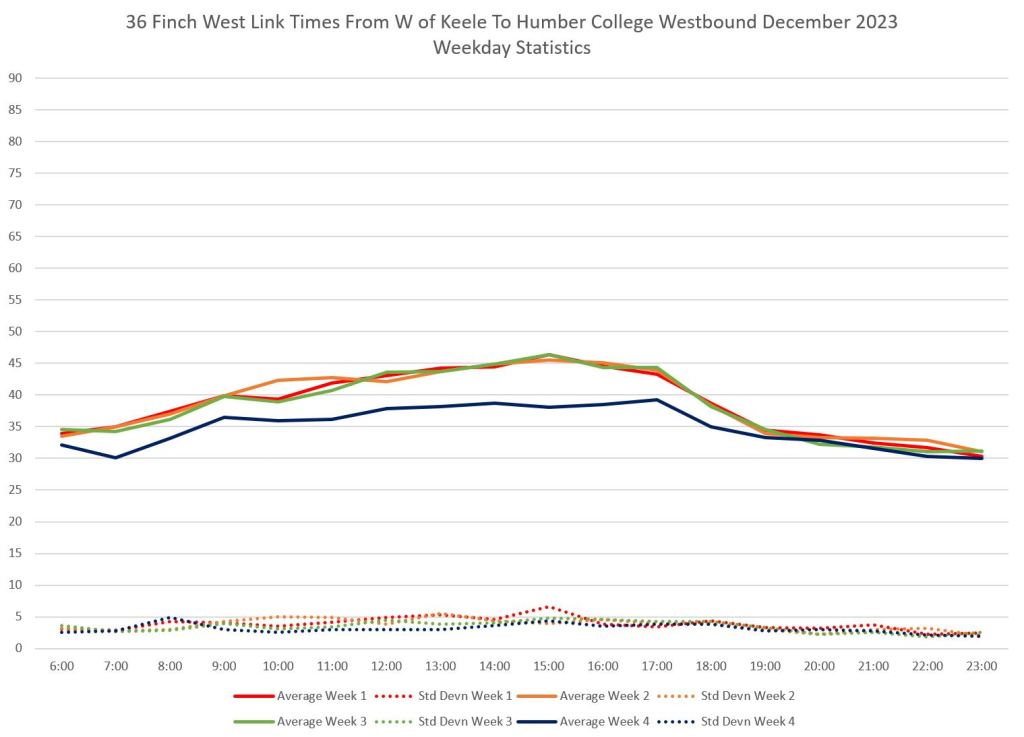
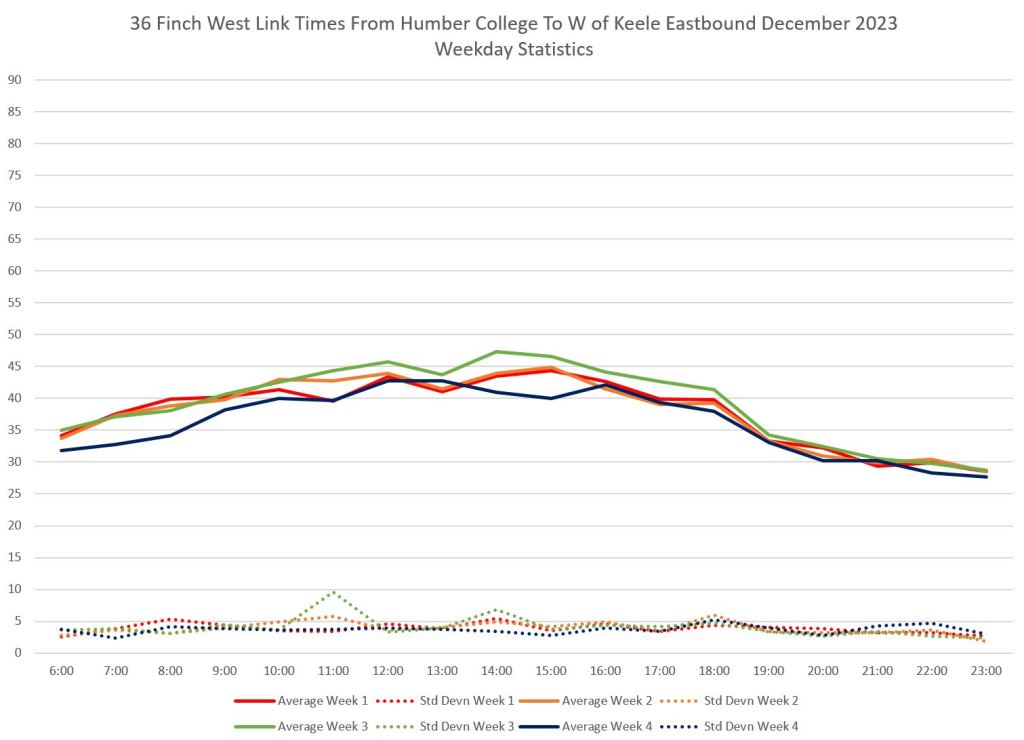
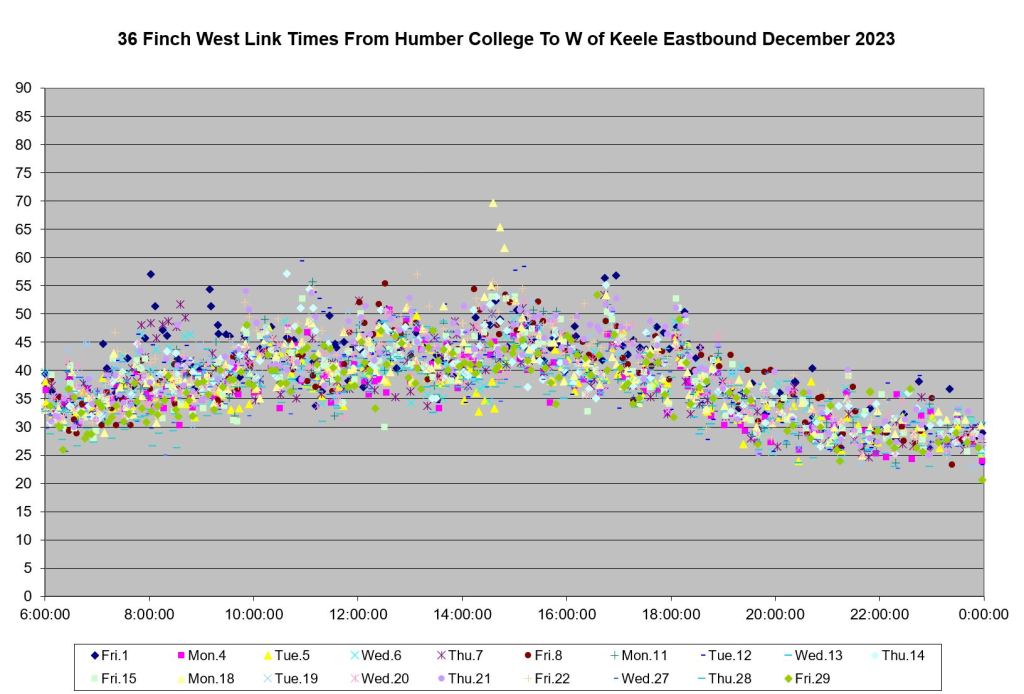
- By December 2023, travel times are back to the 40-45 minute peak range although the duration of the peak period is spread out compared with 2017. Week 4 data show the effect of the Christmas holiday period with faster trips than the other weeks this month.
- A direct comparison between December 2023 and the preconstruction period must take into account the reconfiguration of Finch Avenue with the LRT right-of-way. Buses are making roughly the same travel times today as they did in 2017.
Still to be seen will be the performance of the LRT line. Although vehicle testing on the route is in progress, there have been no simulations of regular operations to determine what actual travel times will be like allowing for stop service time, signal priority such as it might be, and operator behaviour.
The distance between the screenlines used in these analyses is 10.3km. For a 45 minute one way trip this corresponds to an actual speed of 13.73km/hr. For a 40 minute trip, this would be 15.45 km/hr. These are slower than the pre-construction scheduled speeds over the entire route.
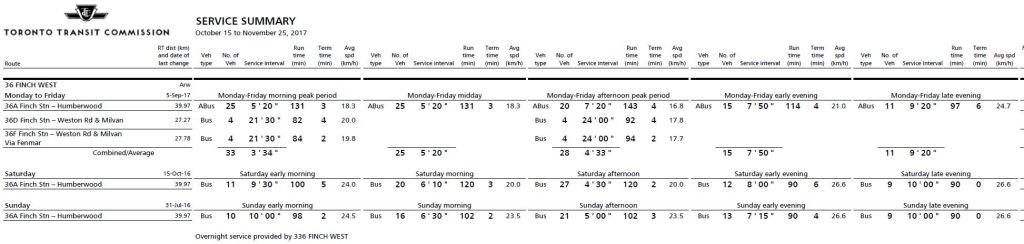
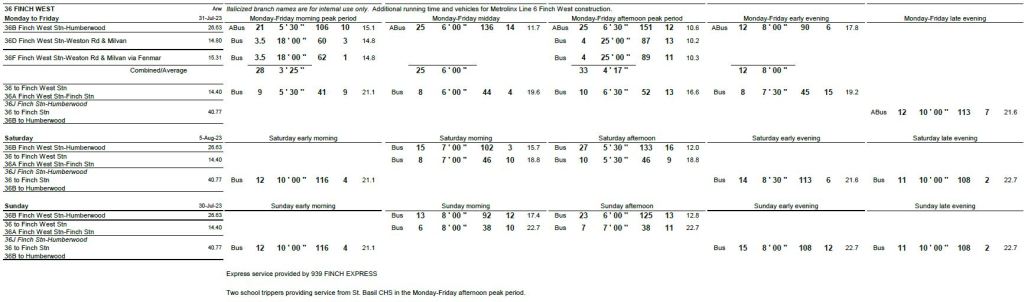
The Scheduled Service Summaries for October-November 2017 and November-December 2023 are shown below. Note that for 2017, trips to Humberwood originate at Finch Station and the scheduled speeds reflect a longer route. In late 2023, the actual speeds are better than the scheduled values which still reflect provision for construction delays.
Detailed Travel Time Data
Each data point in the charts below represents one bus making a trip across the route.
- For 2017-2019, these charts show visually the typical spread in travel times which mostly lie in an 8-10 minute range with very few outliers in the early months (this echoes the standard deviation values in the corresponding charts above).
- In May 2020, the cloud of data points is slightly narrower reflecting more uniform trips, but there is still a spread in values in spite of the lighter-than-normal traffic conditions.
- From November 2020 onward, the data points are more scattered reflecting construction effects and the inability to maintain reliable travel times.
- By December 2023, the cloud of data points is back to a better-behaved condition, but is still somewhat more scattered than in 2017-18.


Signal priority is a BIG problem for public transit in Toronto. Being controlled NOT by the TTC, but the Transportation Department, their priority remains (for now) the single-occupant automobile. We see that on The Queensway, Spadina Avenue, and St. Clair Avenue West. Single-occupant autos turning left go ahead of the 100+ people on board the streetcars. The streetcars also have a speed restriction of 10± km/h crossing the intersections, if they obey the speed limit signs directed at them.
It could be worse for the light rail vehicles on Finch Avenue West (and Eglinton Avenue West). Will the single-occupant autos turning left get priority over the 200+ or 300+ people onboard the light rail vehicles? Who should get priority?
Steve: The speed limit at intersections on The Queensway is set by the TTC in one of their many overabundant cautions lest errant motorists are hit by streetcars. I fondly remember truly fast trips from Roncesvalles to Humber hitting green lights all the way without slowing down. The autos-first attitude is not confined to Transportation Services.
LikeLike
The rush-hour bus travel time of 40-45 min from Keele to Humber College is pretty bad.
If the LRT can consistently get it down to ~ 25 min at all time, then the riders will perceive it as a massive improvement. Even if the late evening travel time doesn’t change much.
LikeLiked by 2 people
So basically you’re hinting that the lrt will be no faster than the buses, or at least not by much.
Steve: Actually, the contrary. It has become fashionable among some anti-LRT folks to downplay the LRT time saving by using the wrong basis of comparison for operating speeds, and failing to take into account the effect of varying levels of congestion on bus travel times compared to a route on its own right-of-way. That said, the TTC has an unerring ability to cock things up by artificially slowing down operations together with “signal priority” that does not do its job.
LikeLiked by 2 people