
Many shouts of “hurrah” have been heard around transit circles with the news that the TTC will be operating service at 95% of pre-pandemic levels on the bus network in early 2024 building up to 97% by the Fall.
The key question here is “95% of what?”
To make this a tad simpler, consider a rider who is told that service is back to 100%. To someone waiting on a street corner, this means that the bus will arrive (or at least be scheduled) at the same frequency as it was four years ago before the covid cuts tore through many routes’ service levels.
At the risk of disappointing readers, they should not rush out on January 7, 2024 when the next schedules come into effect waiting for the miracle of restored transit service to roll down their street.
Politicians and management who trumpet the return to “full service” should qualify their excitement with the fact that service on many routes is less frequent than it was in 2020.
“Service” also includes crowding standards. It is hardly valid to claim full service restoration if crowding standards pack more riders per vehicle before service is improved, and even that depends on available vehicle hours in the budget. It has been many years since the TTC published current loading stats and a list of routes that are operating beyond standards.
Truly restoring full service will require more resources than the TTC has been given or will see in the 2024 budget, and a political will to talk about “service” in a way that reflects rider experience.
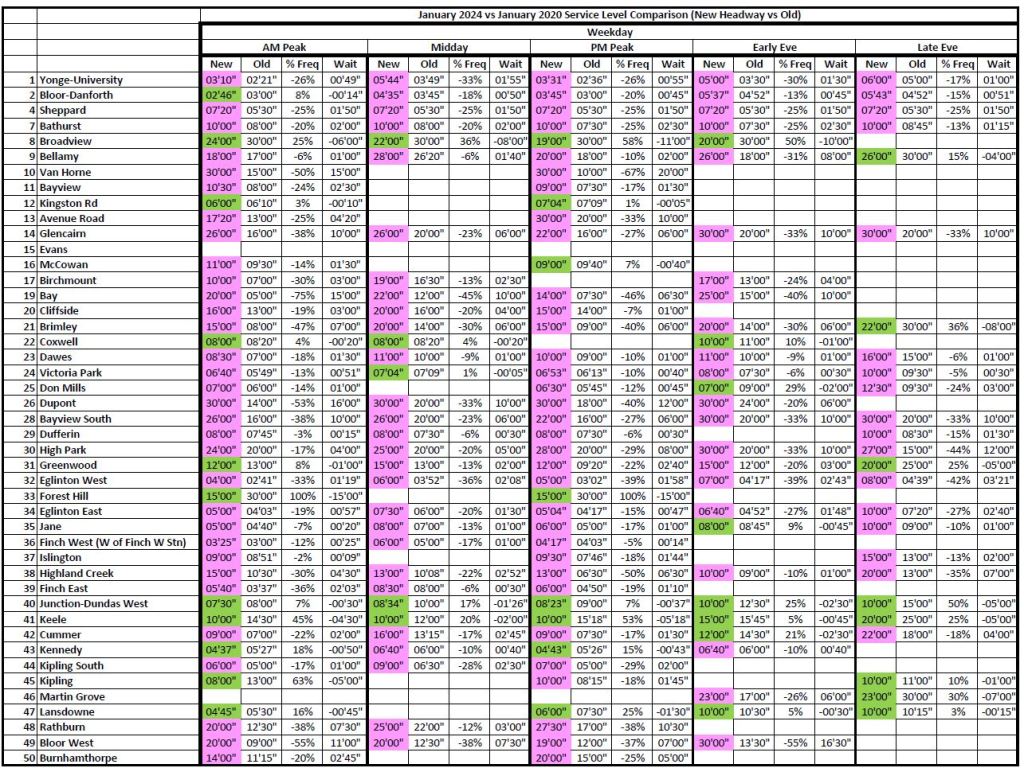
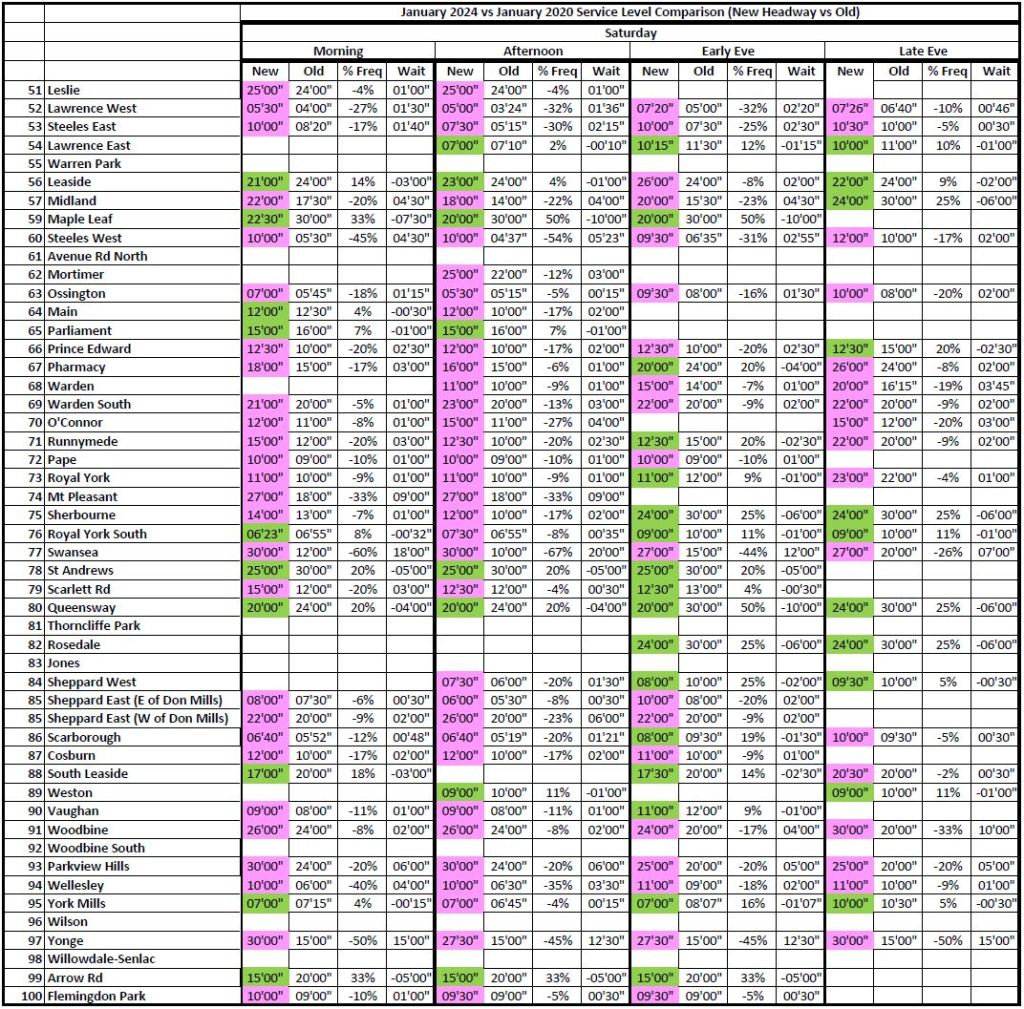
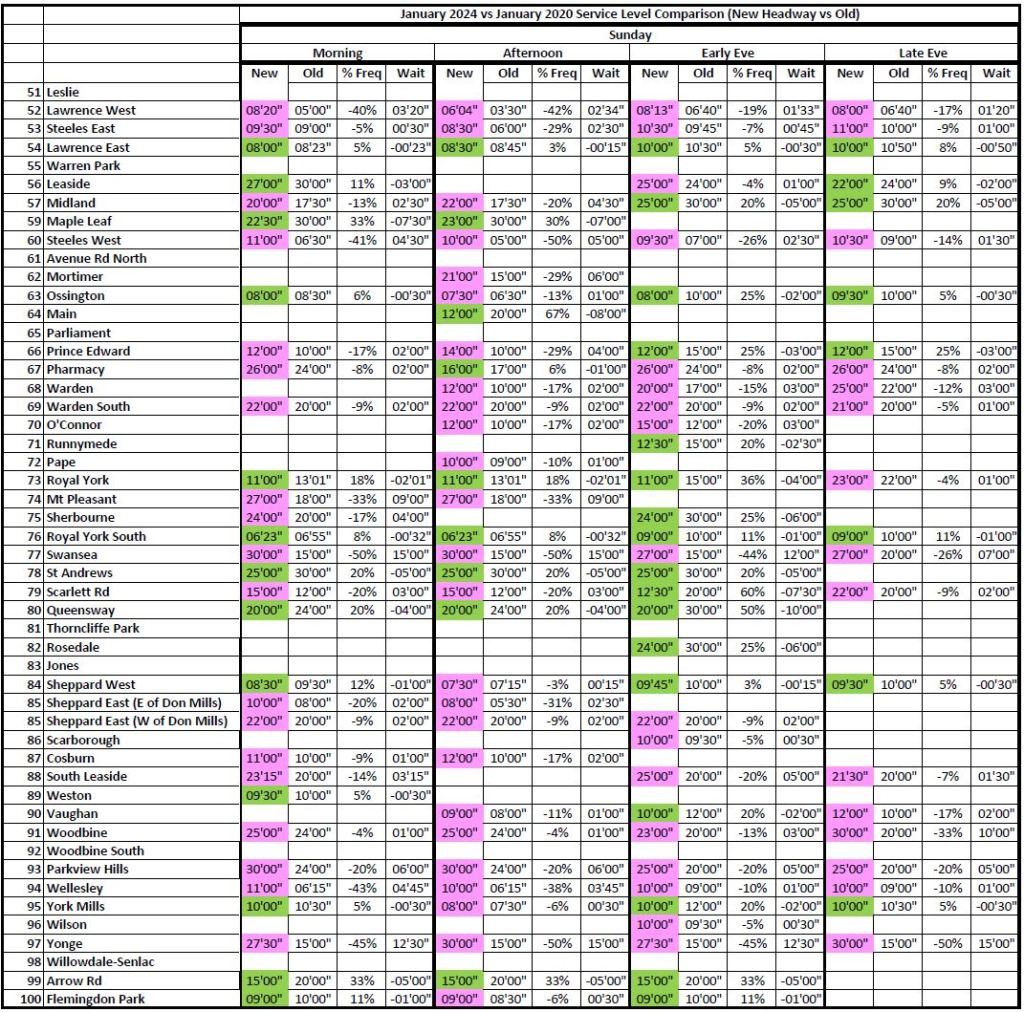
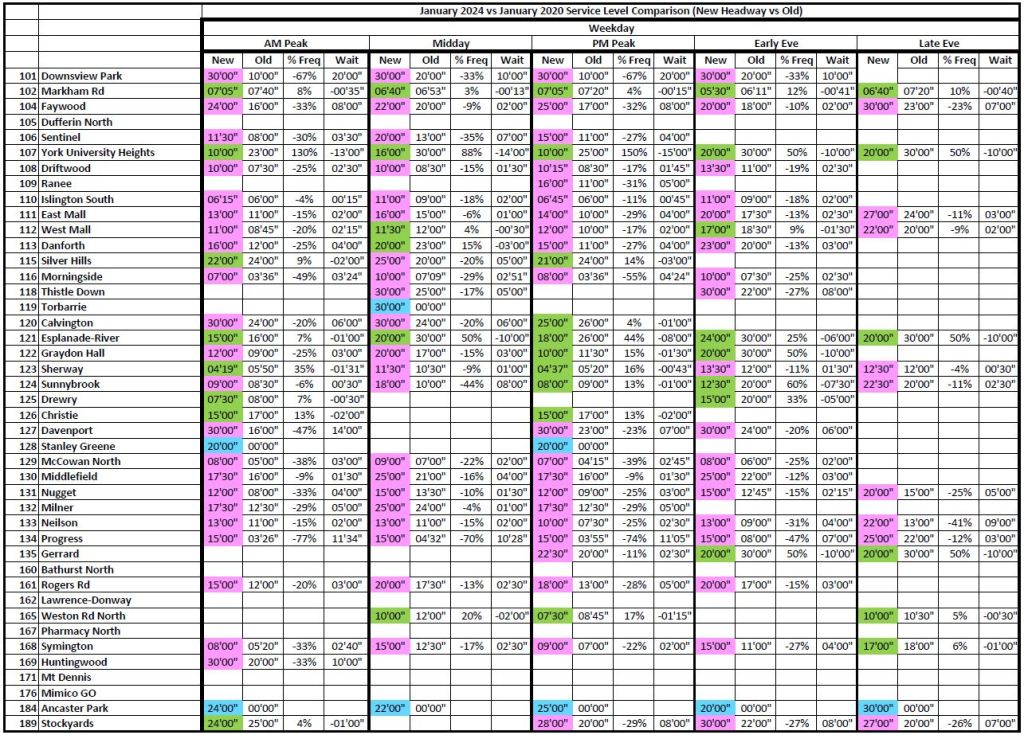
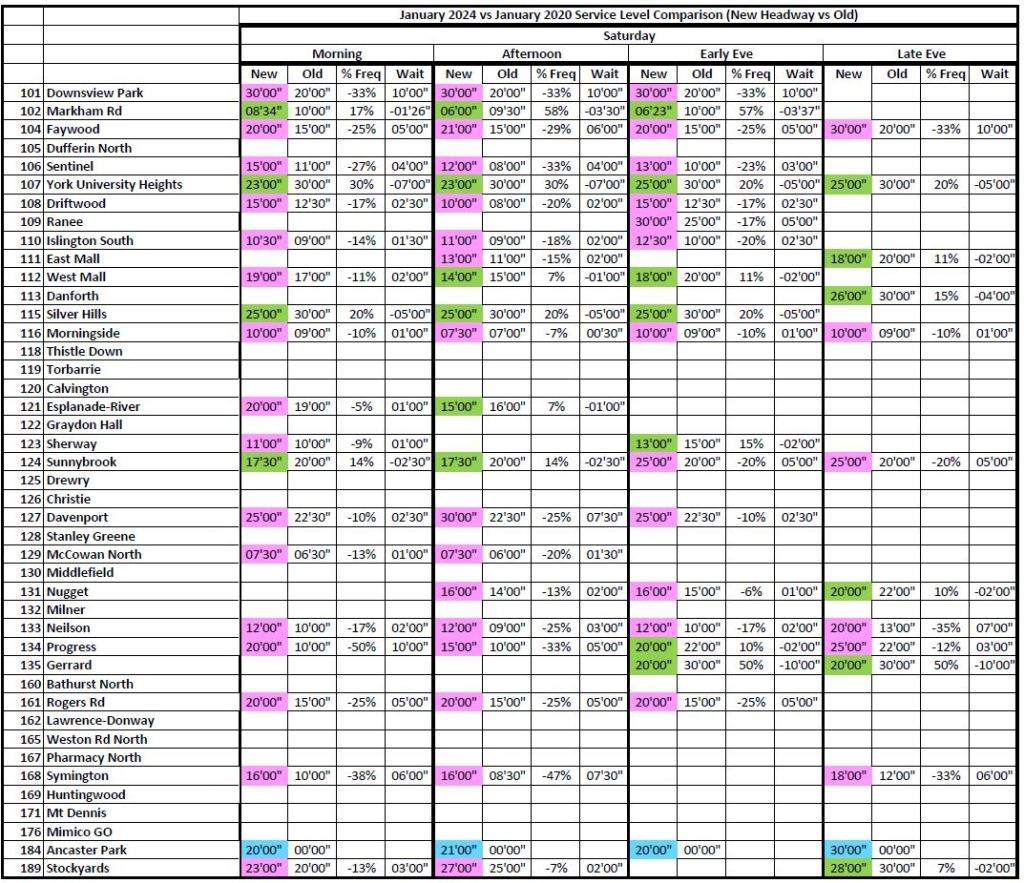
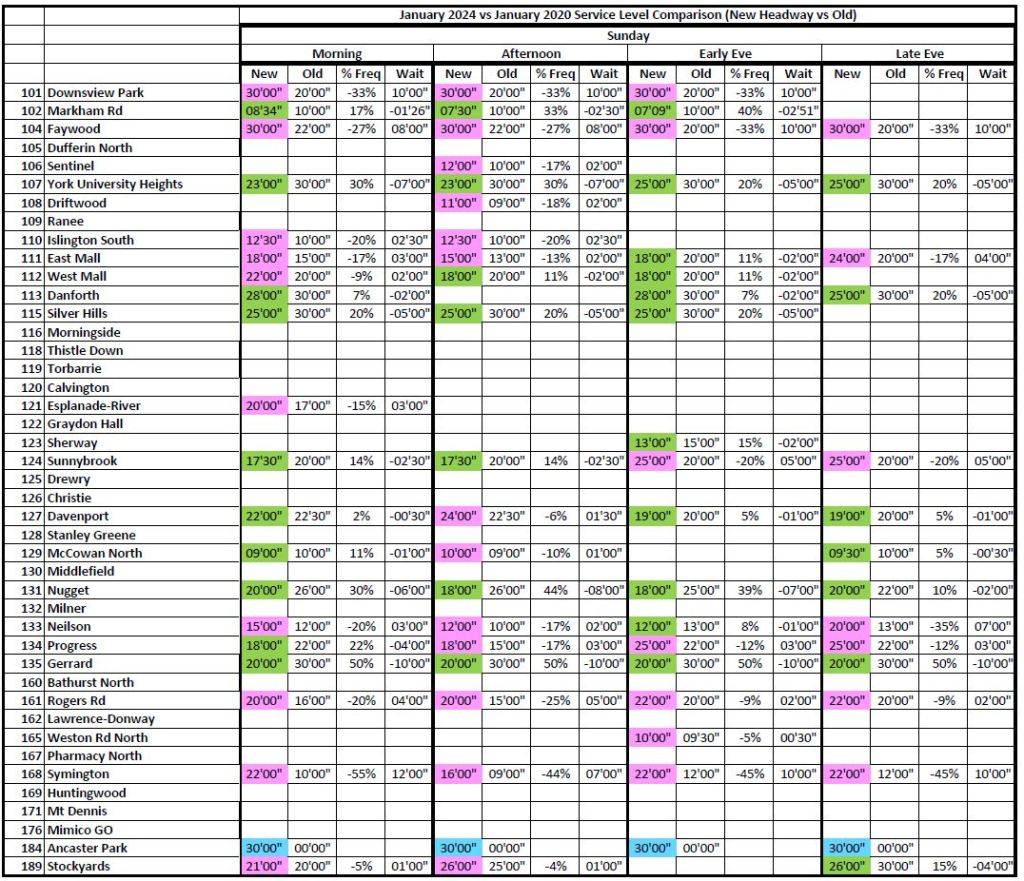
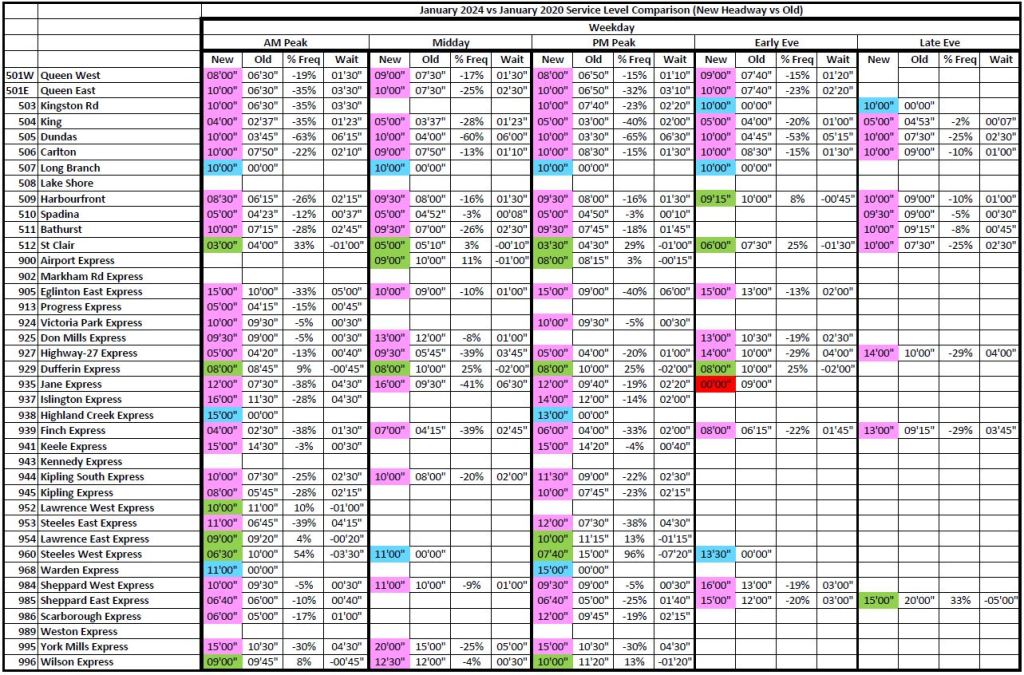
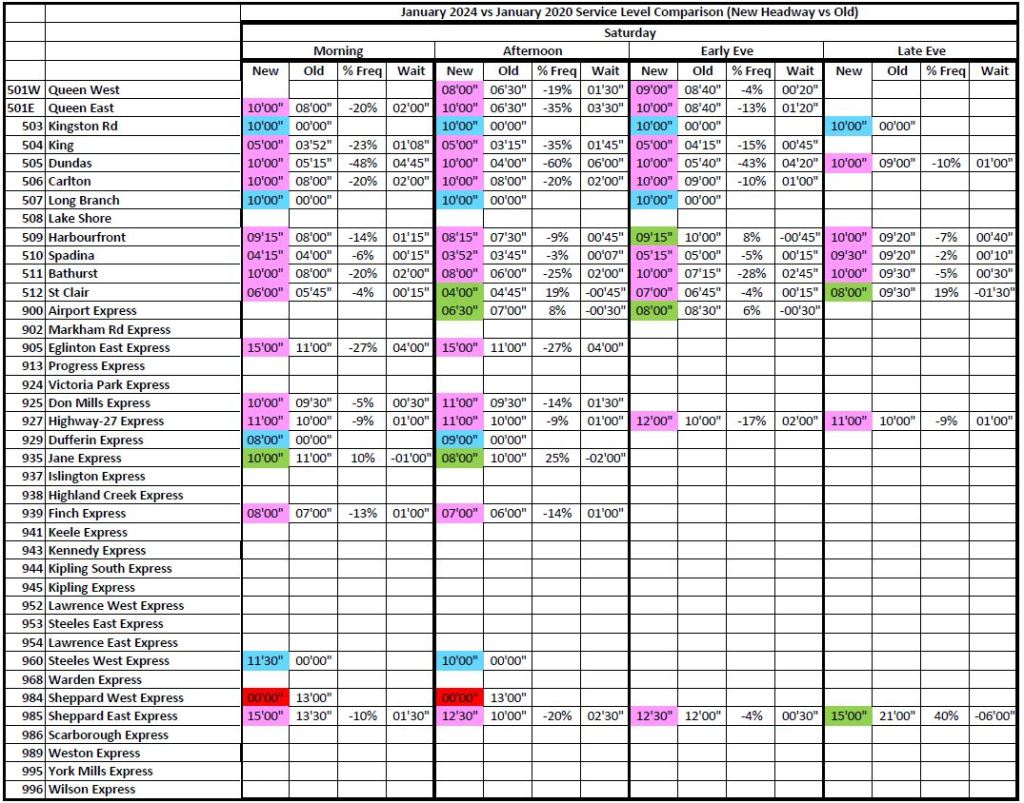
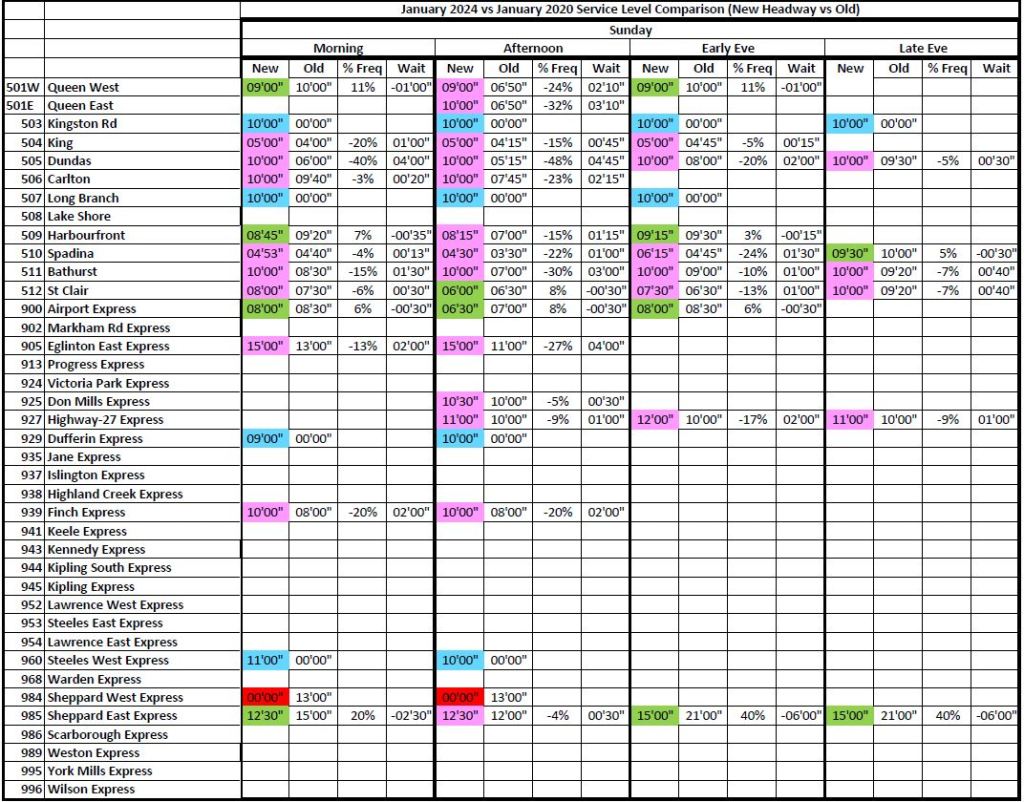
The table below compares the January 2020, pre-pandemic, service levels on all routes to what is planned for January 2024.
A few notes for readers:
- The columns contain weekday, Saturday and Sunday headway data respectively.
- Weekdays show the am peak, midday, pm peak, early and late evening periods.
- Weekends show the late morning, afternoon, early and late evening periods.
- Within each period, four values are shown for each route:
- The January 2024 (aka “new”) scheduled headway (interval between vehicles)
- The January 2020 headway
- The percentage change in frequency of service based on vehicles/hour
- The absolute change in wait time
- The colour scheme shows at a glance how headways have changed over the four years:
- Pink shows a service reduction.
- Green shows a service improvement.
- Red shows a service that does not operate in 2024.
- Blue shows a service that did not operate in 2020.
- Blank cells are periods of service with no change.
The full set is available as a pdf here.
There is a lot of pink still in this chart showing that many routes are not yet at 100% or better. Lest someone claim that “but it’s only 5%”, just look at the percentage changes that are routinely in double digits.
The vital point lies in how TTC calculates 95% recovery of service. This does not reflect the number of buses per hour (the inverse of the headway), but the total vehicle hours scheduled across the bus system. Some routes will have more, some less, but there is more than this at work.
Many routes have adjusted travel times to deal with traffic congestion, and a common “fix” for this is to stretch the headway on the premise that the route is operating within accepted crowding standards. This compounds with the relaxed off-peak standards included in the 2023 budget to allow less frequent service even if the same number of buses are operating on a route. The vehicle hours stay the same, but not the frequency of service.
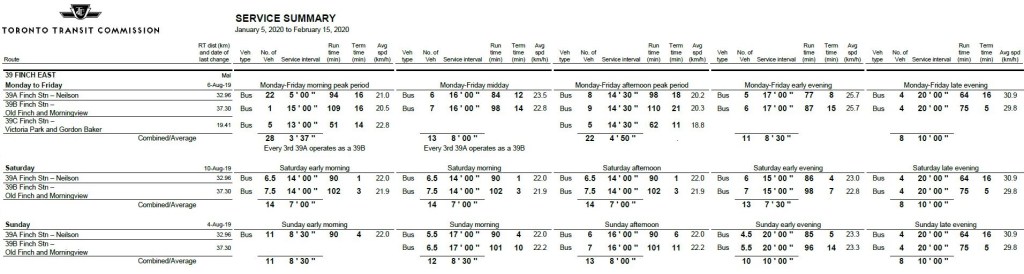
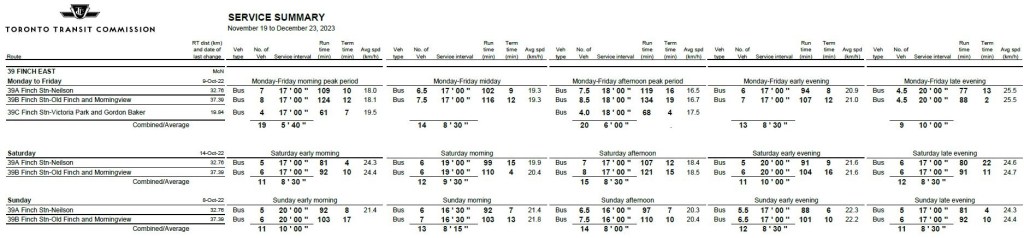
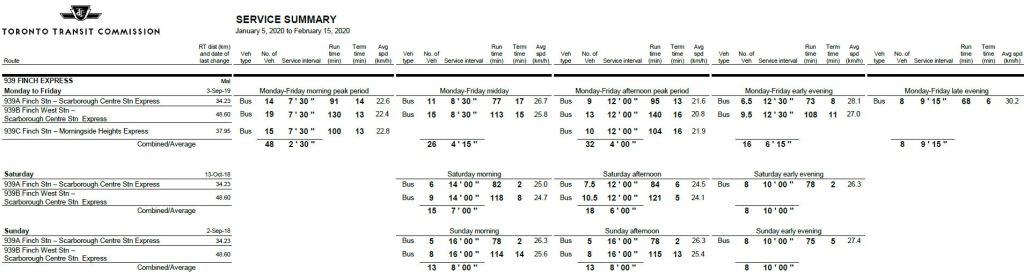
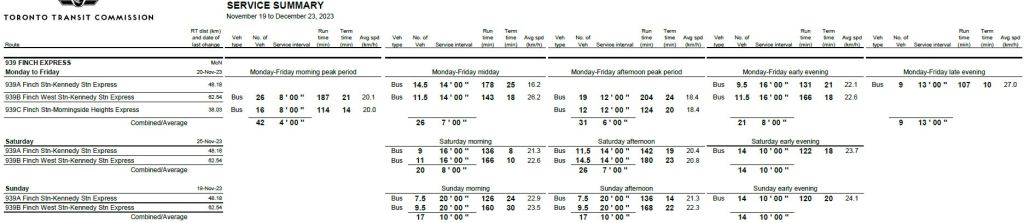
For example, the tables below show the scheduled service levels for the 39 Finch East and 939 Finch Express routes in January 2020 and November 2023 (these schedules will remain in effect in January 2024). Worth noting:
- The scheduled speeds in 2023 are slower than in 2020. This means that more buses are required to provide the same service level. Even when the headway is unchanged as on weekday evenings, there are more buses providing the same service frequency.
- The 939 Finch Express was extended to Kennedy Station as part of the SRT replacement network. This adds to the length of trips requiring more buses to operate the same service, or alternately the same number of buses providing less frequent service. The combined effect of the extension and slower scheduled speeds makes for much wider headways in 2023 than 2020 during the weekday midday with the same number of vehicles.
This type of comparison can be found throughout the schedules, especially the longer travel times. The result is that even if vehicle hours stay the same, there is less service as experienced by riders. The situation varies from route to route, period to period, as the TTC reallocates vehicle hours (the primary driver of costs) within the available budget.
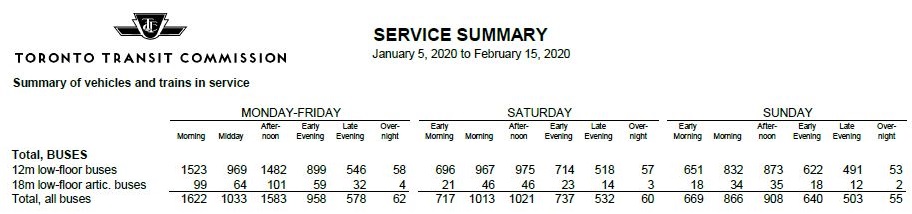
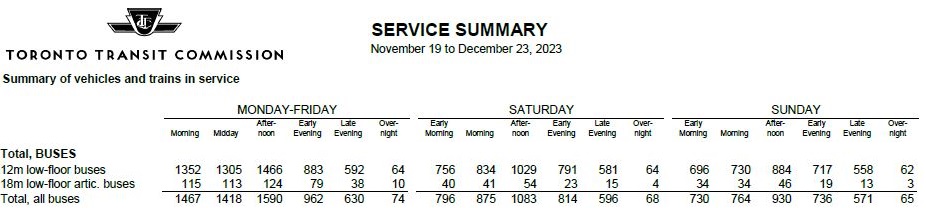
Another way to compare overall service levels is the number of buses in service by period. Here are the January 2020 and November 2023 totals (the January 2024 information has not yet been published in this format). Note that these numbers include service added to routes to deal with construction delays, but not the “run as directed” buses which the TTC routinely hypes with claims that service is actually better than on the schedules even though there are far too few “RADs” to make much of a difference.
The profile of scheduled buses by time of day changes a lot from 2020 to 2023 reflecting various changes including a shift away from peak period demand in the morning and the strength of off-peak demand, as well as higher congestion in the PM peak.
(In January 2024, the number of buses will rise by 29 in both the AM and PM peaks.)
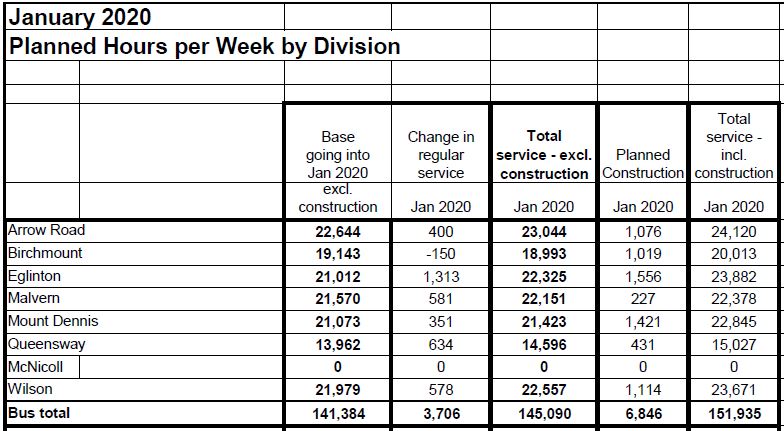
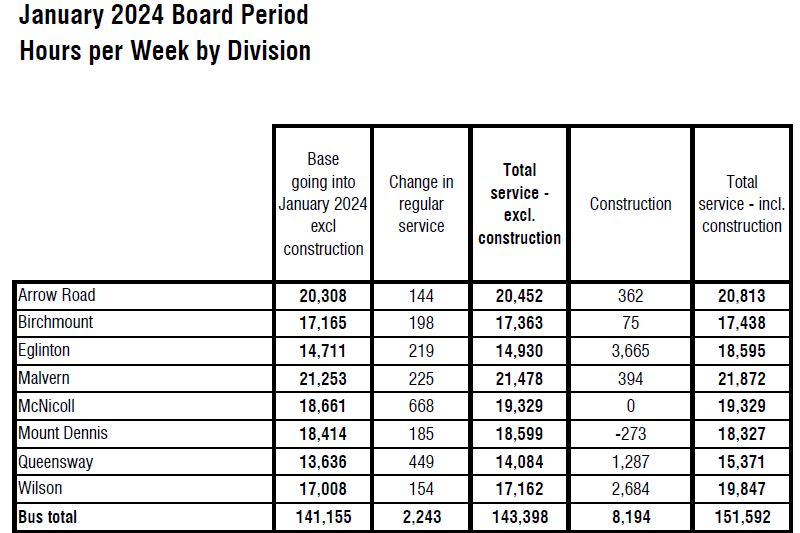
The tables below show the scheduled service in bus hours for January 2020 and 2024. The grand totals are almost the same showing that on this basis of reporting bus service is comparable in the two periods. However, these buses are, in general, travelling more slowly in 2024, and network changes including the SRT replacement have added bus hours to the 2024 total without adding to overall service.

As I noted in a different thread the service on line 1 north of Glencairn in morning rush is actually better now than it was pre-Covid despite overall service on the line being worse. So combined table for routes where multiple branches exist now or existed before Covid may not show the full picture.
Steve: Yes, there is more detail at the branch level, but in most cases the branches are proportionate to the main route and so the percentages would not change. Line 1 north of Glencairn is an exception.
LikeLike
In the summer of 1977 I interviewed the GM of Calgary Transit about the construction of their LRT line. He said that traffic on McLeod Trail had double the travel time of the buses on it. I still remember his statement that “We’re not buying more buses to carry people but rather to store people.” I thought that this was an eloquent way to state the problem.
LikeLiked by 2 people
I’ll bet most of the service increases are because of the Line 3 disappearance in Scarborough. This results in an “average” 95%, balanced to the negative with decreases outside of the Line 3 influence.
Steve: Actually, if you read the detailed tables you will find that there are few service increases on the Line 3 replacement routes. Only more buses because the routes are longer. There has been a mix of better and poorer routes every time I have run this, most recently in May 2023.
LikeLike
Before the pandemic, 73c Royal York southbound to Royal York had 15 minutes headway, now it has 22 minutes. How can you elaborate about that?
Steve: There isn’t much to “elaborate on”. 73C is one branch of a three-branch route, and the values shown in the table are for the combined service on the common section. It is one of many routes that has a long way to go to get back to 100% service, if it ever does.
LikeLiked by 1 person
I find it interesting that the two bus routes I use most often are treated differently. The 75 (Sherbourne) gets LESS service though it always seems quite crowded while the 121 (The Esplanade) gets MORE, though 121 buses are almost always pretty empty – except at Christmas Market time.
LikeLiked by 1 person
Some of the routes in west Etobicoke have even worse service compared to during the pandemic. When I complained to the TTC and some of the councillors on the TTC board regarding lack of service on the west side of Etobicoke, they told me that they don’t expect the ridership to grow in that area so they had no choice but to cut the service..
Yet 49 Bloor West used to have a headway less than 10 min during the morning rush, now it is 20 min.
Crowding on 50 Burnhamthorpe got even worse when the headway increased from 15 min to 17 min to now 20 min.. and it is so funny that the headway on that route is better on the weekends than the weekday.
With that.. the route management on the TTC is absolutely terrible and complete gong show.
LikeLiked by 1 person
The TTC implemented so many so called “reliability” changes which lead to wider headways in the name of service improvements. I suppose if they restore to their so called 100%, most routes would see wider headways than 2020. They wouldn’t be able to operate those 2020 headways with the same resources when round trip time is much longer.
Steve: Yes, those “reliability” changes were initially worthwhile because some routes had unrealistic schedules. However, with this tactic tied to Rick Leary’s “no short turns” goal and the mistaken idea that having generous travel times will ensure on-time departures creates a situation where some routes have badly padded running times that show up as queues of buses and streetcars at terminals.
LikeLike
As per your chart, will the 95 York Mills be getting a service increase in January compared to what it was before the 2023 holiday board?
Thanks.
Steve: There is no change planned for January 2024 on the York Mills corridor. Peak service there used to be a lot better than it is now.
LikeLike
Hello Steve. Just wondering how many transit ops the TTC has budgeted to hire in 2024?
Also, do you think that the Eglinton lrt will open in 2024 like Mx says it will?
Steve: The Operating budget does not break out specific positions for additional hires, only the grand total across all departments. The total for all operations positions goes up by 322. In the Capital budget, there is a provision for 51 operators for service required to backfill for construction work. The actual numbers hired would, of course, be affected by the number of operators who retired or resigned during the year.
As for a Line 5 opening date, I really have no idea. TTC has budgeted for it to happen in September, but that is only a placeholder.
LikeLike
What did the Dundas car do wrong to earn such huge cuts in frequency? Midday and evening trips aren’t downtown office commuters.
LikeLike
I was thinking about this the other day and went back to look at the old documents before the introduction of the LFLRV with the old 2013 CLRV service and new proposed Flexity service levels. The 2024 peak frequencies are almost doubled across the board and even off-peak/weekend service has been slashed quite a bit.
That means most lines aren’t operating with any more capacity than they did in 2013 with the CLRVs during most periods of the week. I haven’t done the math on all of them but I think some lines (Bathurst/Carlton peak, Spadina midday and Sundays) are even operating with less capacity in 2024 than they did in 2013.
Steve: Roughly speaking, that is correct.
LikeLike