
This article continues my reviews of bus operations on 512 St. Clair in September 2023 and of streetcar operations in the preceding months.
One aspect of any route’s operation is the degree to which vehicles have time for a layover at terminals. If this time is too small (or worse, none at all), service can be disrupted by the simple need for drivers to answer calls of nature and just decompress for a few minutes.
There is no formal break built into schedules in Toronto as can be found in some other transit systems, but a quick look at the TTC’s schedule summaries will show that most routes have built in “recover time”. This is intended to compensate for random events during a trip, although sometimes it is simply a mechanism to make the round trip time come out to a multiple of the scheduled headway.
Some of the “service reliability adjustments” the TTC advertises with schedule change are nothing more than shifting time from “recovery” to “driving” time without actually changing the round trip time. In other cases, time is added or removed without changing the total number of vehicles causing the service headway to get longer or shorter.
When schedules have excessive travel and/or recovery time, vehicles queue up at terminals causing congestion on the approach if there is no place to park off-street.
In the case of 512 St. Clair, the time spent at St. Clair Station (the eastern terminus) was fairly consistent up to the end of June 2023, but things got really messy. This corresponded to the point where service on the line as a whole became considerably worse as we saw in earlier articles.
This was caused by two competing factors in route operations.
- In July and August, the TTC extended streetcar service to Gunn’s Loop west of Keele even though it was only scheduled to run to Earlscourt Loop at Lansdowne. This made keeping “on time”, the TTC’s holy grail of service management, impossible.
- The approaches taken in July and August were quite different, but a common factor was that streetcars spent more time sitting in St. Clair Station Loop to get back on time at the expense of providing the advertised service on the route.
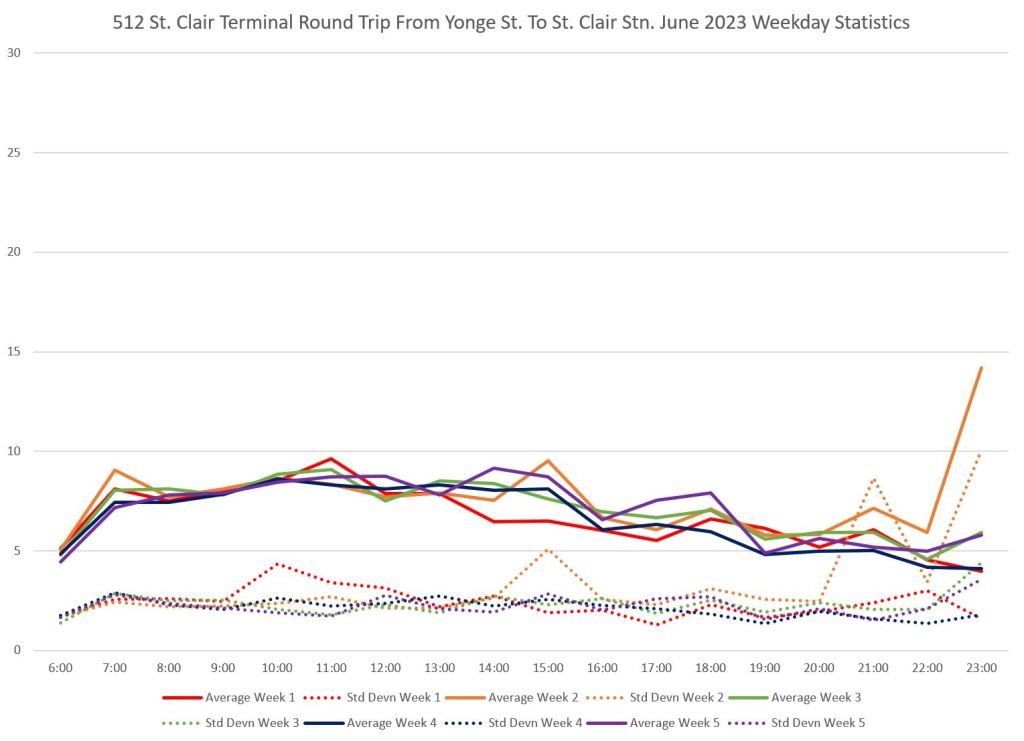
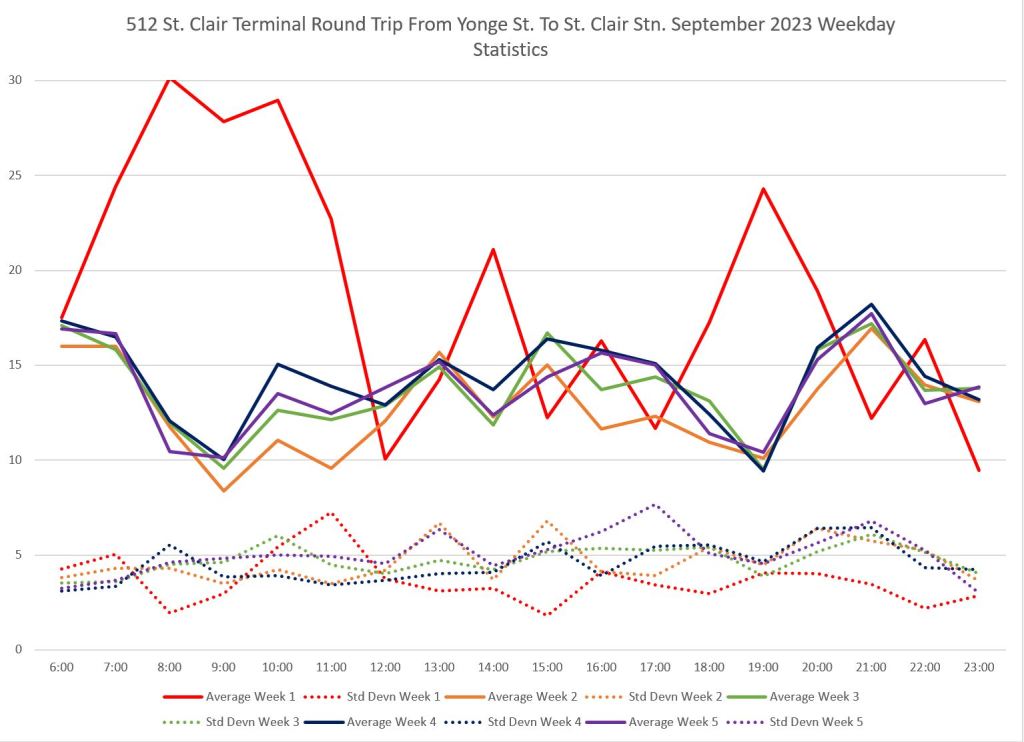
The charts below show weekday data for the months of April through September. The time measured here uses a screenline just east of Yonge Street, and shows the round trip time from that point around the loop and return including any layovers taken enroute.
Each line contains the averages for one week broken down by hour from 6am to midnight. For the first three months, these values lie in a consistent band centred roughly at 7-8 minutes. The dotted lines show the standard deviation of the values, and the closer these values are to zero, the more tightly bunched the individual times are to the average. The higher the SD value, the greater the variation in individual times and, by implication, the greater the variation in layovers.
Starting on May 7 (see schedule summaries in the previous article), the frequency of service was cut from 5 to 8 minutes, and the western terminus shifted to Lansdowne. The schedule change had little effect on the time spent at St. Clair Station because the round trip times reflected the shorter route.
In July, however, service was extended back to Gunn’s Loop because of the utter inability of the substitute 47 Lansdowne bus branch to operate reliably on St. Clair West. This required changes to operations in an attempt to keep streetcars on time, although it would have made much more sense to simply dispatch on a headway and let “on timeness” go to the wind.
The result in both July and August was that streetcars ran even less frequently than the planned 8 minute headway, and they took longer layovers at St. Clair Station. Riders who had enjoyed a fairly good 5 minute headway in April saw that fall to 8 minutes in May-June, but then to 10 minutes or worse through the summer. Meanwhile, streetcars spent more time on layover than they had earlier.
Note that the high red line for week 1 in September is the end of streetcar operations and reflects the August conditions, while the remaining weeks show the behaviour of the replacement bus service.
The bus layovers, in spite of severe problem with congestion enroute, are consistently taking more time than the streetcar operations in the early months.


A longer view of this behaviour is evident in charts showing how layover times have evolved since January 2022. In these charts the blue line is the median value (half of the trips lie below this, and half above) while the orange line is the 85th percentile which captures all but the outlying high values. When the values are consistent, the two lines are close together.
Each chart shows data for an hourly period starting in the AM peak and ending late evening, and each data point is one weekday’s data. The abrupt change in the summer of 2023 is quite obvious.

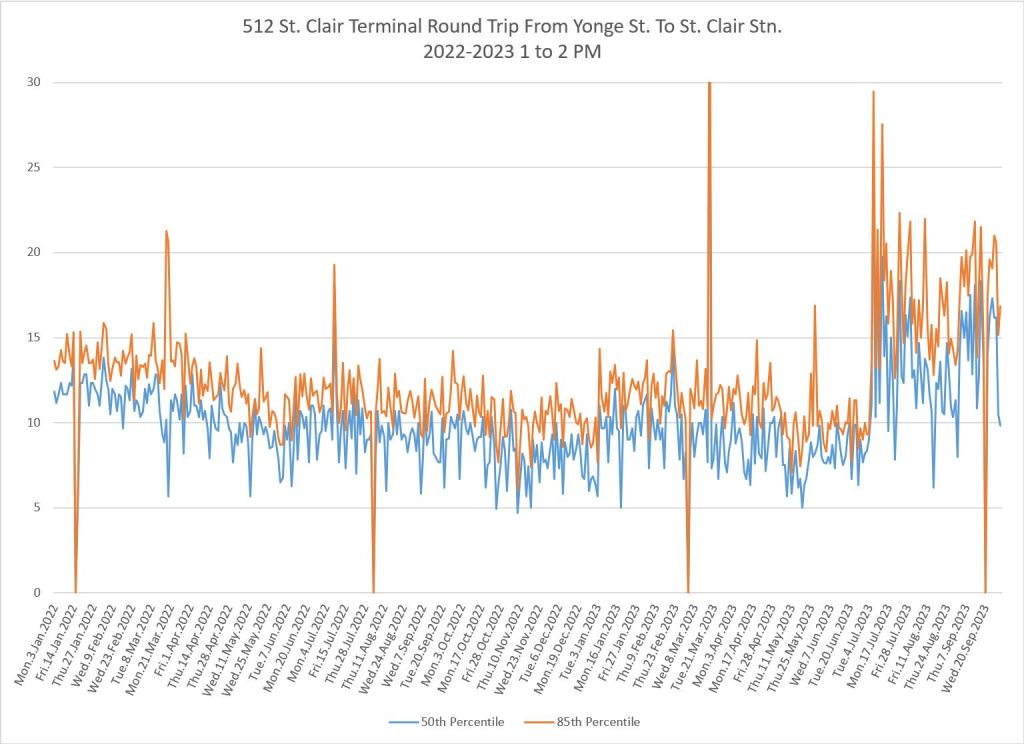
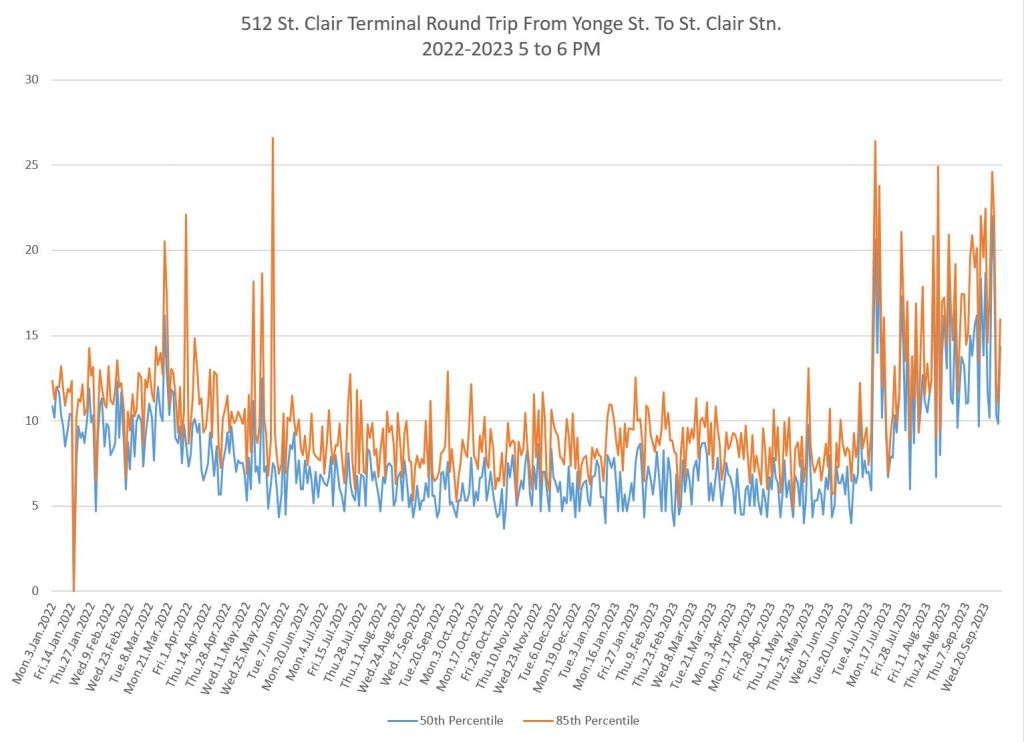


There is a general problem with the reliability of services on routes with partial or full bus replacements, construction diversions and other long-running impediments to normal operation. The TTC excludes these routes from its overall reporting of reliability, and rider experience often is that there is little or no actual management of service quality.
This is completely the wrong way around. Routes that are not operating normally deserve extra attention so that the best service can be provided to riders who must deal with unusual routes and longer trips. It is not acceptable to simply say that there is “construction” and nothing can be done.
The same applies to provision for transit priority through signalling changes, especially at turns that are not part of normal operations, and to on street traffic management. This should not be an afterthought, but should be in place from day one.
Early in 2024, I will update the review of bus operations on St. Clair to show what, if anything, has changed for better or worse.
Postscript: Looking at the Range of Values
Another way to plot the range of values is to show the range each quartile covers. What this does is to divide the data into four groups of equal size arranged from low to high value. The plot shows the overall range of values as well as how tightly grouped they are.
Here are three samples from different periods of operation. Each vertical bar contains data for one hour within the week cited in the title. The median value (corresponding to the charts above) is at the boundary between the green and blue bars in the central box. The “tails” show the outlying values below 25% (red) and above 75% (purple).
- April 2023: This is during normal streetcar operation over the full route. The 60 minute scale on the y-axis is not strictly necessary, but was used to allow direct comparison with data from later months where values are much more scattered.
- August 2023: This was the worst month of the streetcar operation with the attempt to provide a Keele service on Lansdowne running times. There is a lot of sitting around at St. Clair Station in an attempt to restore the schedule, an impossible task.
- September 2023: This shows the bus operations. One might have hoped for a return to April-like values, but the buses are taking much longer at St. Clair Station.


I am puzzled how extending a route beyond its scheduled terminal would lead to longer layover times in an attempt to keep things on time.
If you have a longer trip than your schedule allows, surely the first thing you do is reduce layovers and actually get rolling? Well, until the ops need to take a stress break.
Were they doing stepback crewing at St. Clair station, or what? (Don’t tell me that the streetcars wound up making half their scheduled trips, i.e. instead of doing four trips, they did two, and laid over for the rest of the time.)
Steve: Yes, because they were “late” from the longer trip, it looks as if they took extra long layovers and dropped trips now and then.
LikeLike
This past Saturday I found myself having to get from Spadina and St Clair to my home near Dufferin and St Clair.
There was a big crowd waiting for the westbound 512 replacement bus, so I just started walking.
I got to Northcliffe (the last stop before Dufferin) before the first 512 replacement bus finally passed me. It was literally faster to do the ~3 km walk than it was to wait for a bus.
Steve: Looking at the tracking data on Transsee.ca, you can see severe congestion westbound near Oakwood starting at about 2:30pm. This opens up a gap that goes out to Keele and reflects back to Yonge just after 4pm. The first two buses to arrive there don’t leave immediately, and there is a half-hour gap, probably the one you encountered.
This is an example of the problem that the “no short turns” policy creates. There are actually a few short turns visible in the chart, but for the most part, that pack of buses bounced back and forth across the route until about 8pm with its associated gap.
Although congestion did create the problem, the congestion did not persist. What did persist was the lack of action to space out the buses evenly on the route.
Note: Access to extended features like this on Transsee (which is run by Darwin O’Connor, not by me) is available free for TTC streetcar routes.
LikeLike
This peeves me: at St. Clair station, the replacement buses stop at the far end of the passenger pick-up platform, as if the bus was a full-length streetcar which it is not, People coming up from the subway have to walk (run) a fair distance,
Another peeve about subway stations: why do the escalators always run DOWN ???? At St. George I was one of several hundred people coming off trains faced with climbing the stairs (my legs are not good) while a solitary lady was going down on the escalator.
BTW, I have decided to TTC (take the car) henceforth for my twice-weekly trip on St. Clair until the streetcars return.
Steve: There are two escalators at St. George between the Yonge and Bloor lines. The eastern one runs down except in the AM peak. The western one runs up all of the time. I use that station a lot and curse, mildly, if I find the escalator running the “wrong” way for the time period.
LikeLike