
Effective September 3 and until July 2024, the TTC has replaced streetcar service with buses on oute 512 St. Clair for various construction projects. The length and scope of this work evolved between May 2023 and the point where the full closure was announced at the end of August. See The Changing Scope of St. Clair Construction.
Replacement buses are scheduled far more frequently than the streetcars they replaced, but they are running in the mixed traffic lanes beside a now-empty streetcar right-of-way. Depending on traffic conditions, travel times can be substantially longer with buses.
In the months before the conversion, the streetcar service was already in upheaval for planned work at the GO overpass west of Caledonia, and the St. Clair car was cut back from Gunn’s Loop (Keele) to Lansdowne. It was subsequently restored when the timing of work at the overpass changed, but the schedules were not changed to reflect the longer route.
This article reviews, mainly, the bus service from September 3-30, 2023. In a following article, I will turn to the streetcar service it replaced and the less than ideal quality provided during the on-again, off-again service through to Keele over summer 2023.
Responding to complaints about the bus service, the TTC has stated that they are working with the City on traffic signalling changes, as well as modifications to road lane allocations to remove bottlenecks in the bus operation. For the length and potential effect of this streetcar service suspension, one must ask why these changes are studied and, maybe, to be announced, implemented after the fact rather than as an integral part of the switch to bus service using the regular traffic lanes.
This is not the first time in 2023 (or earlier) that the TTC plays catch-up with getting priority measures for its service during extended diversions and construction projects. The attitude seems to be that problems will be addressed as and when they occur, rather than being anticipated and planned for, with transit service and riders getting a raw deal.
Scheduled Service on St. Clair
Here are the TTC’s summaries of the service scheduled for 512 St. Clair during three months:
- April 2023 when streetcars were scheduled from Yonge to Keele
- August 2023 when streetcars were scheduled from Yonge to Lansdowne, but actually operated to Keele
- September 2023 when buses were scheduled from Yonge to Keele
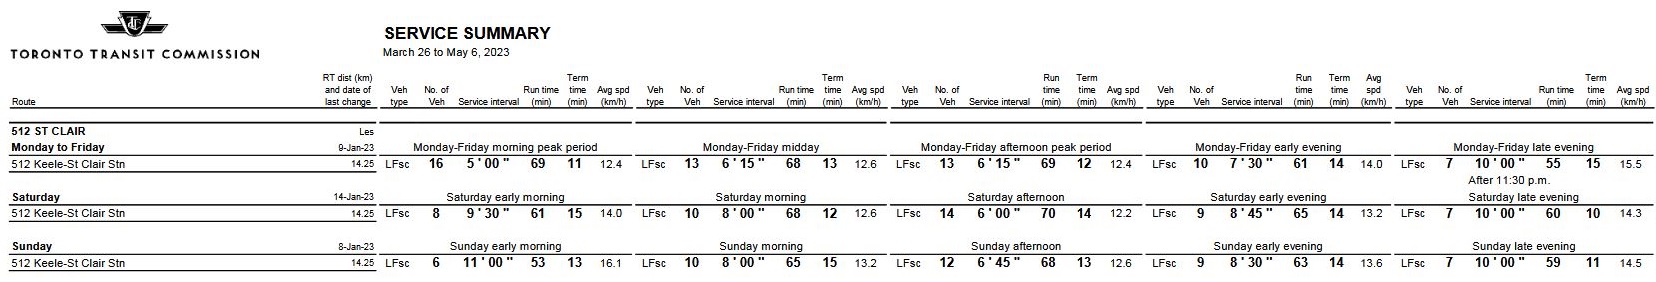
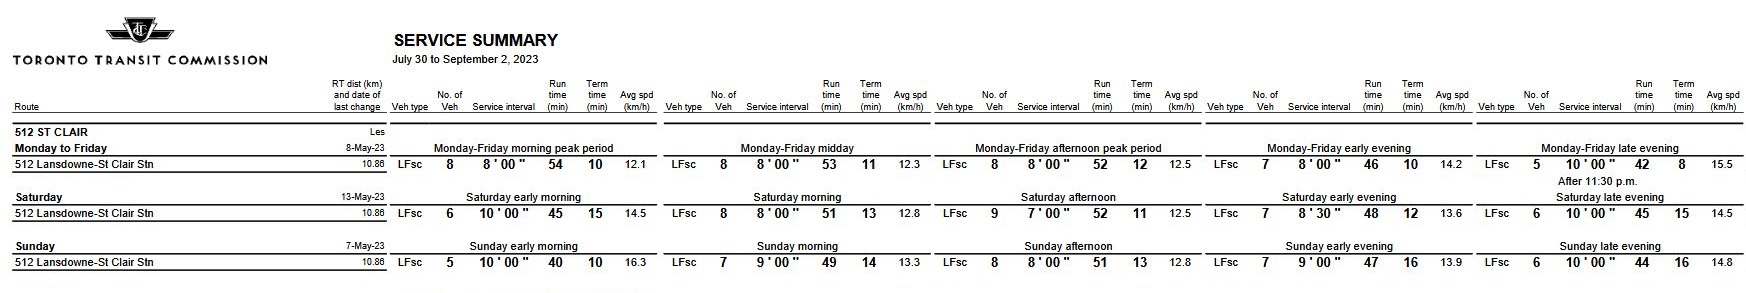

Note that between April and August there was not only a change in the western terminus from Keele to Lansdowne, but a considerable reduction in service levels during many periods. When the “Lansdowne” service was stretched to Keele, this compounded the reduction in the number of vehicles serving the route.
Furthermore, the replacement bus service, with vehicles half the size, generally does not provide the same capacity as the streetcars it replaced, even assuming the buses could achieve the scheduled travel time.
On paper, the scheduled speed of the bus service is slower than the streetcars by varying amounts from one period to another.
Travel Time Comparisons
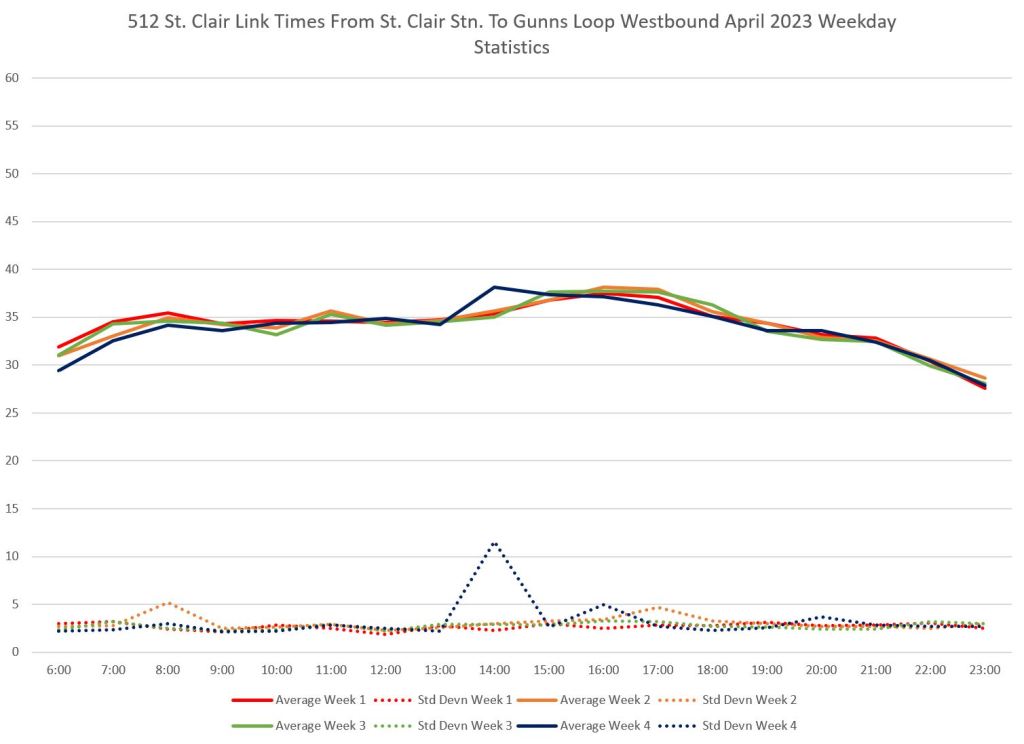
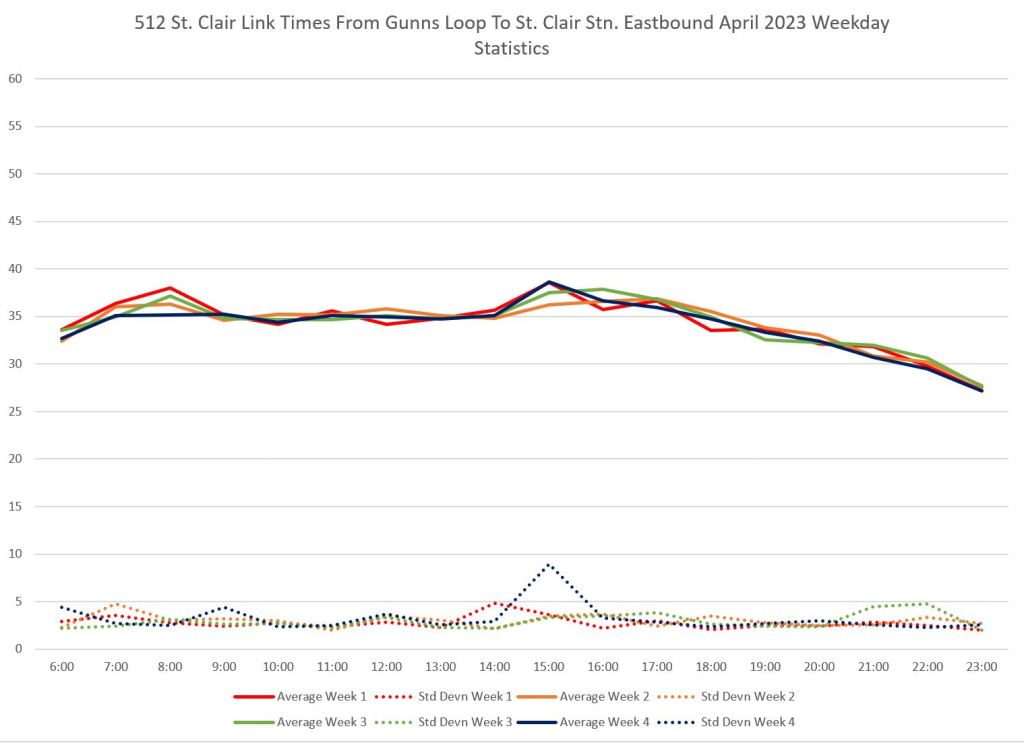
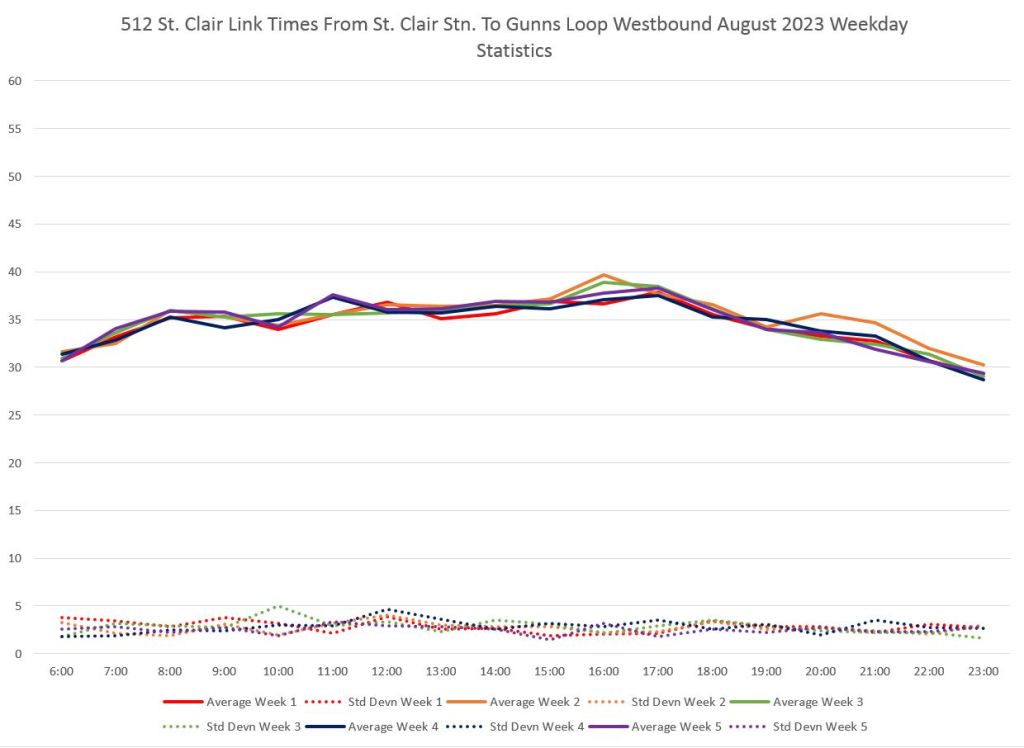
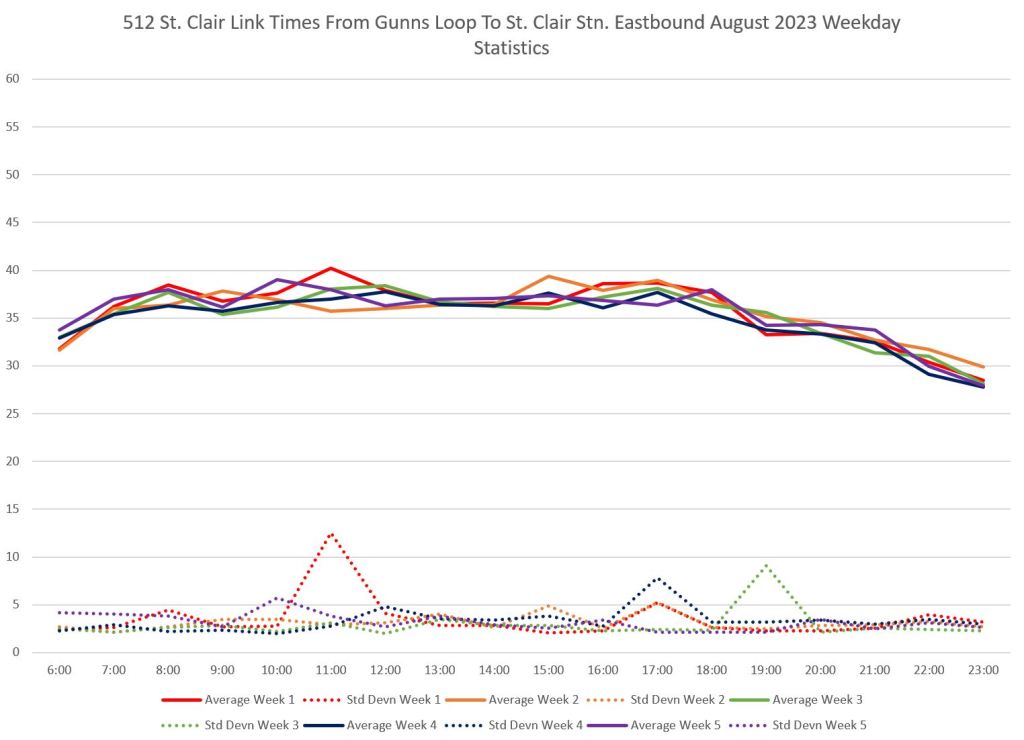
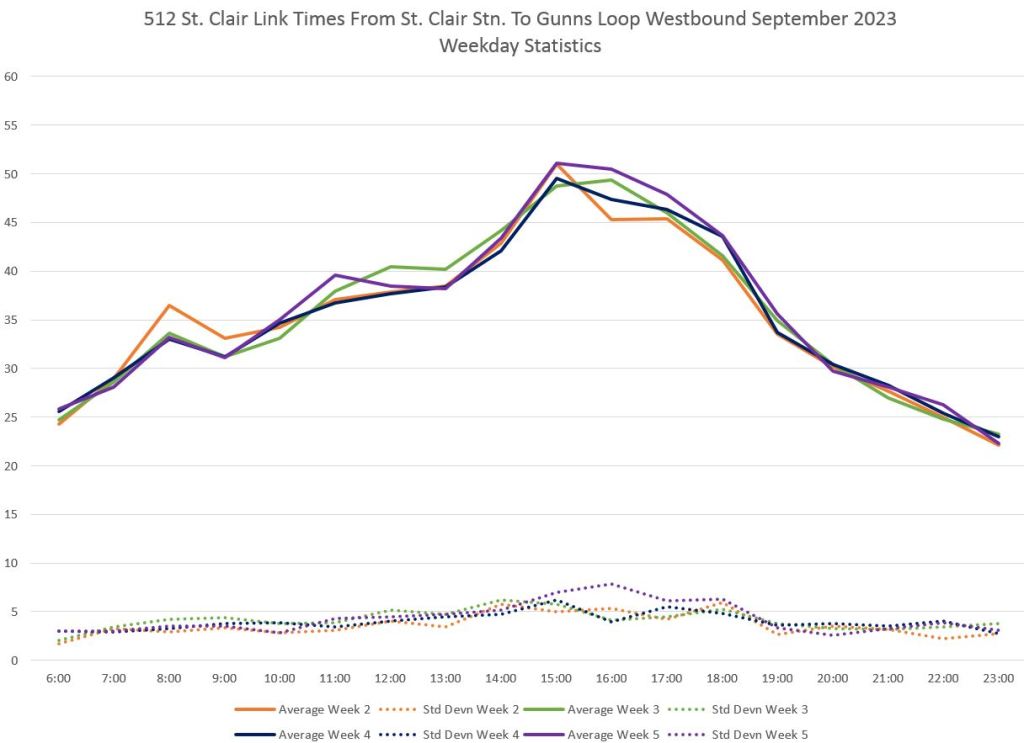
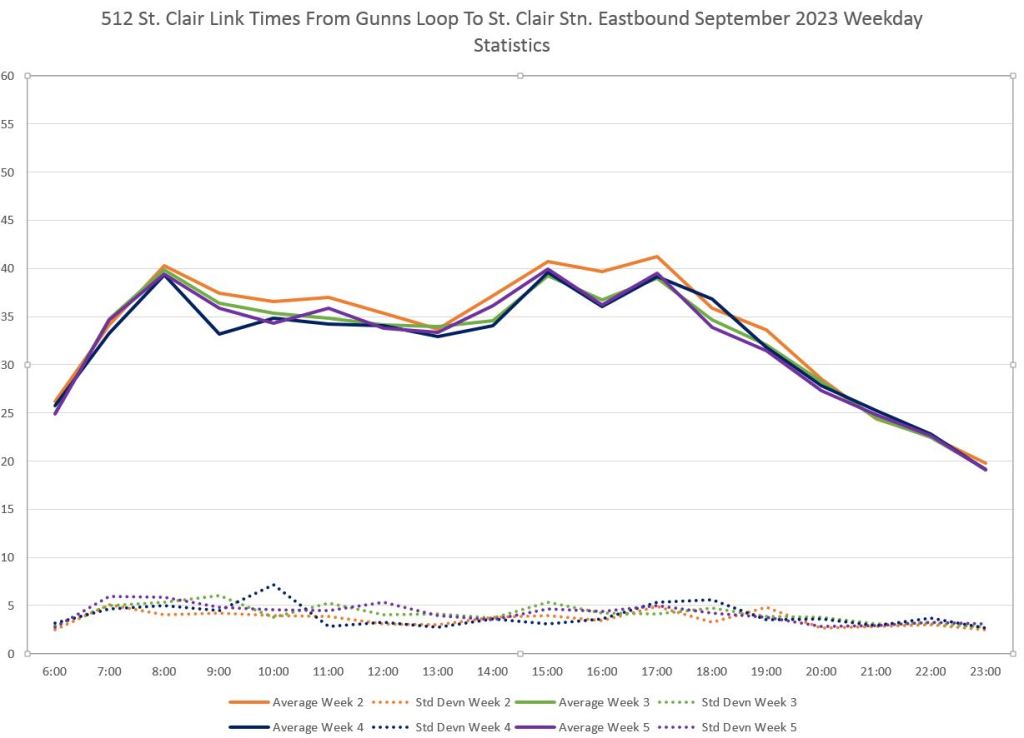
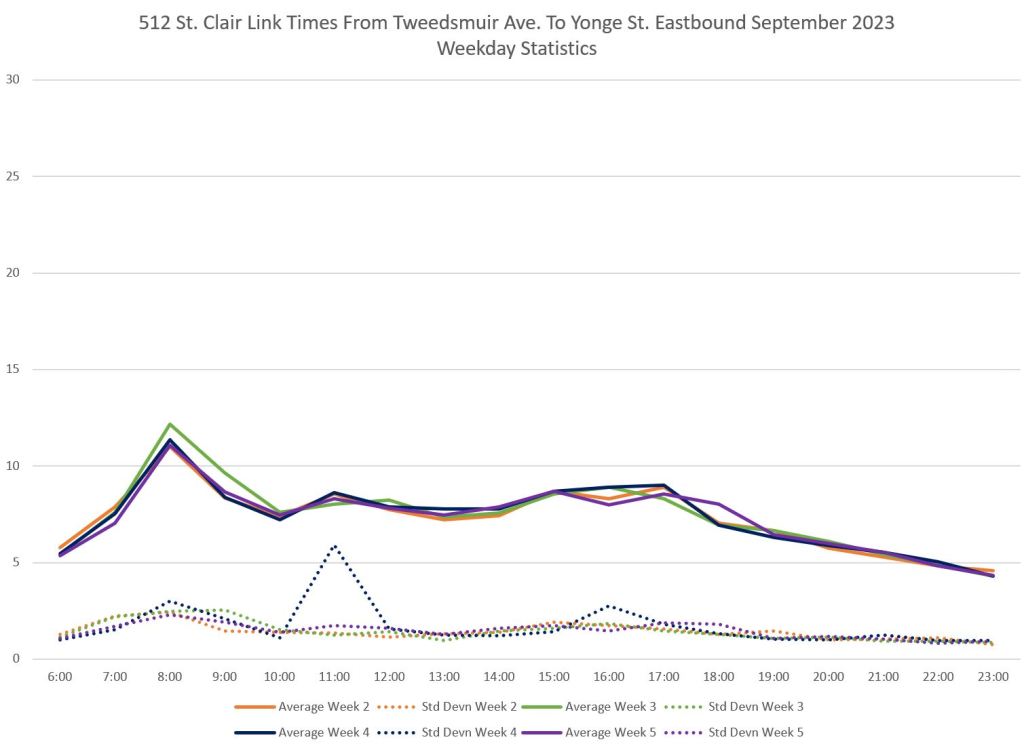
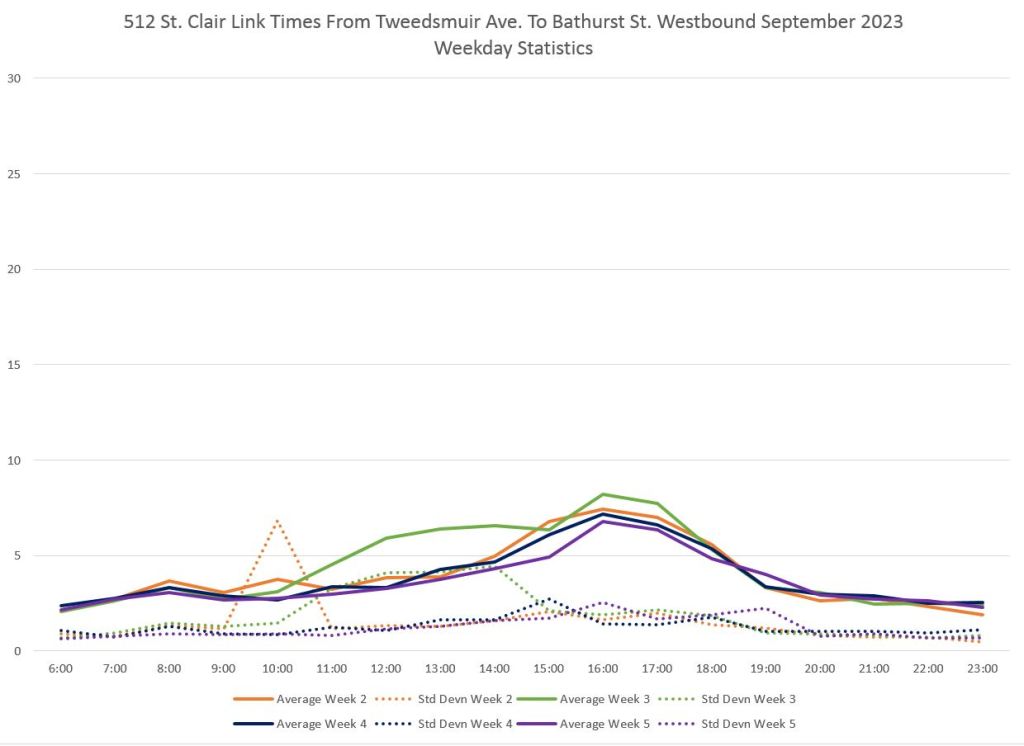
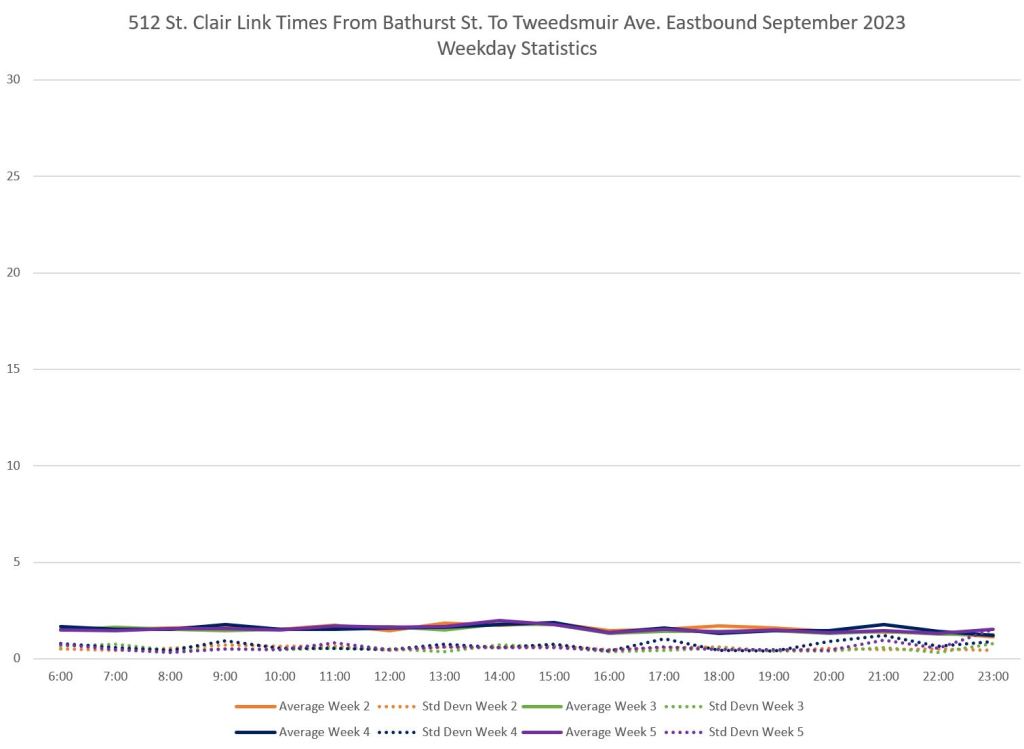
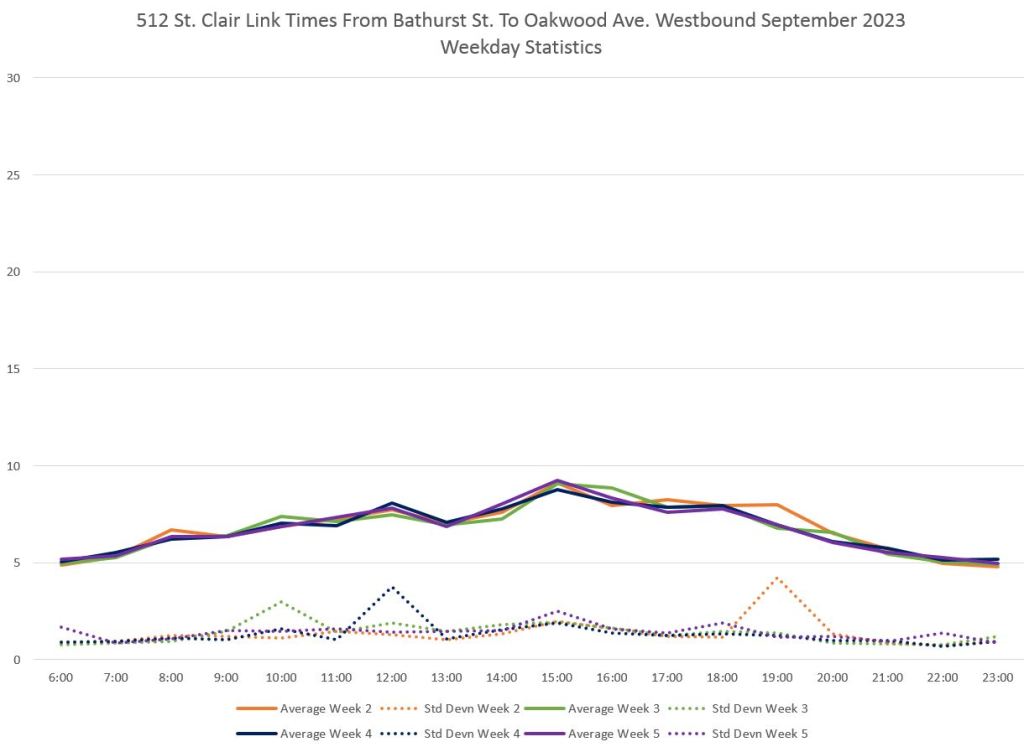
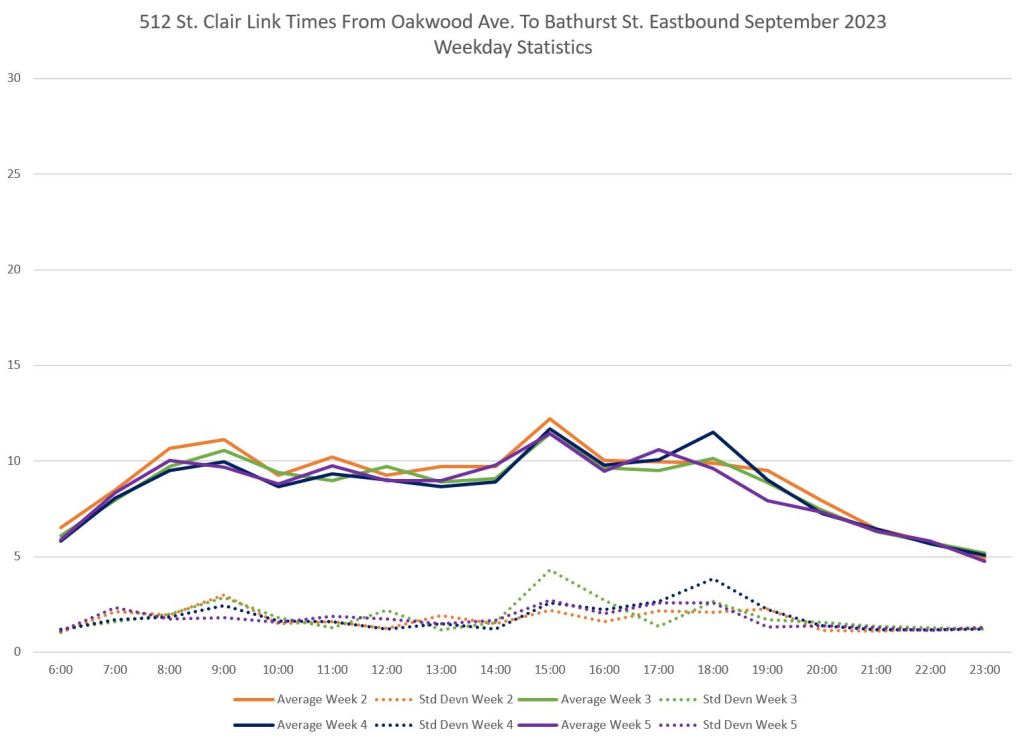
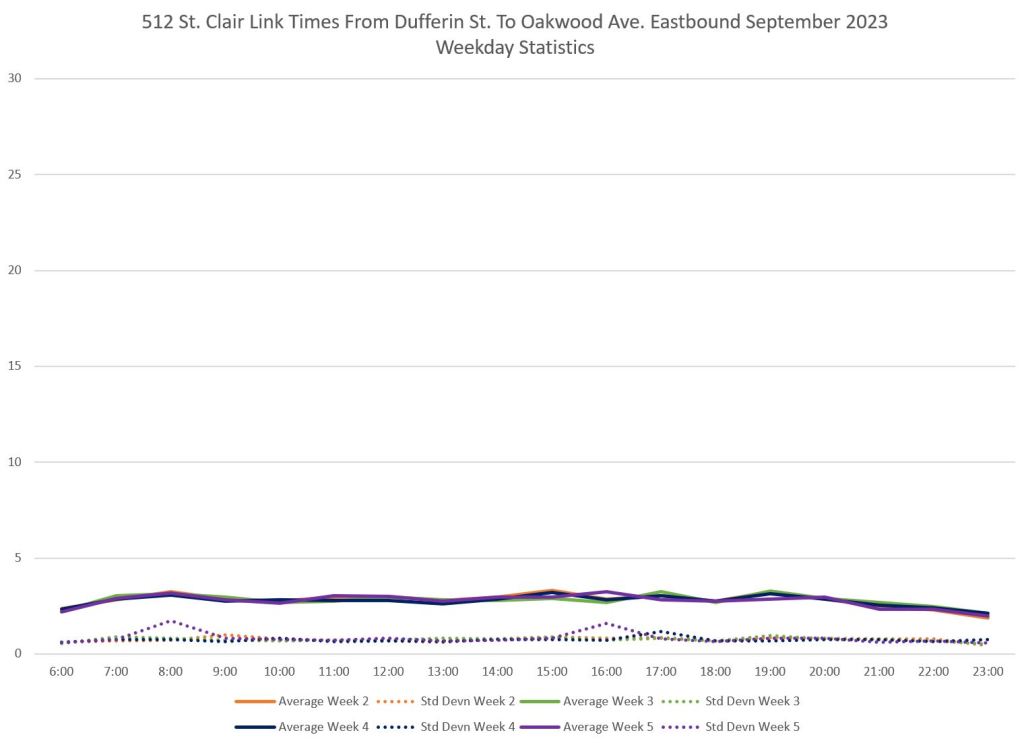
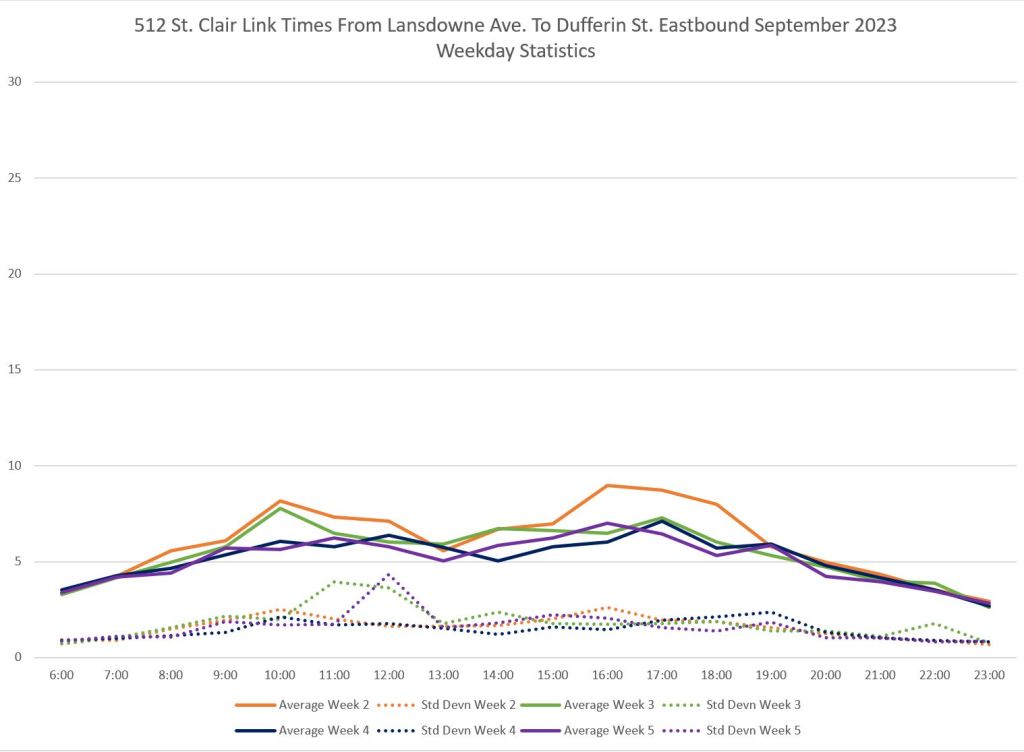
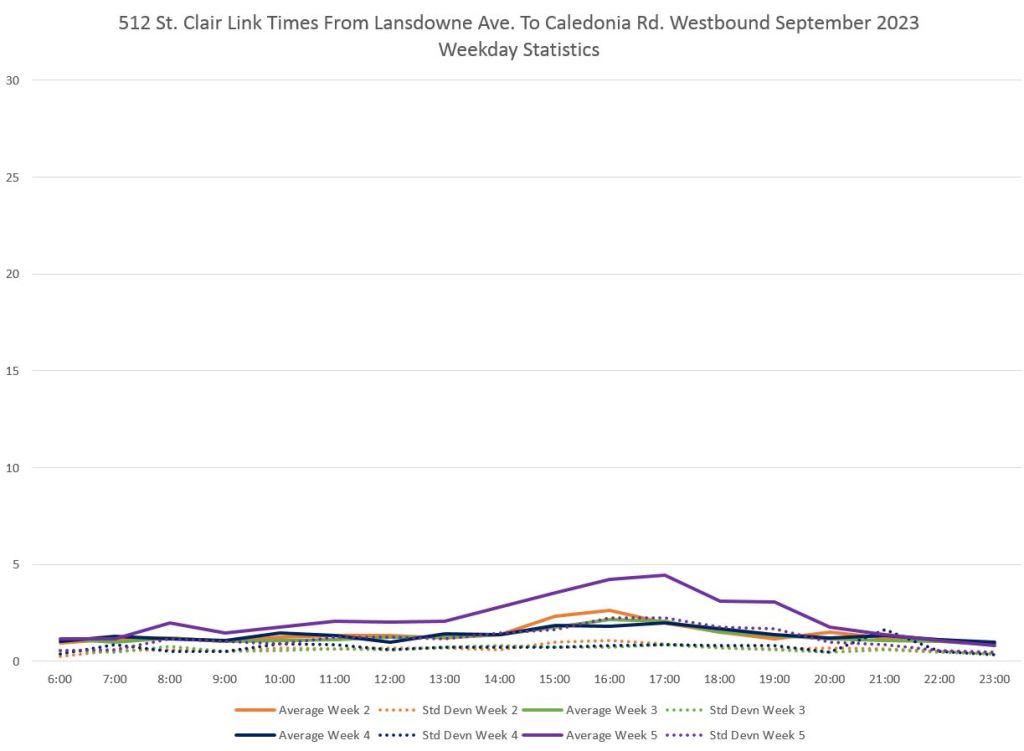
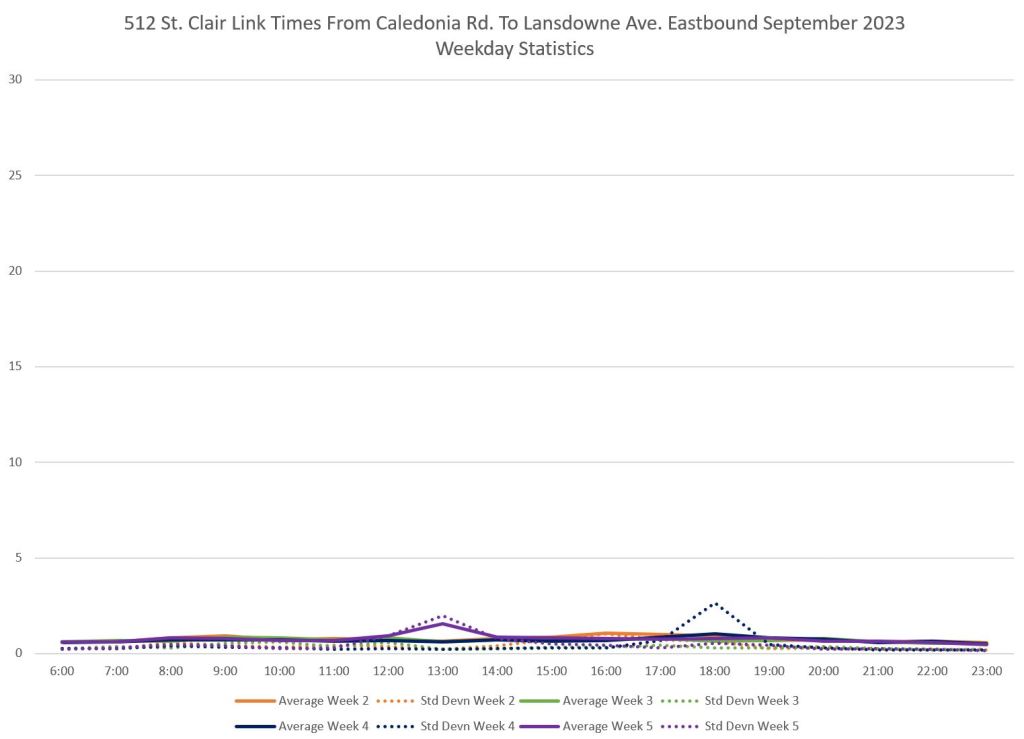
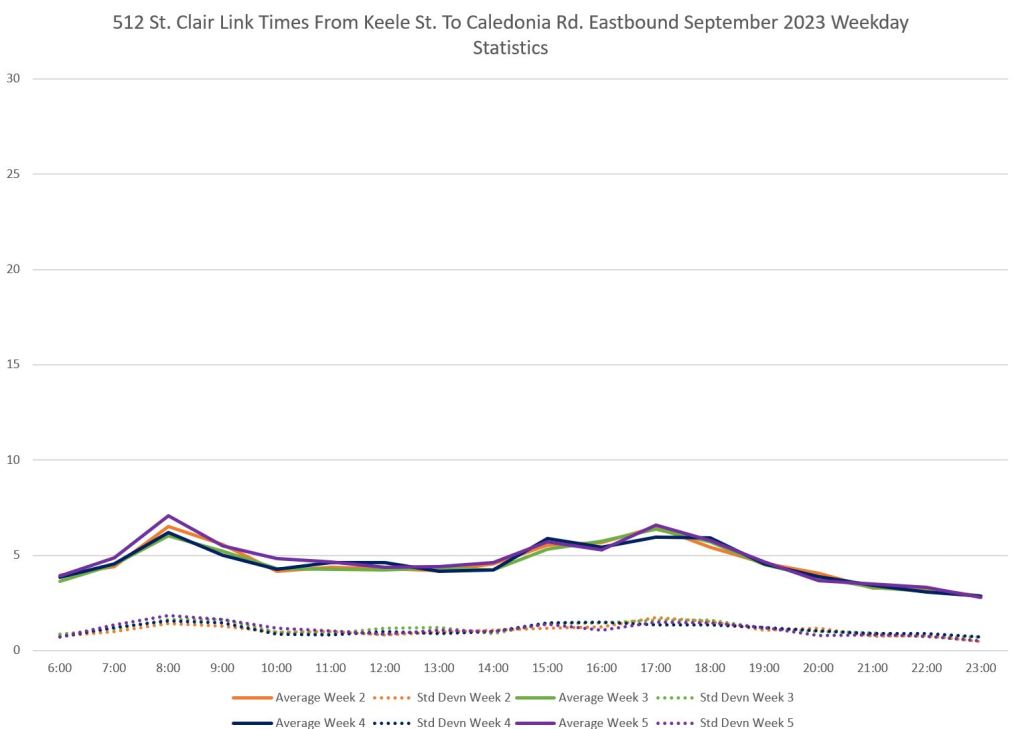
The end-to-end travel times for streetcars and buses vary as shown on charts below. These plot the week-by-week averages in travel over the route for the months of April, August and September. In the charts, the solid lines are the average values for each hour of the day, and the dotted lines are the standard deviations, a measure of the degree to which individual values are dispersed around the average. The lower the SD value, the more reliable the travel time is.
There is a very substantial change in September for the bus operation, with AM and PM peak values reflecting the primary direction of travel. I will review detailed breakdowns of these stats later, but these charts show the overall values. Note that the standard deviations in bus travel times are generally higher than the streetcar times indicating greater variation from trip to trip.
What they do not show is the variation in service frequency, another factor that affects how riders perceive service. Buses or streetcars should arrive regularly, reliably and with capacity to handle demand. Total travel time can be severely affected, especially if the segment of a trip spent on one route is short, by extra time waiting for vehicles or from being unable to board.
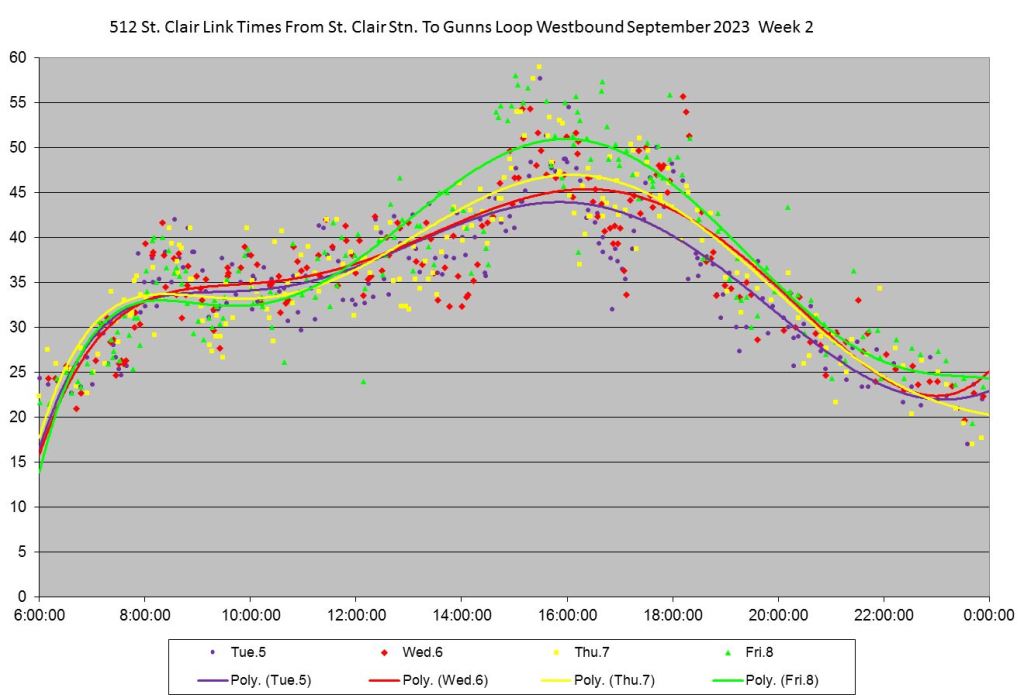
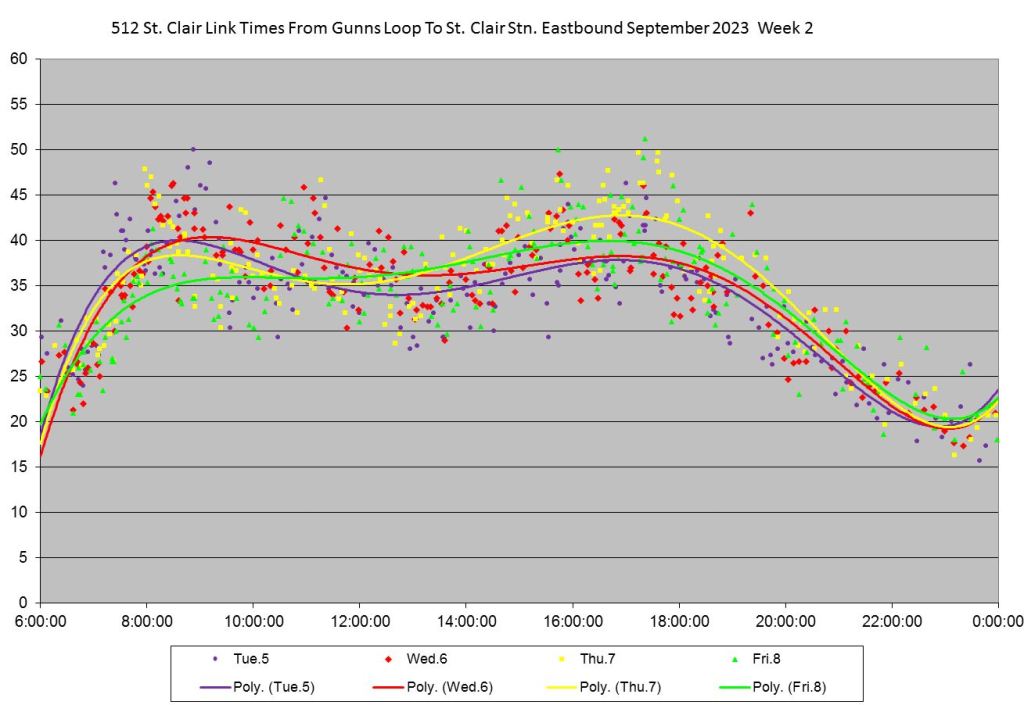
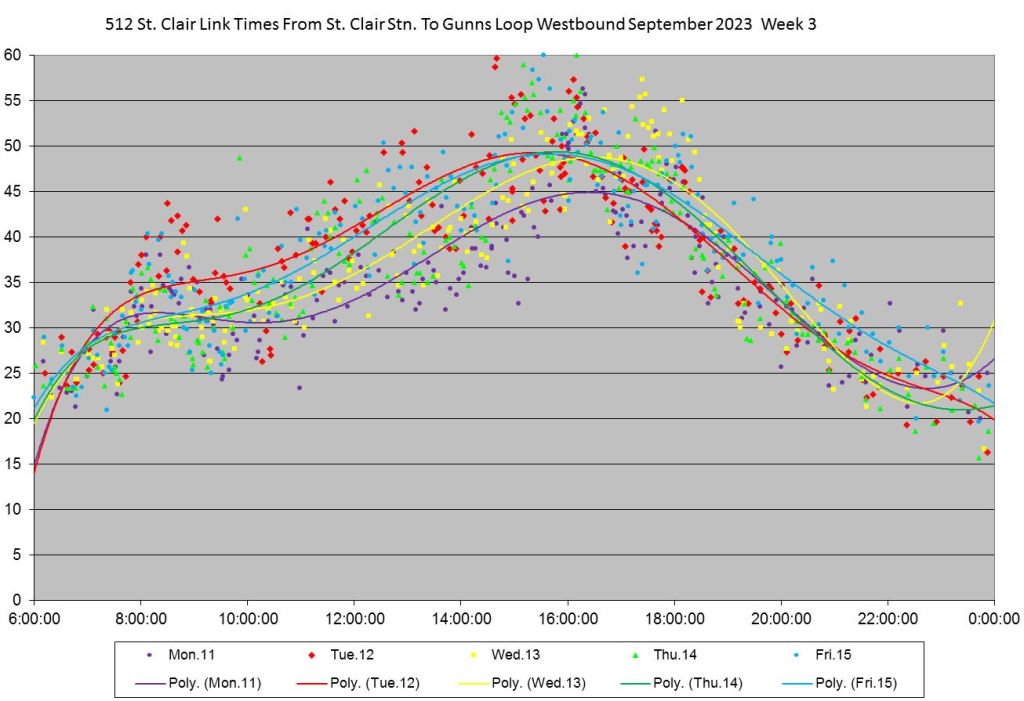
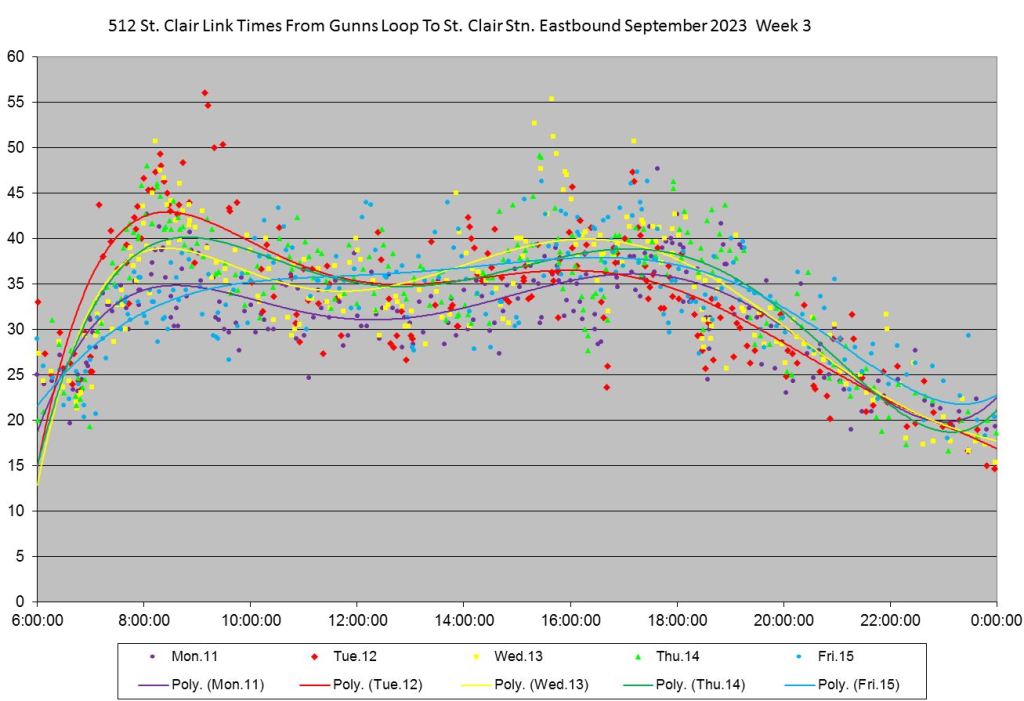
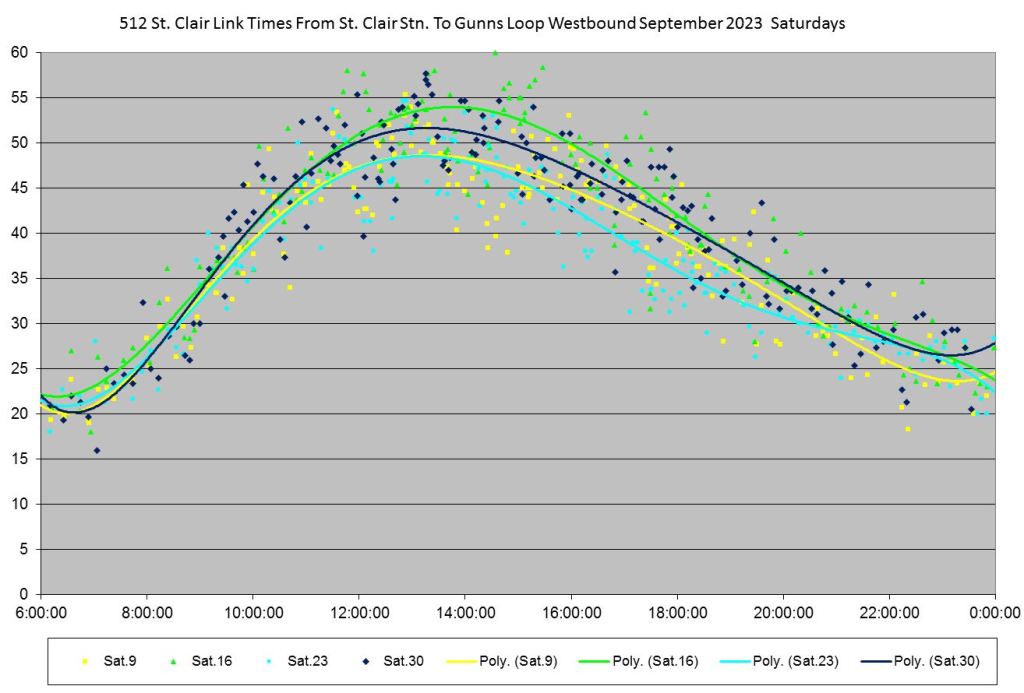
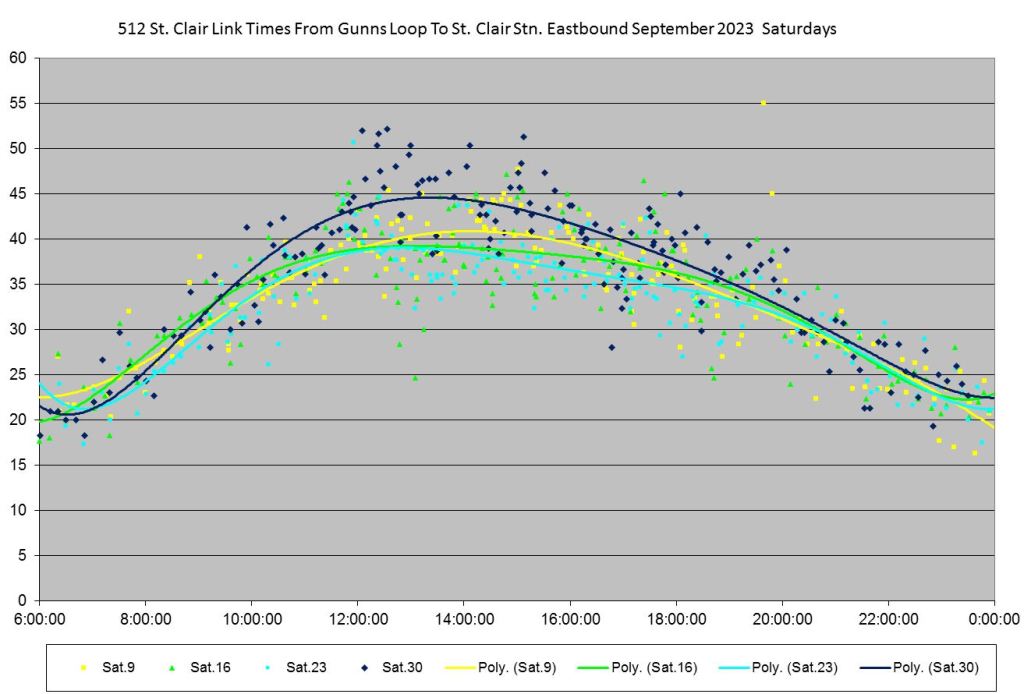
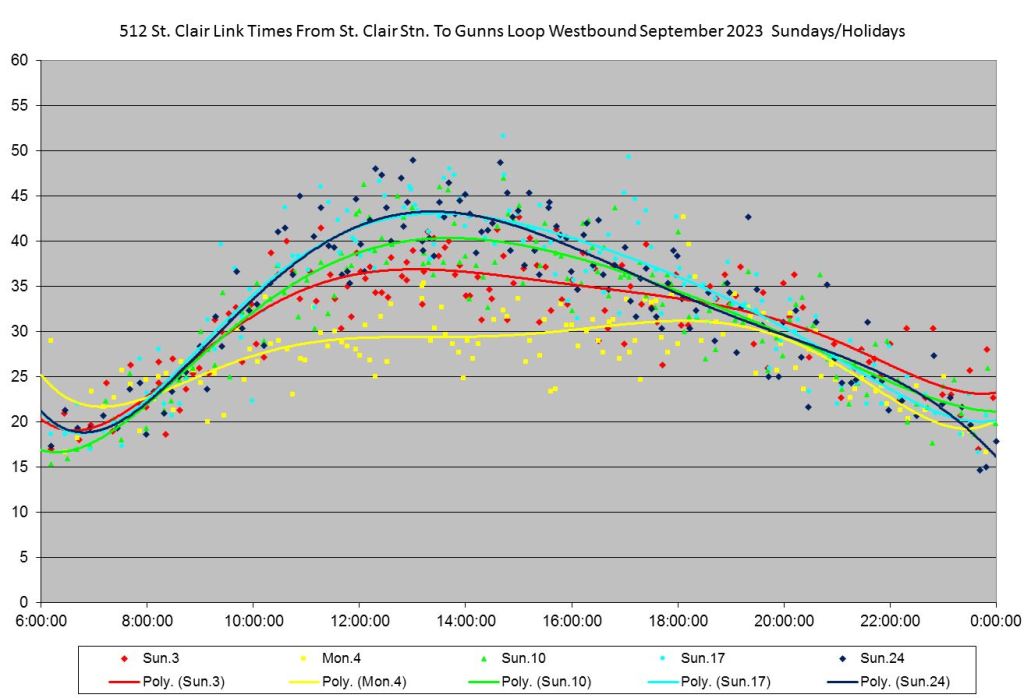
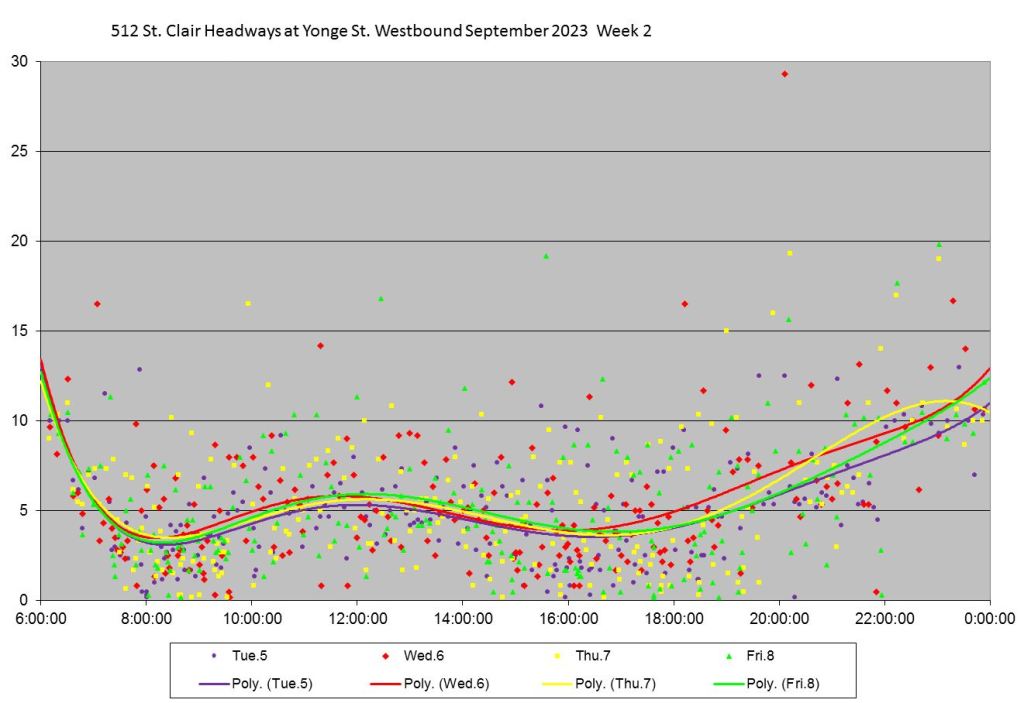
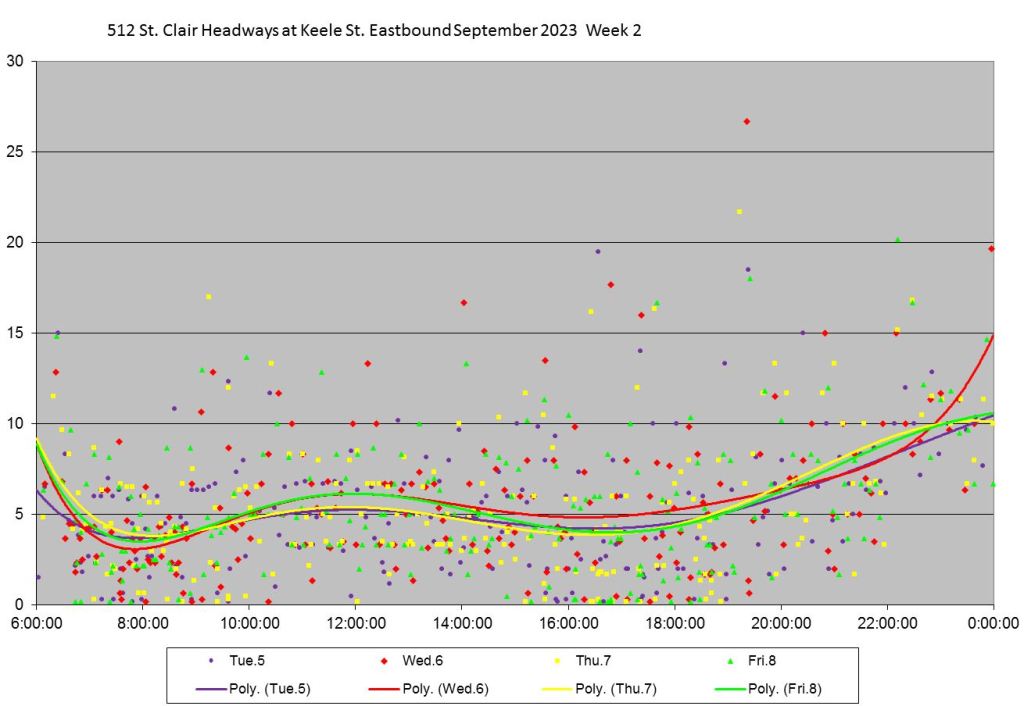
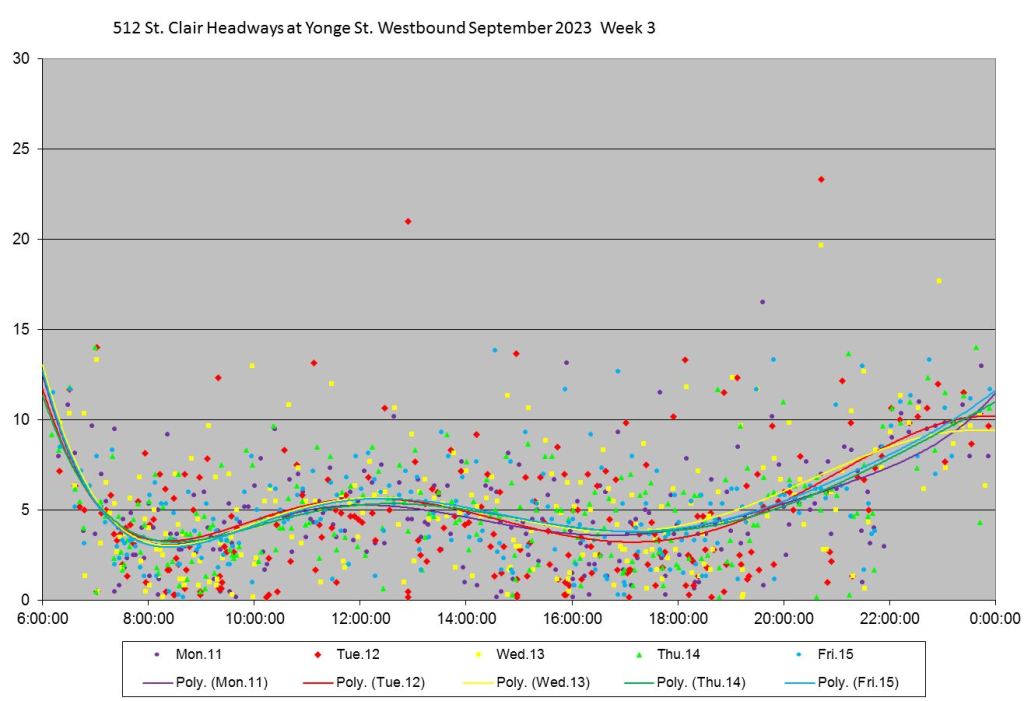
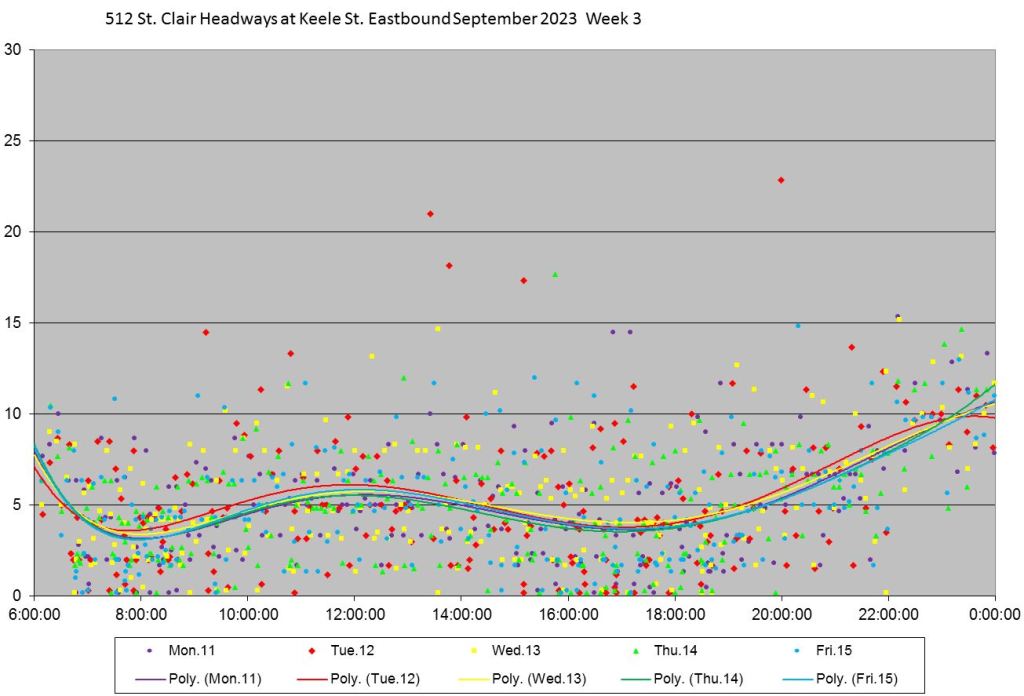
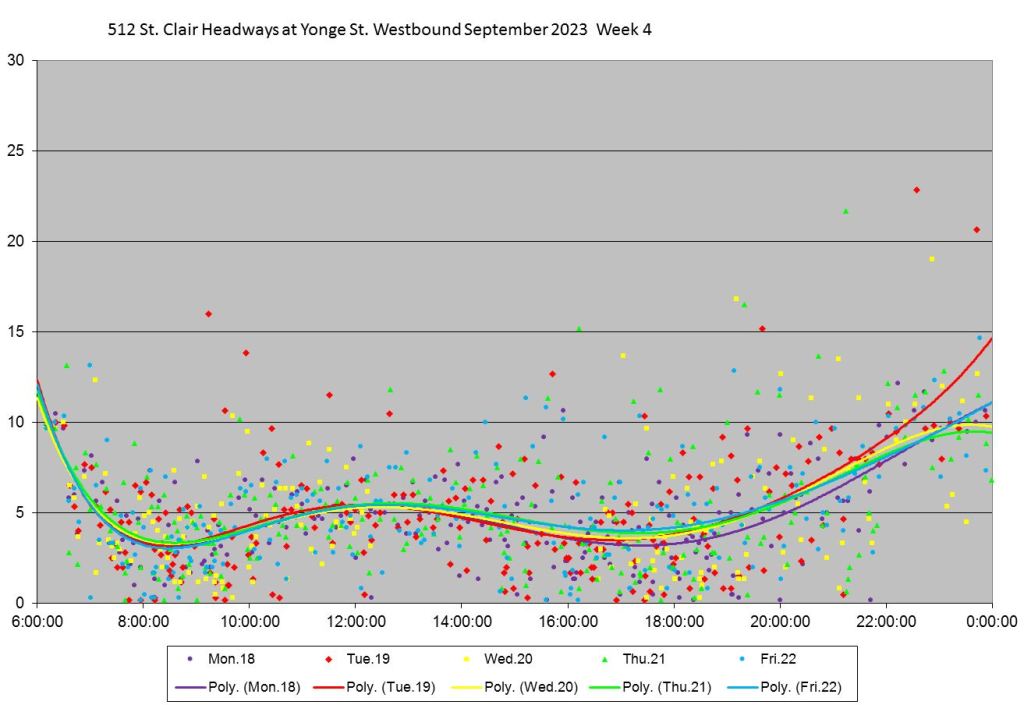
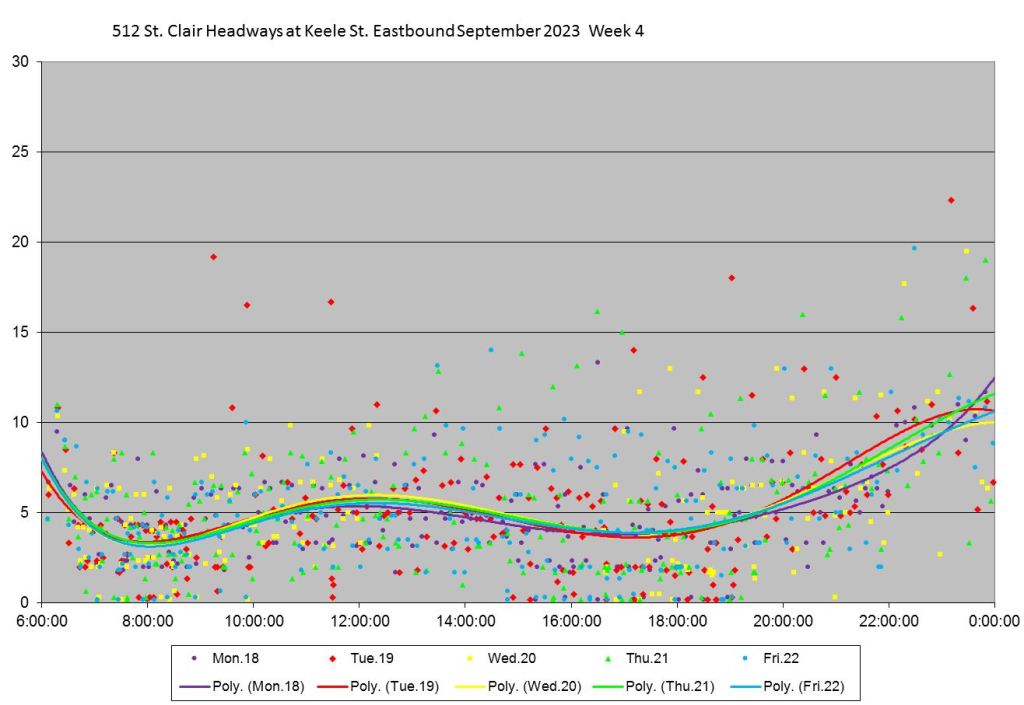
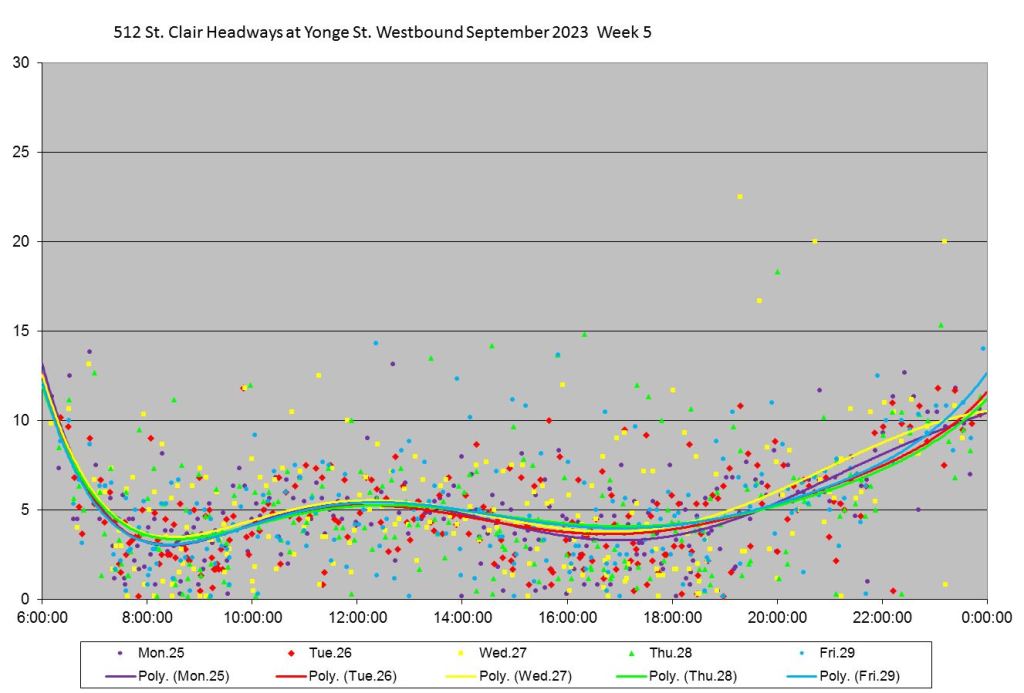
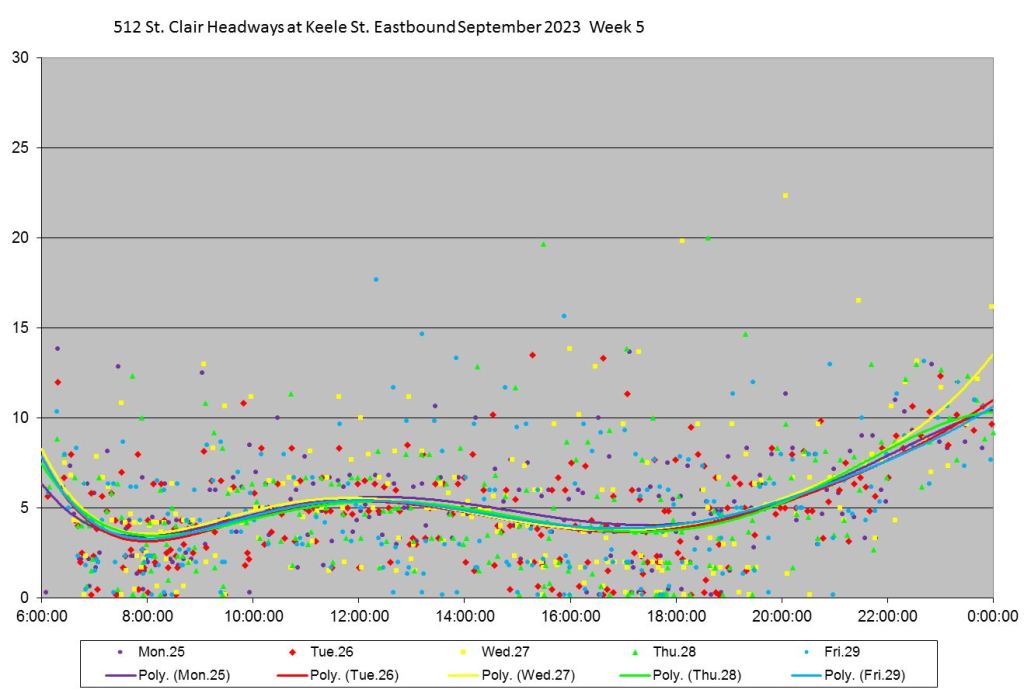
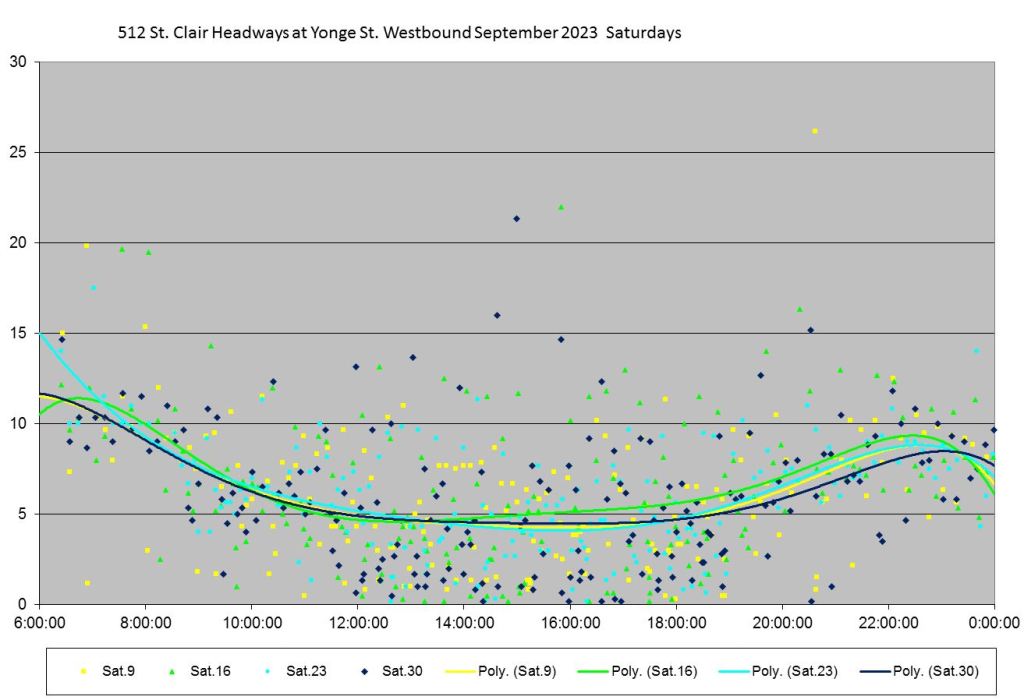
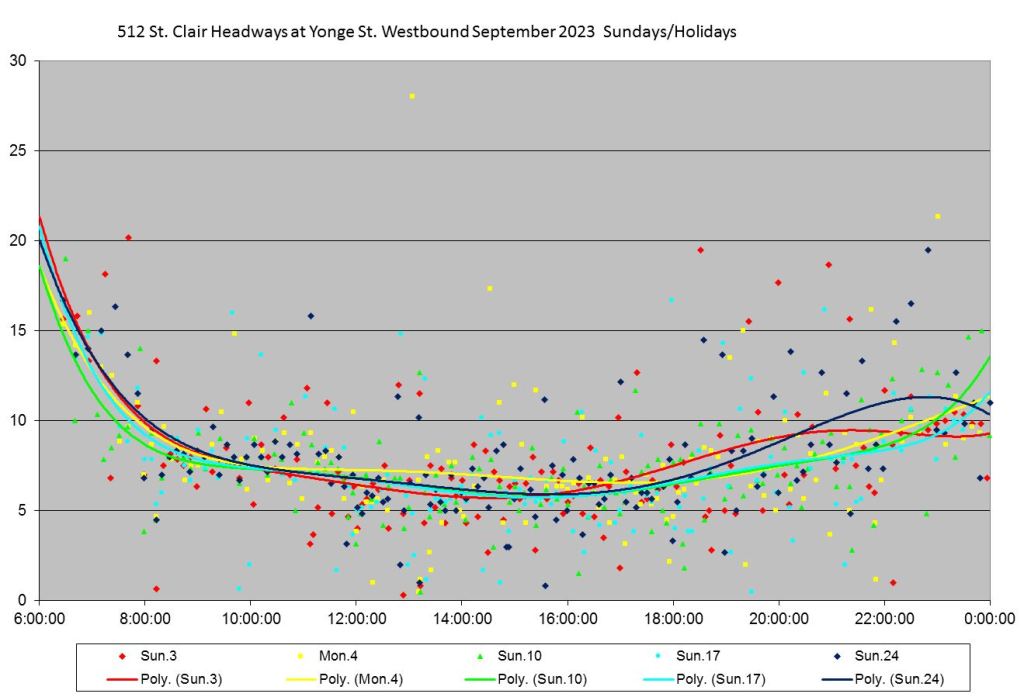
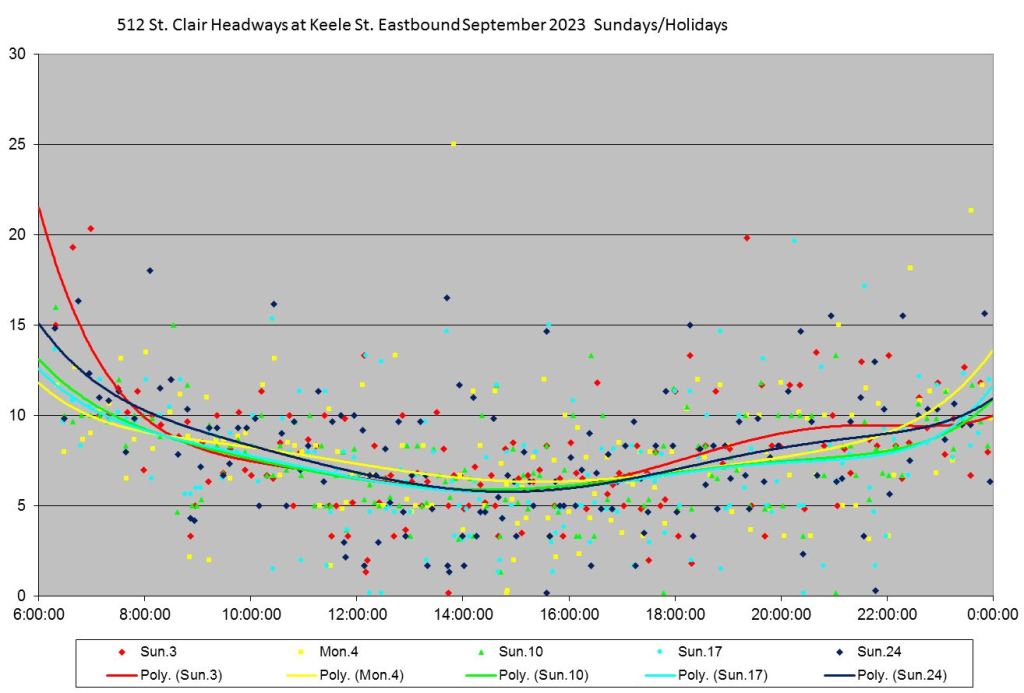
Within September, bus travel times varied a lot. Here are numbers for each direction broken down by week and with separate charts for Saturday and Sunday service. Each dot represents one trip with the colour indicating the day. The solid lines show the overall trends of the data interpolated among each day’s values.
Mondays tend to lie below the data for other days in keeping withe the general observation of the short work week under work-from-home conditions, and hence less road traffic competing with the buses.
Week 1 is omitted here because it contains only Friday, September 1 when streetcars, not buses, were operating.
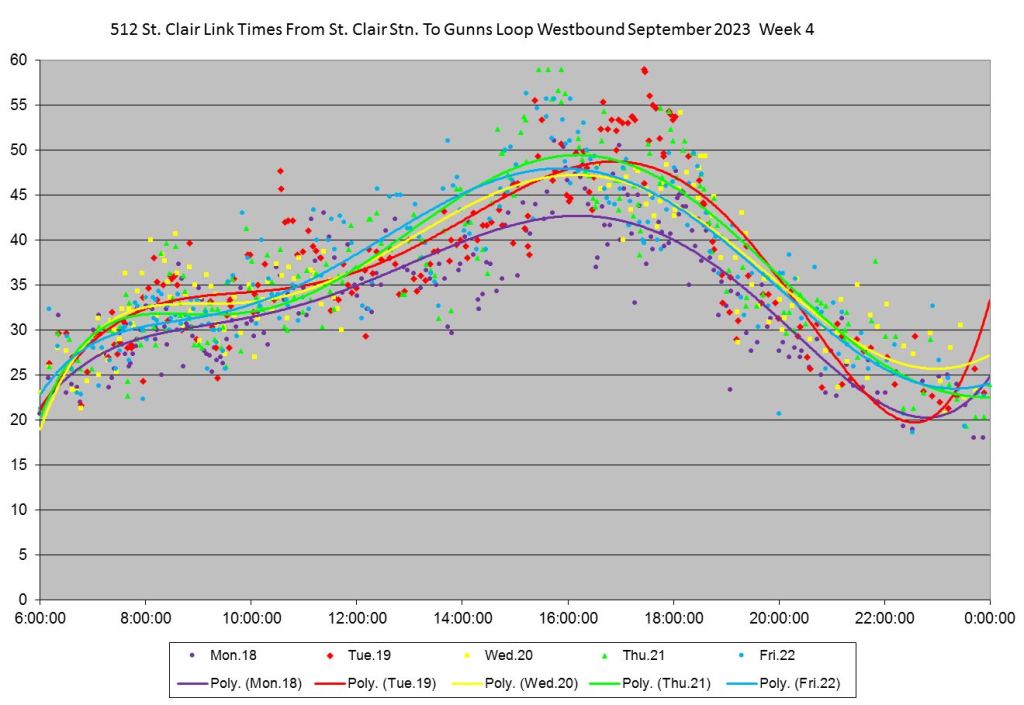
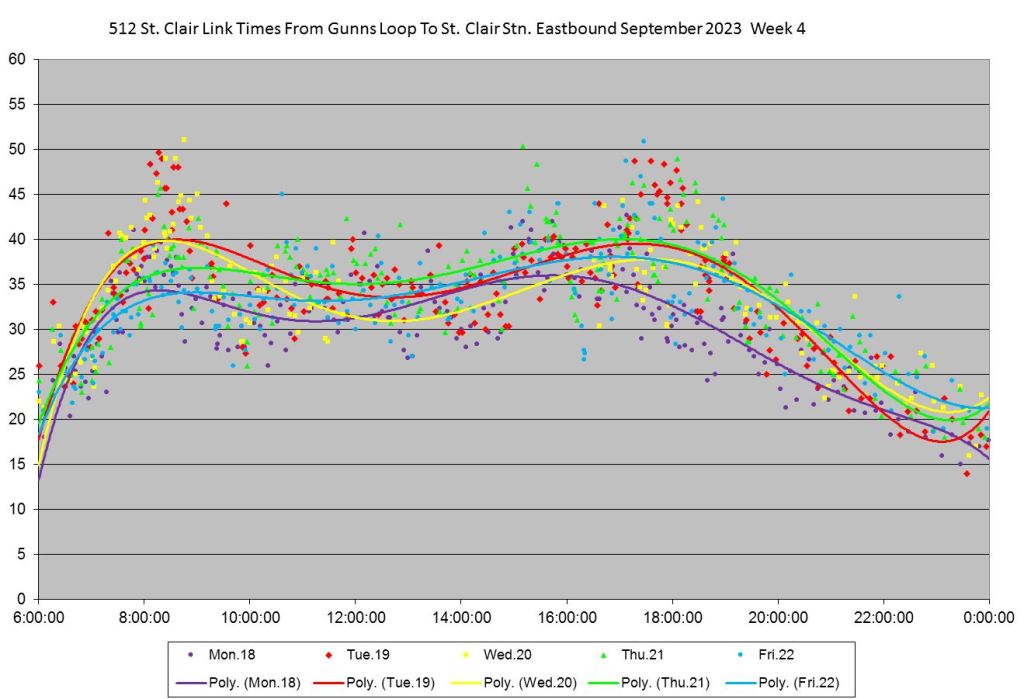
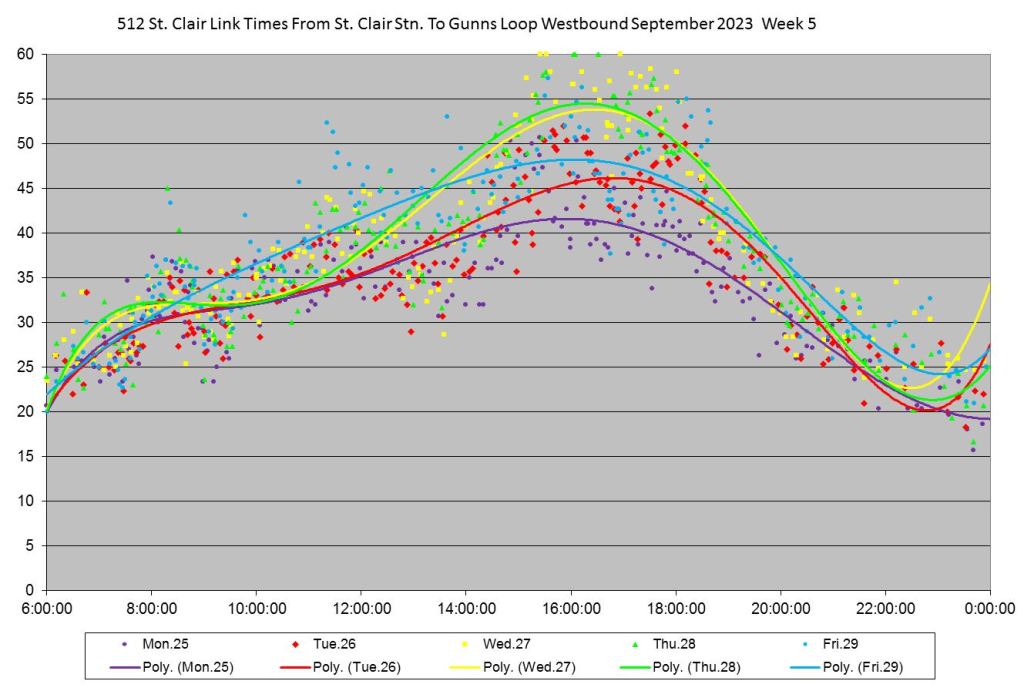
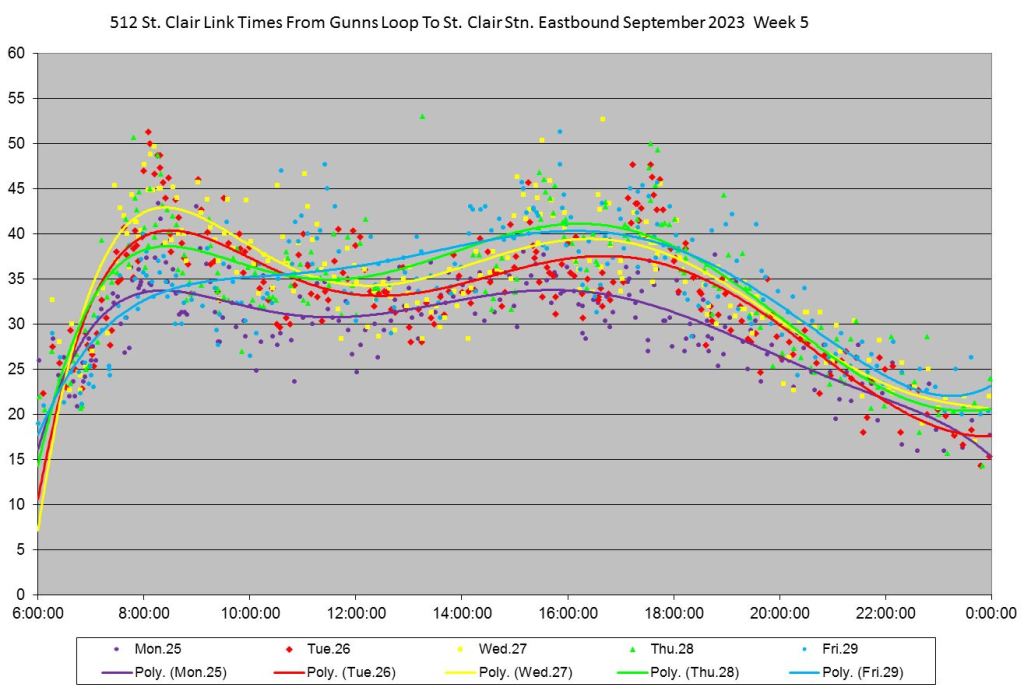

Another way to look at the data is by route segment. Here are charts of the travel times over each segment from Yonge to Keele showing how problems are concentrated in certain areas, times and directions.
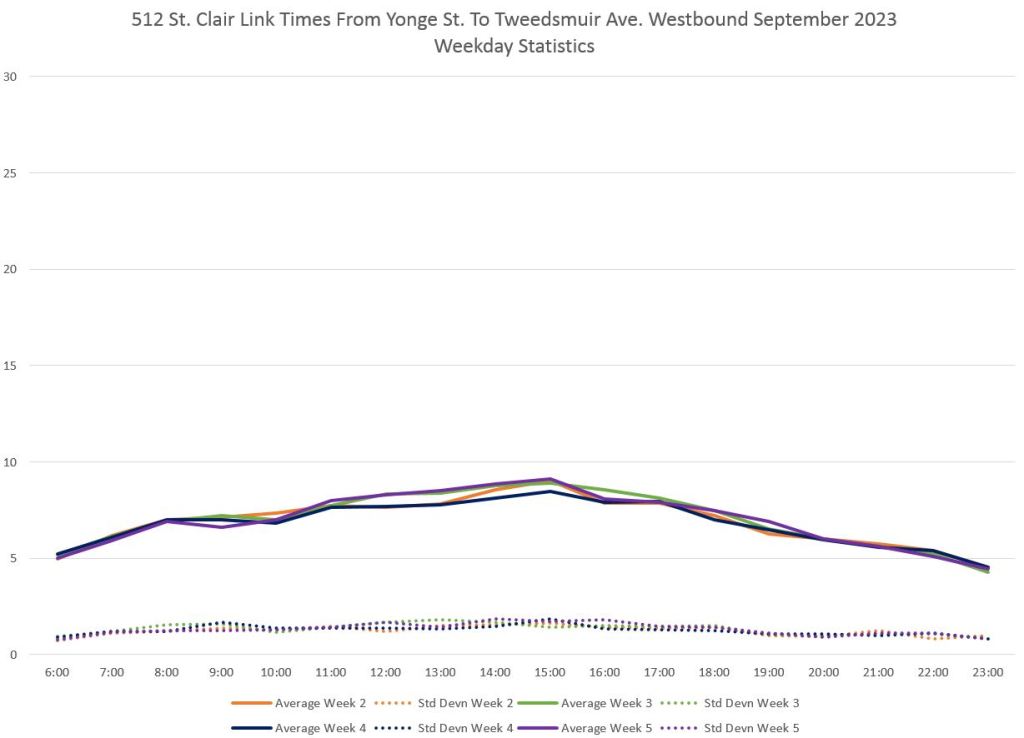
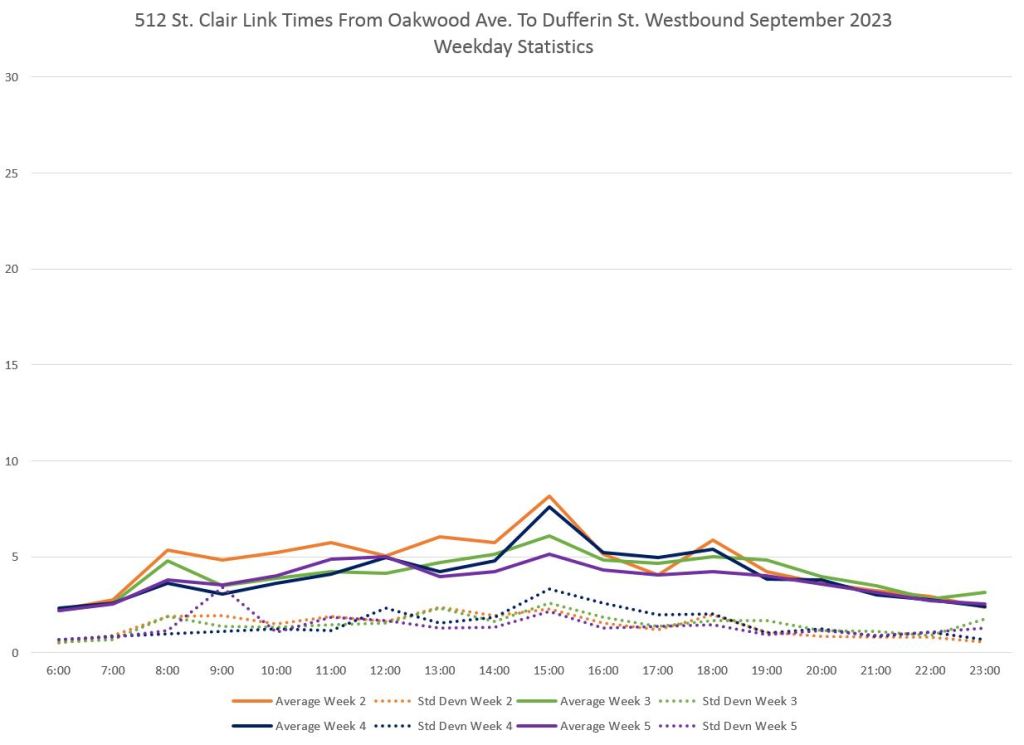

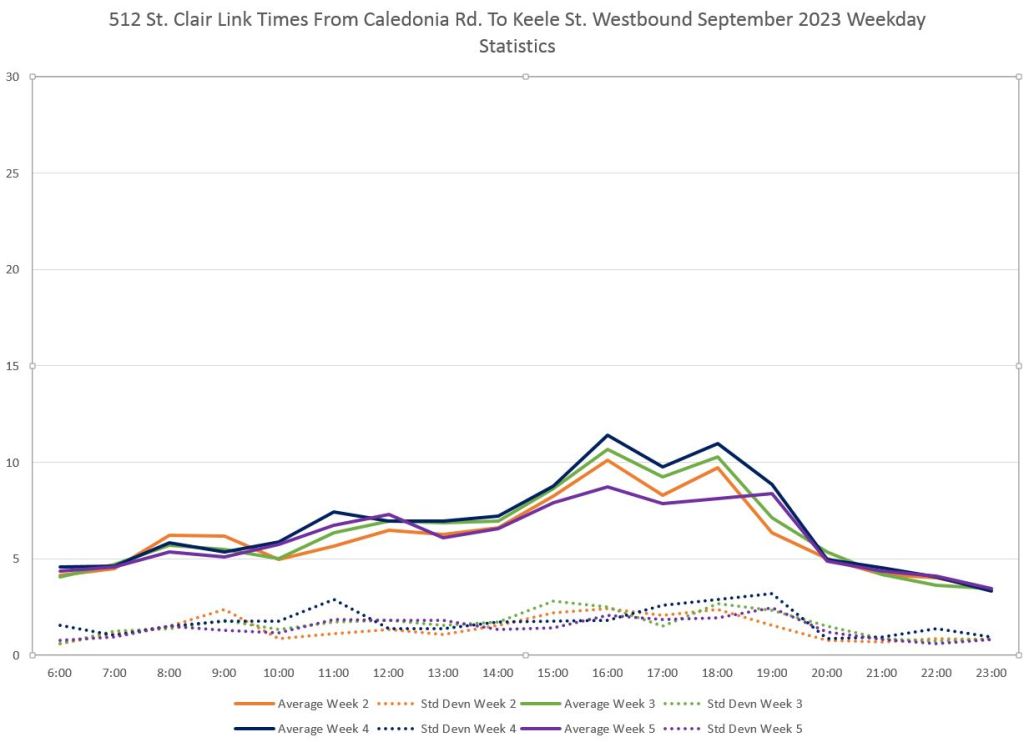
In the charts above, note how Week 5 for the area westbound from Dufferin stands out from other weeks showing how conditions can vary depending on other events taking place..
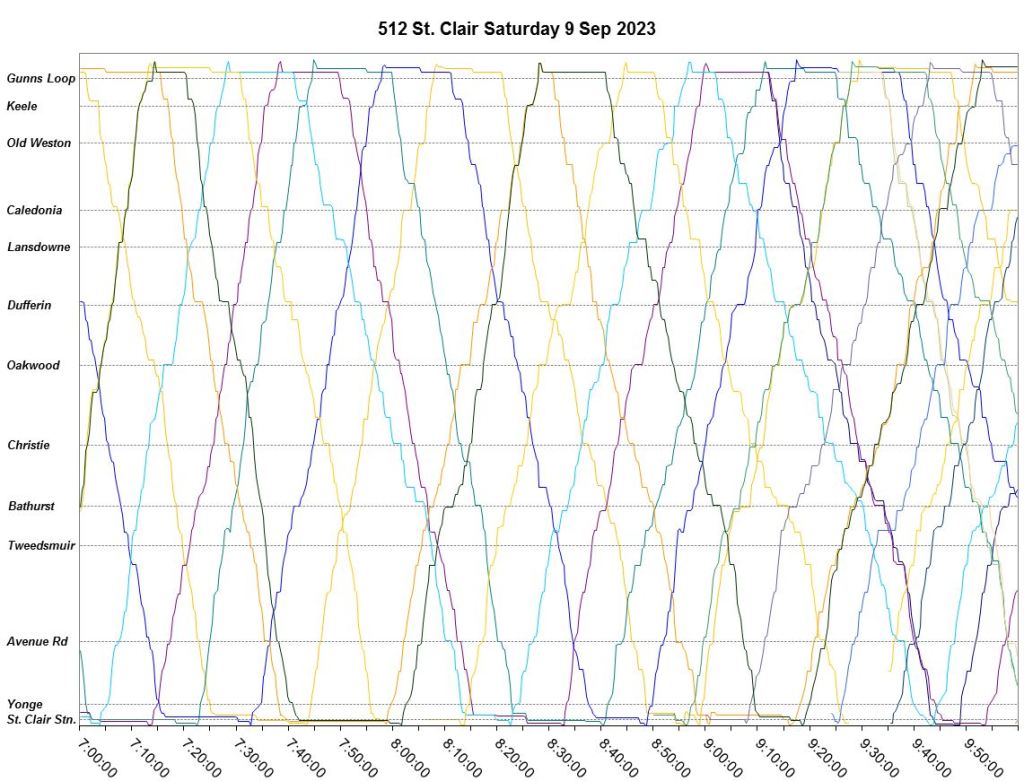
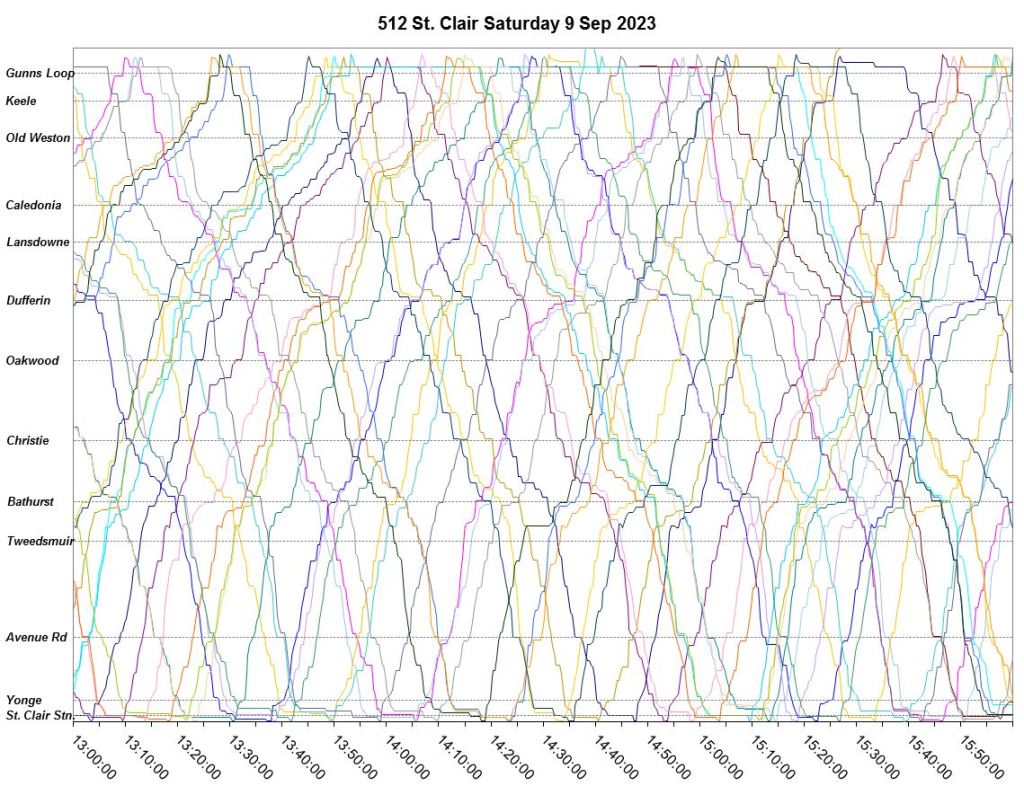
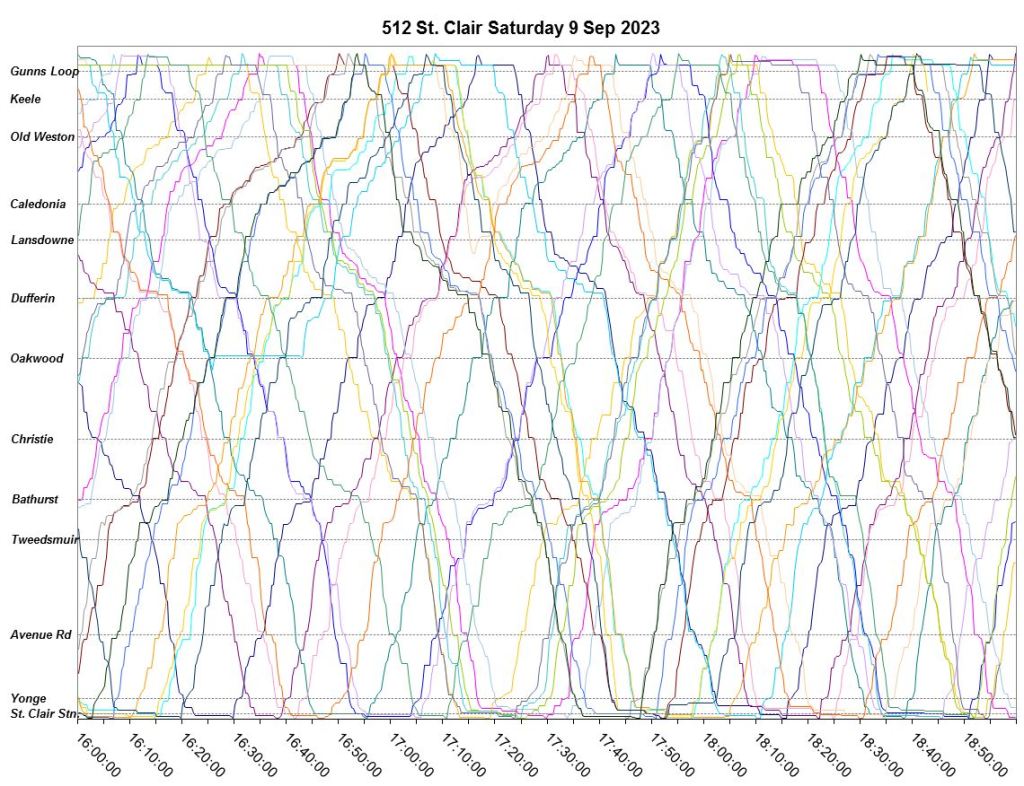
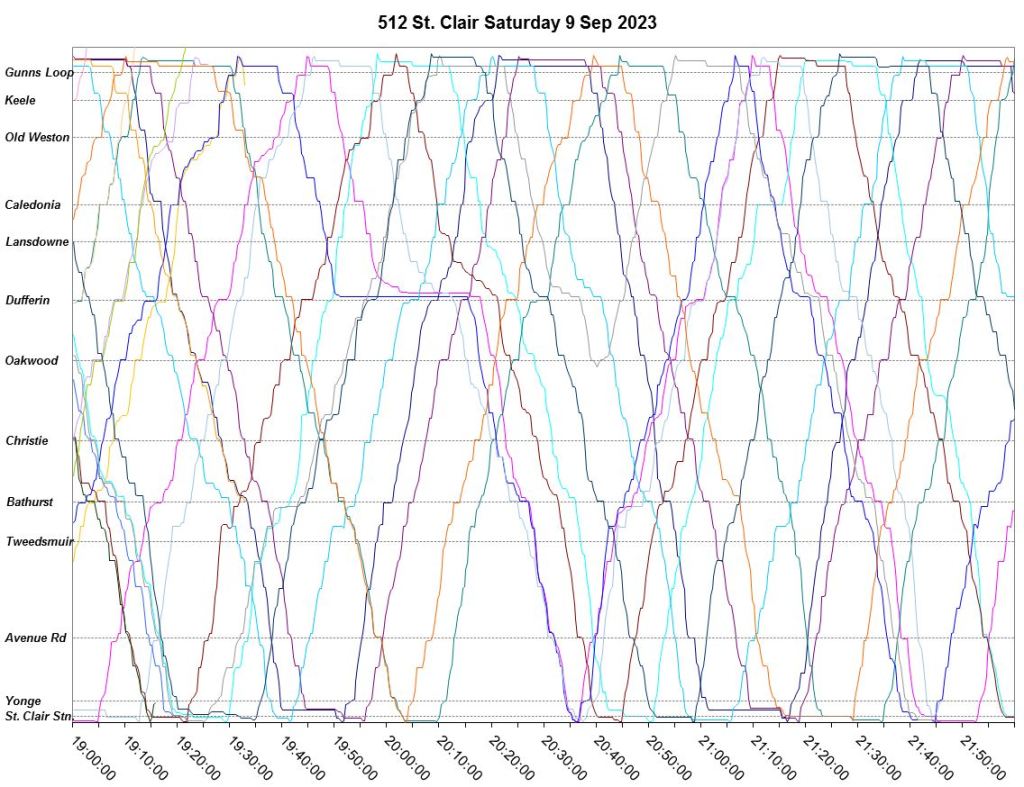
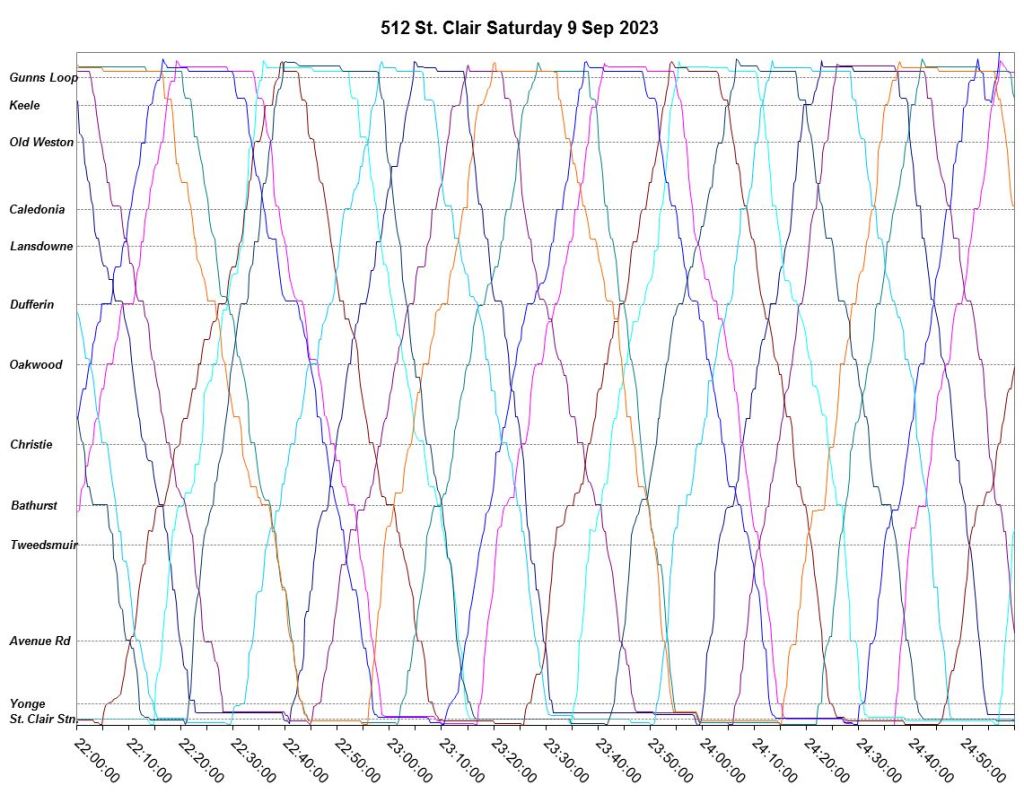
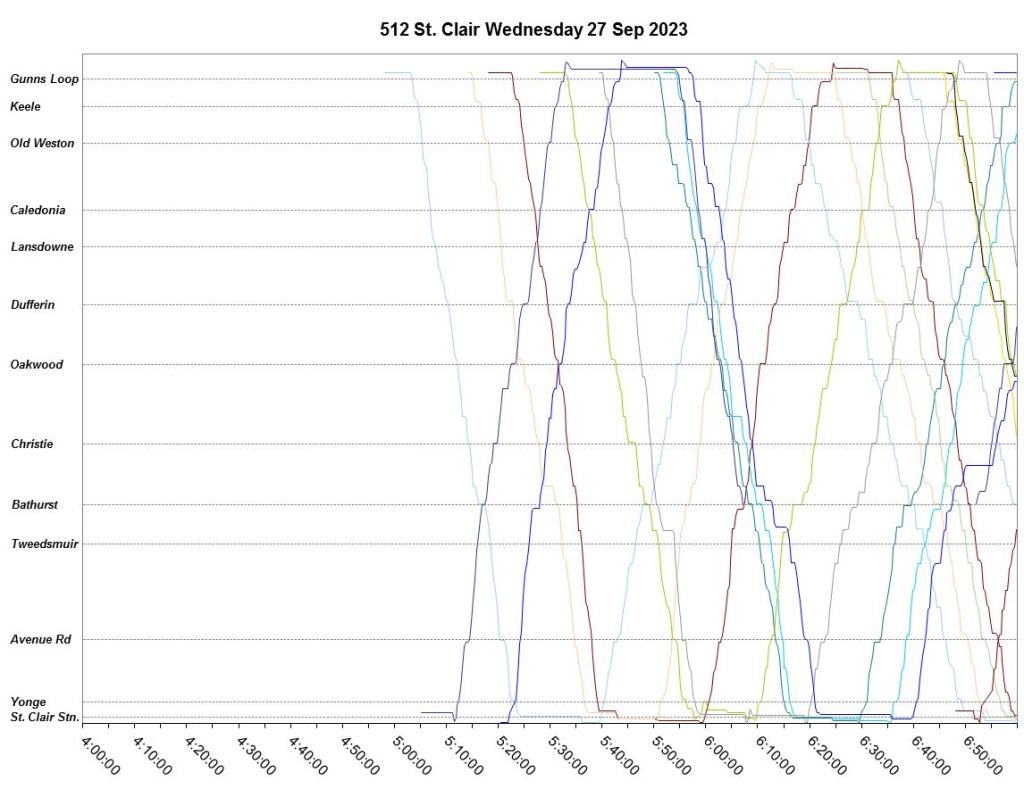
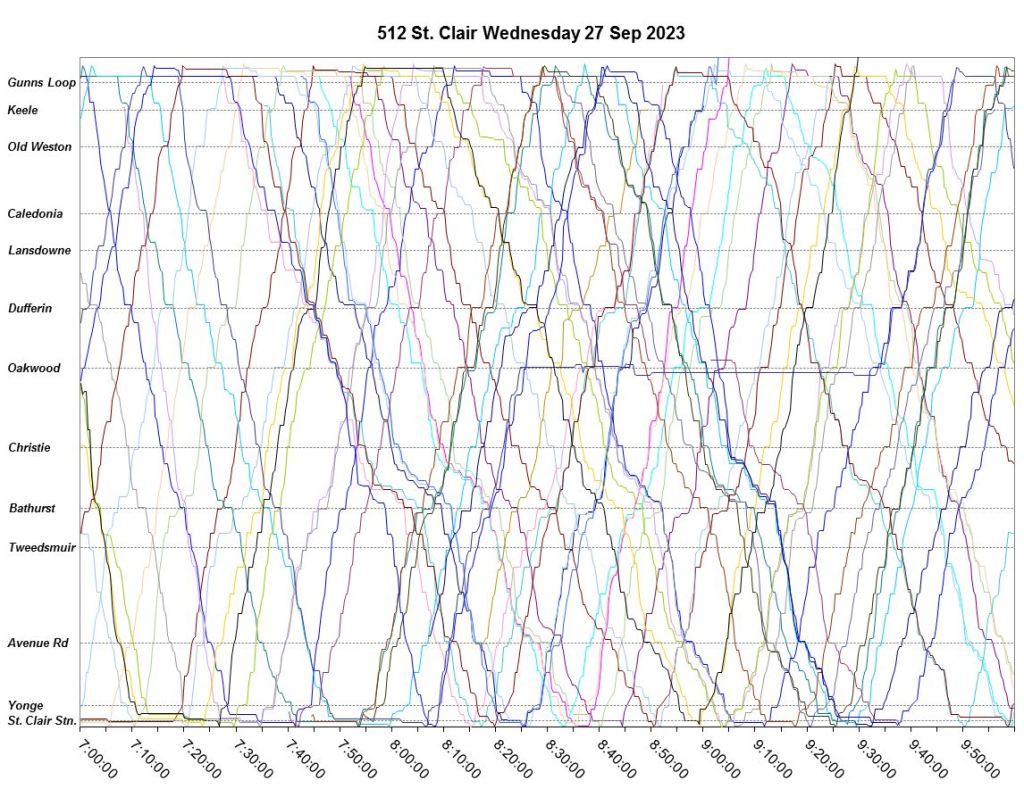
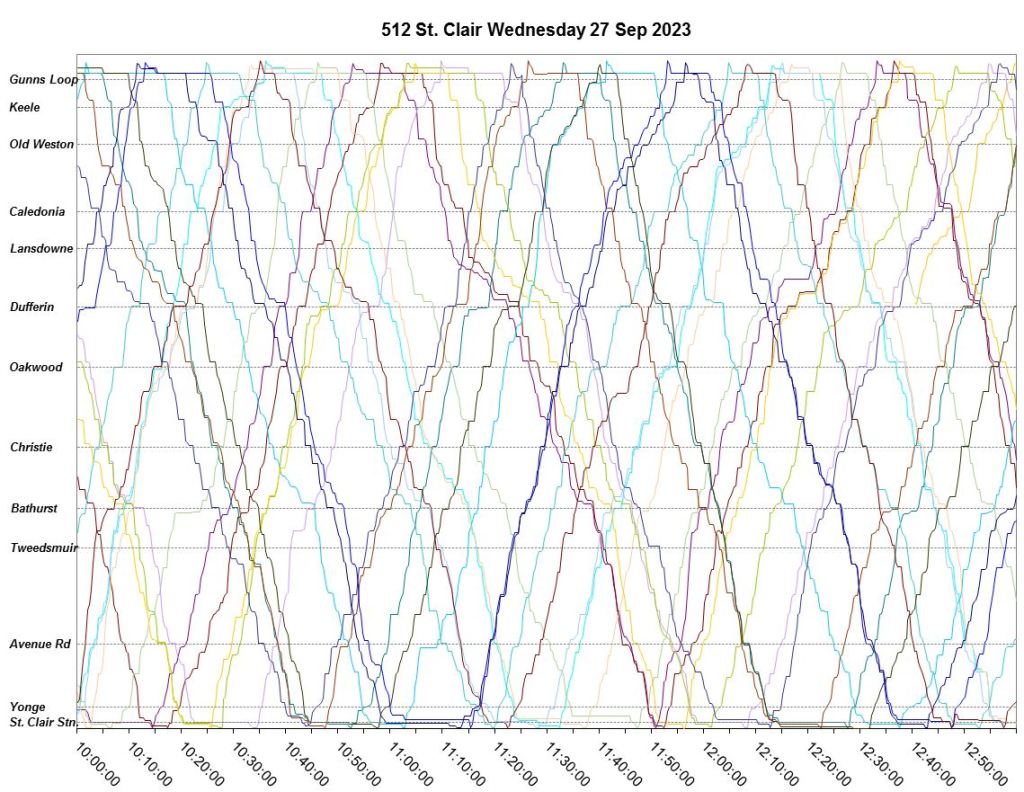
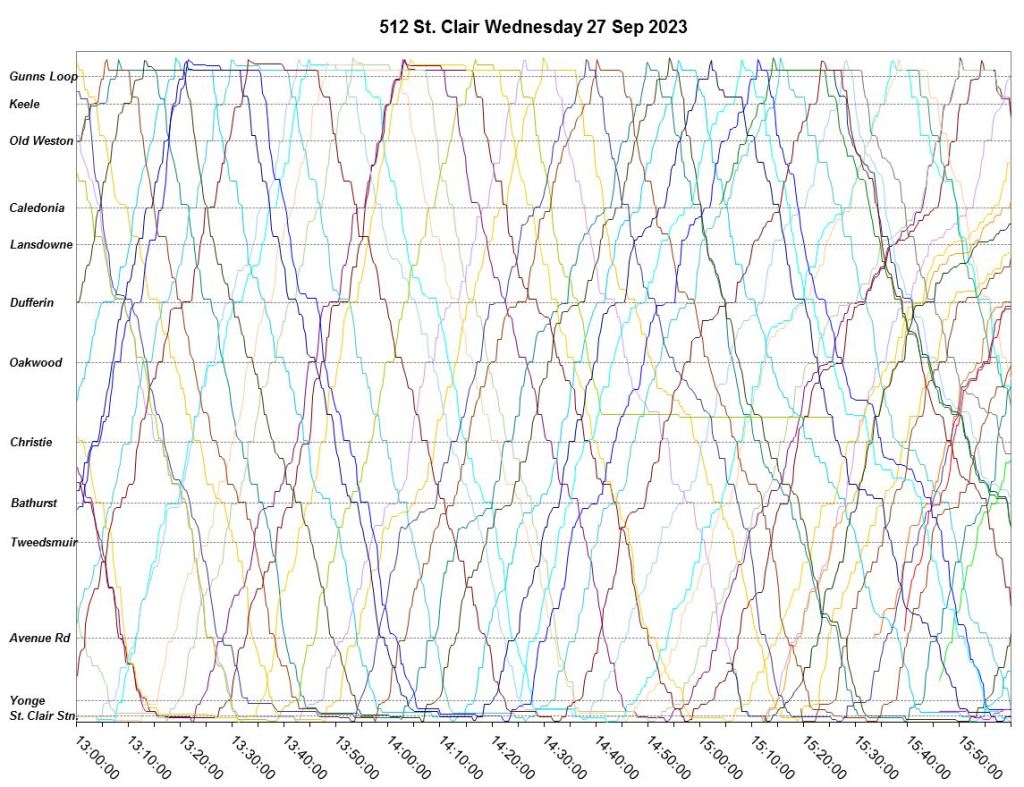
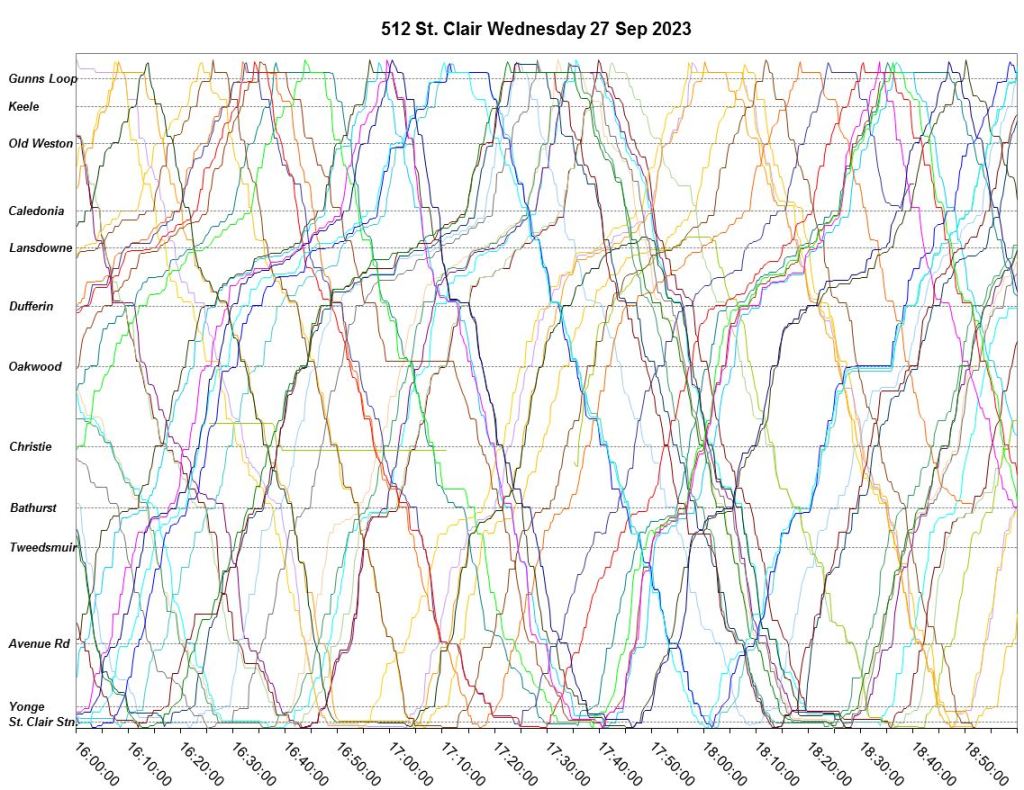
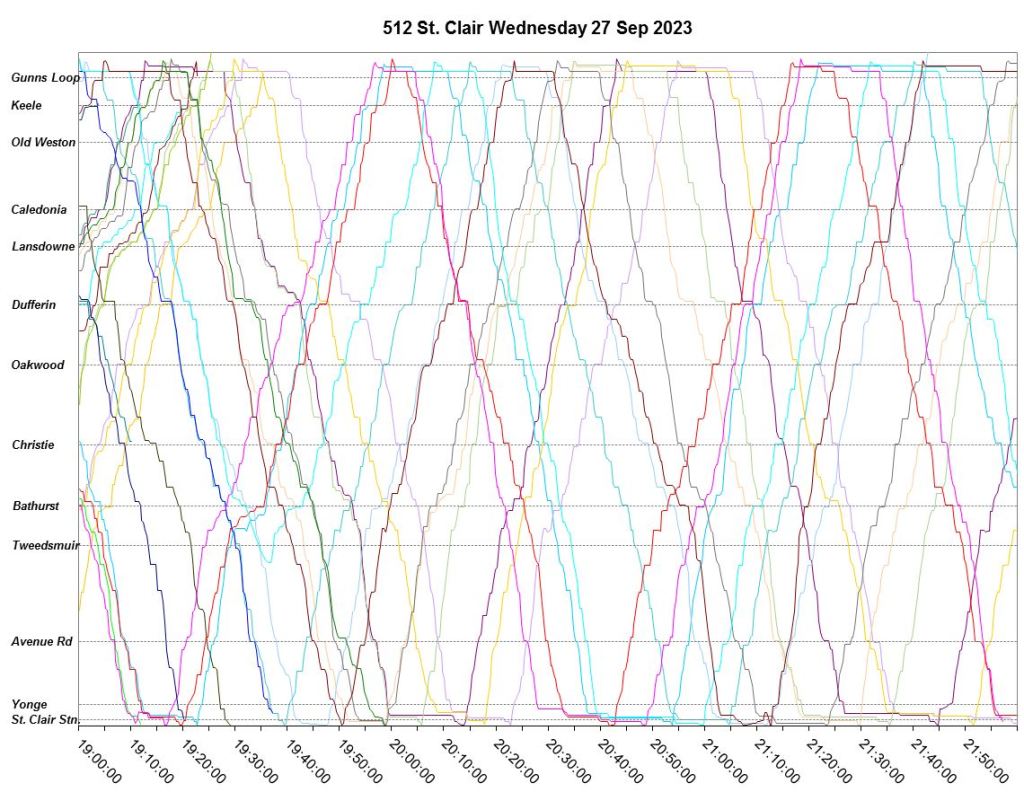
Service Charts
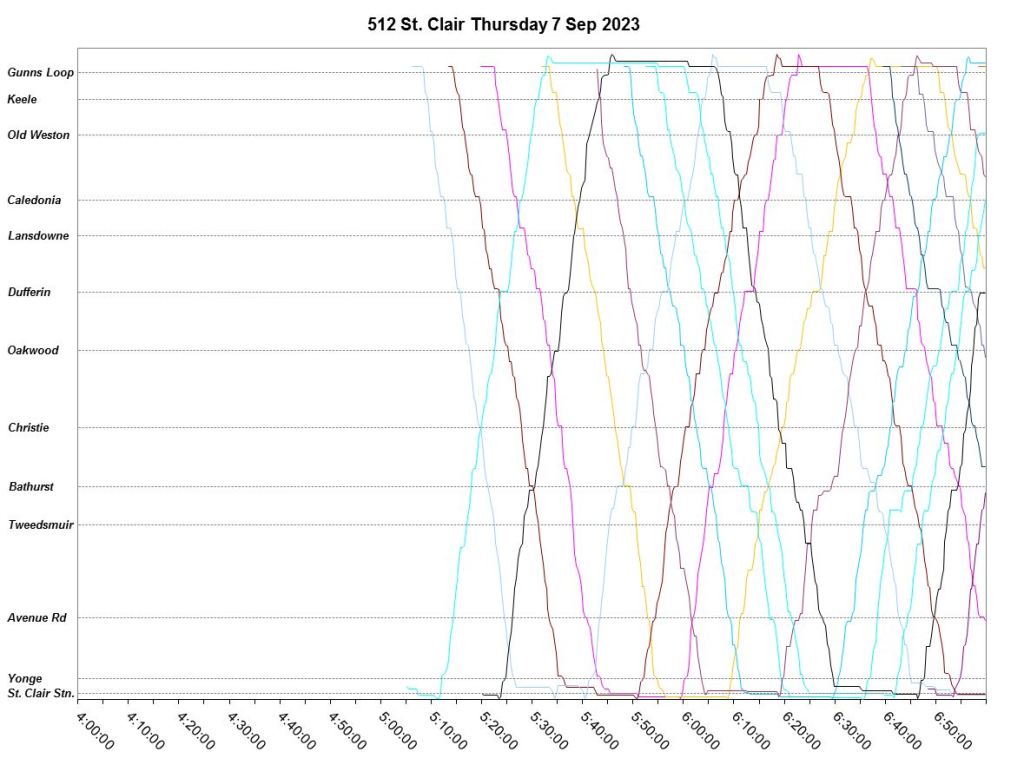
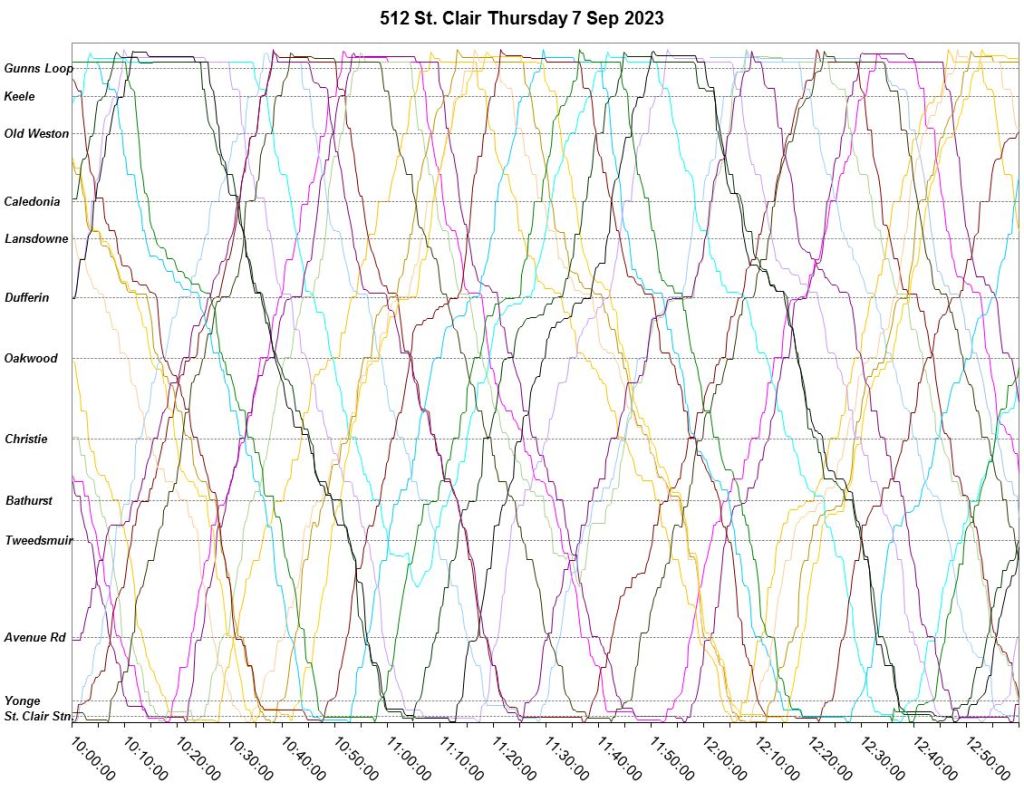
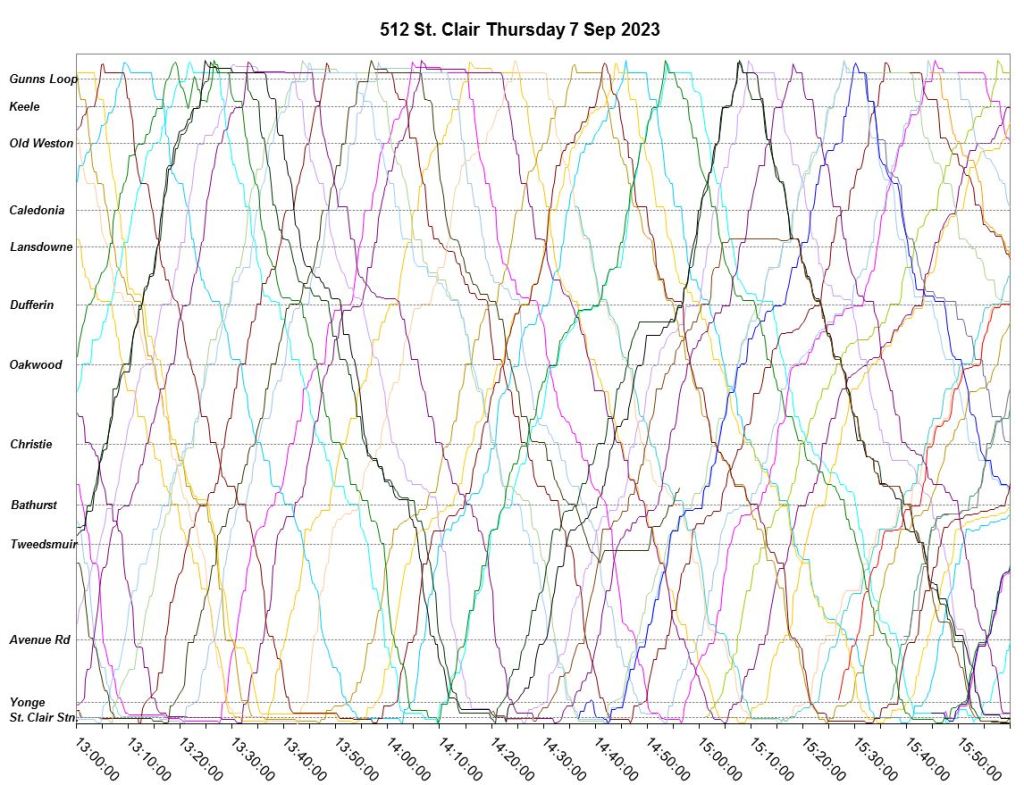
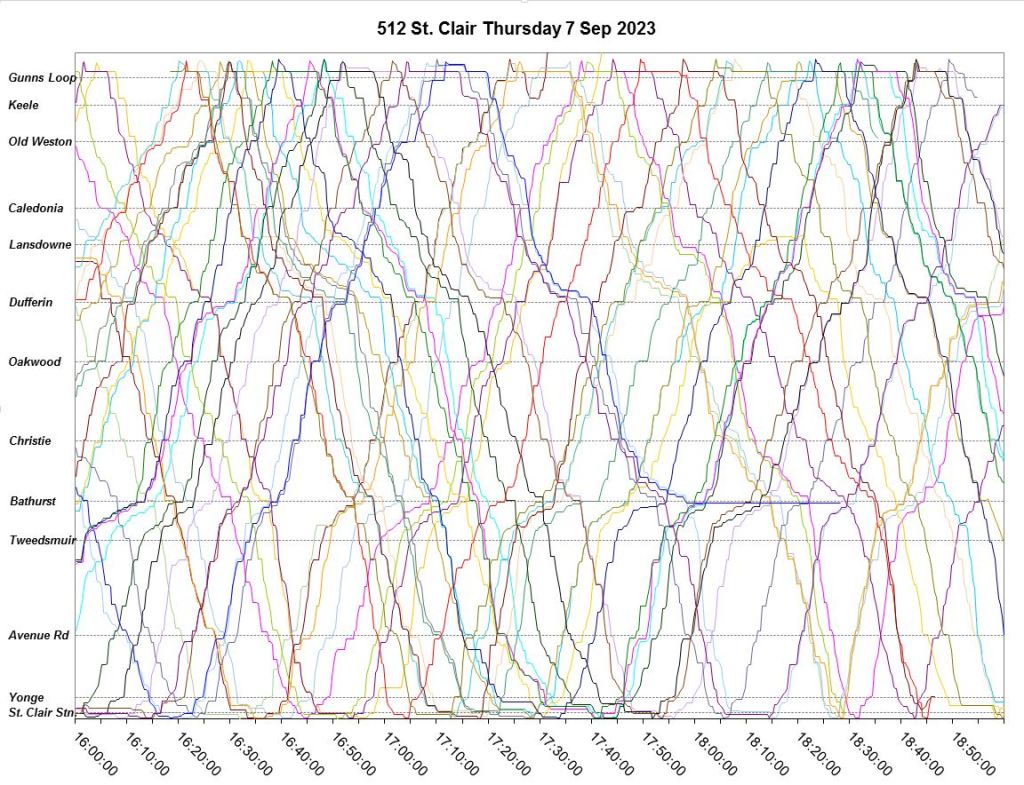
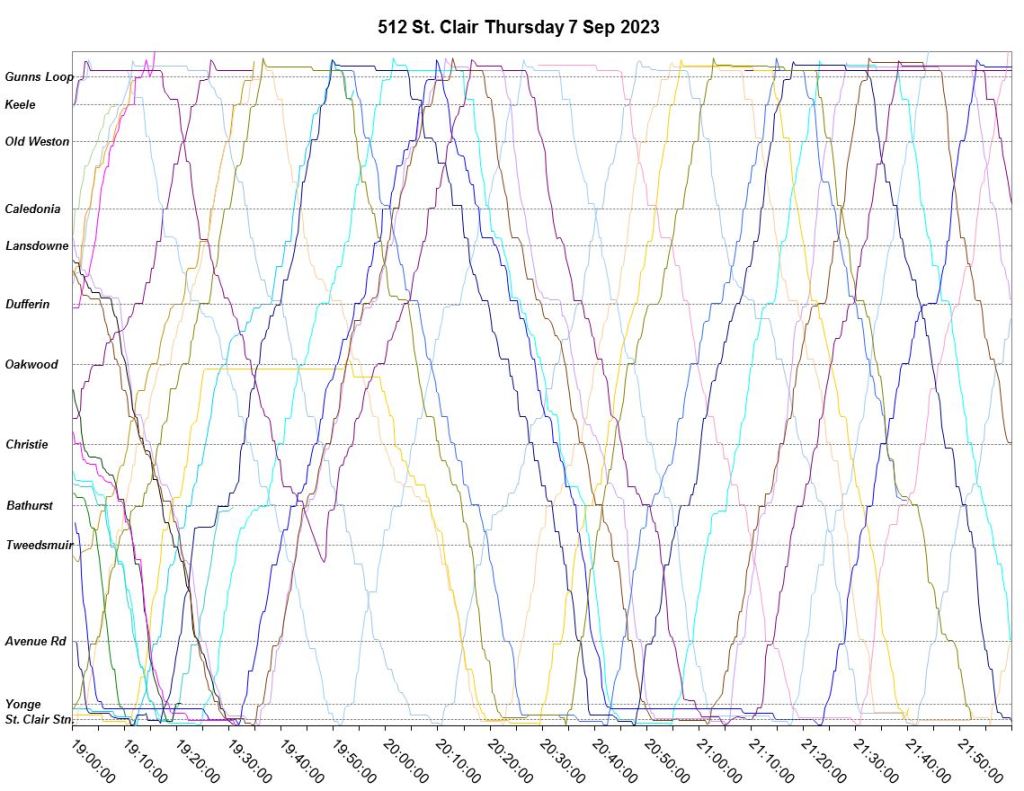
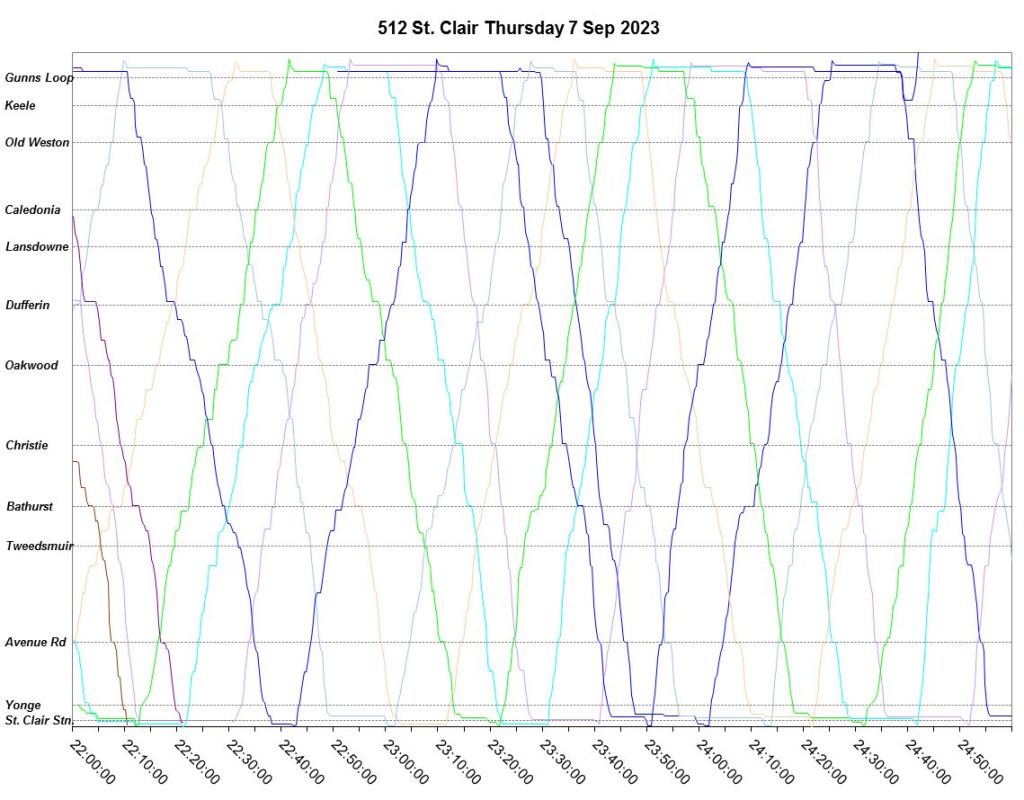
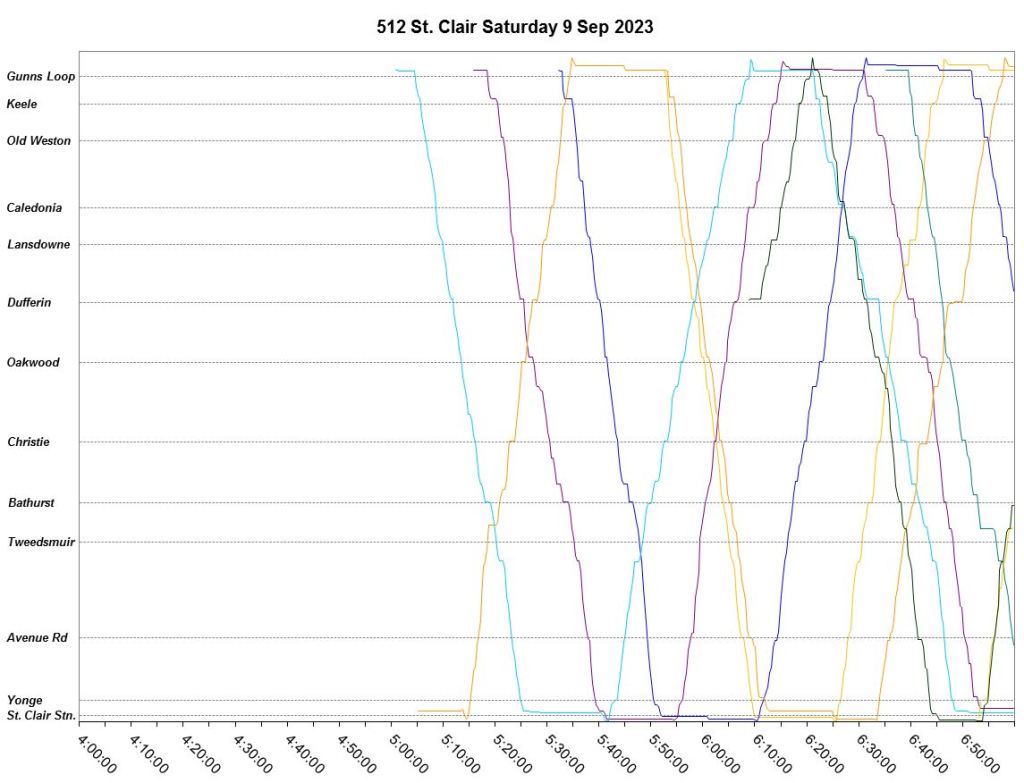
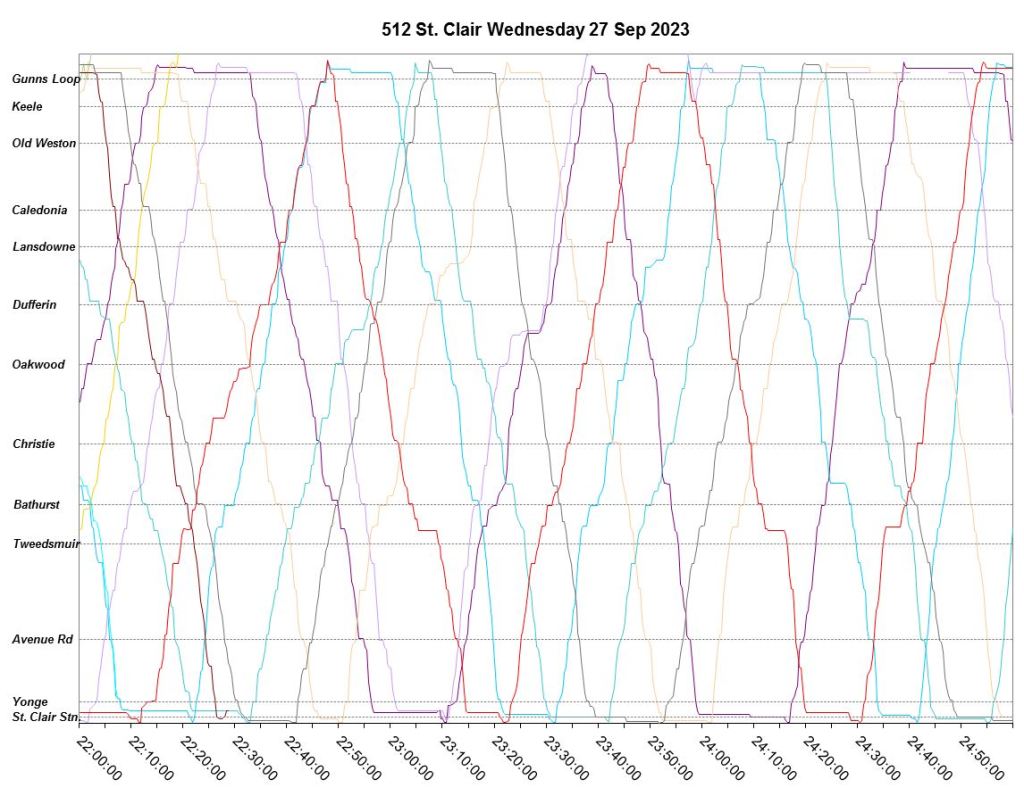
Here are charts of service on three separate dates showing in detail the specific locations and times of congestion.
Each line on the charts represents one vehicle. Its position moves between St. Clair Station at the bottom and Gunn’s Loop at the top. Time flows left to right so that a vehicle’s travels are shown as a series of diagonal lines. The slope of the line indicates the speed with faster movement being upright, and slower more slanted. Stopped vehicles show up as horizontal lines.
The horizontal space between lines shows the spacing of service. Where lines are close together, service is bunched. Where they are further apart, there are gaps. Layovers show up as extended horizontal segments, whereas shorter stops for loading and traffic signals show up as short horizontal segments.
In a few places it is possible to see the effect of buses inching their way toward a stop in traffic.
One important point here is that for much of the day, buses have time for layovers at both terminals (horizontal lines on the charts). This indicates that the problems lie less with the schedules (allocated trip time) than with traffic effects and service management.
Thursday, September 7
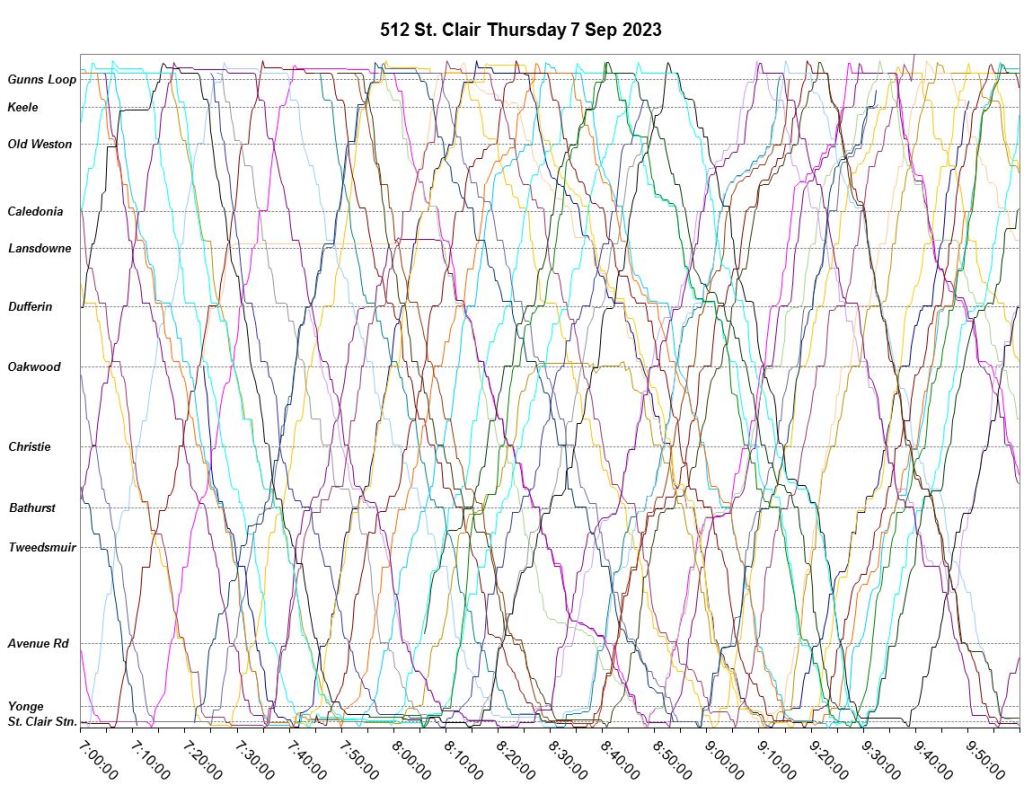
Saturday, September 9
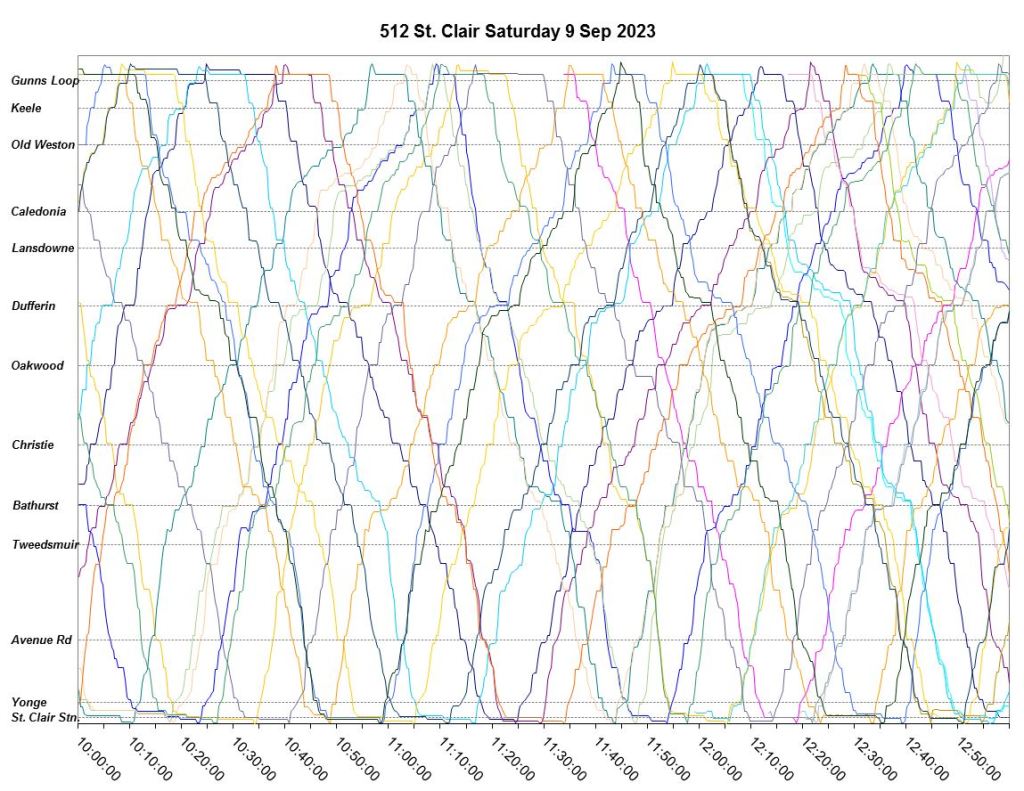
Wednesday, September 27
These charts show the congestion westbound between Dufferin and Caledonia between 3 and 7pm on a few days late in the month that did not show up earlier. This is an example of the need to be vigilant for changing conditions and the need to alter transit priority schemes (or simply to manage conflicting work) rather than setting a scheme in place once and forever.
Service Reliability
Transit travel, fast or otherwise, is of little value if vehicles do not show up reliably with an even spacing, or headway, between them. The TTC’s Service Standards only address service quality at terminals, not along the line, and this is based on “on time” performance (with a generous margin for error), not on actual spacing on the assumption that being on time will solve all problems. Real world transit does not work like that, and for frequent services like St. Clair riders only want regularly spaced vehicles with room to board and ride comfortably.
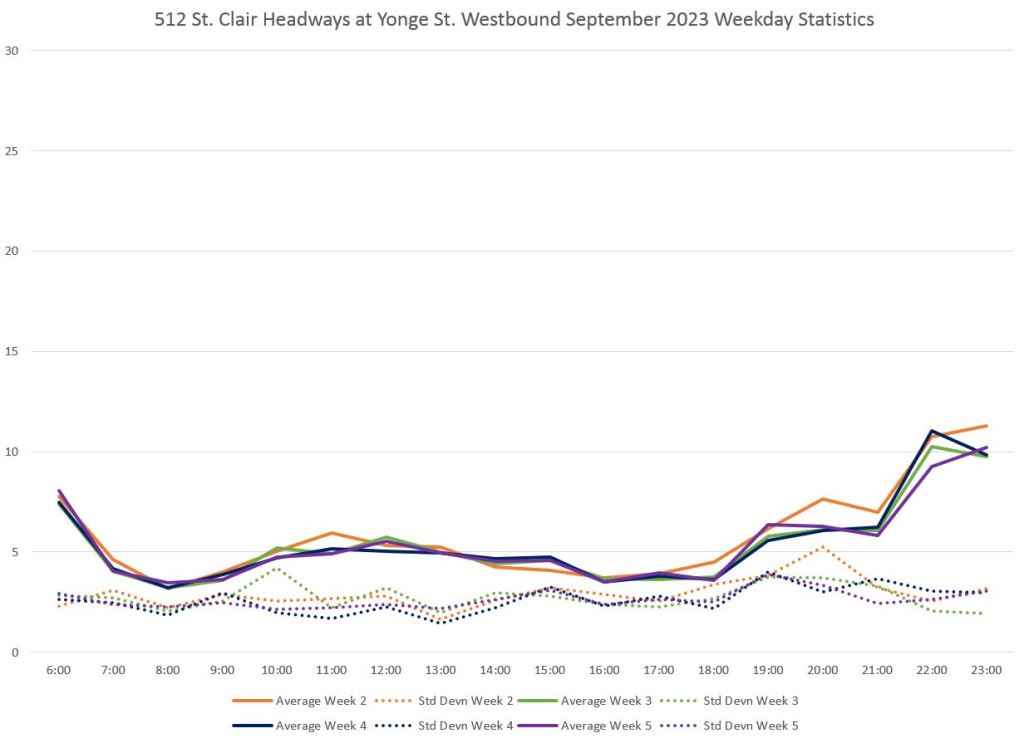
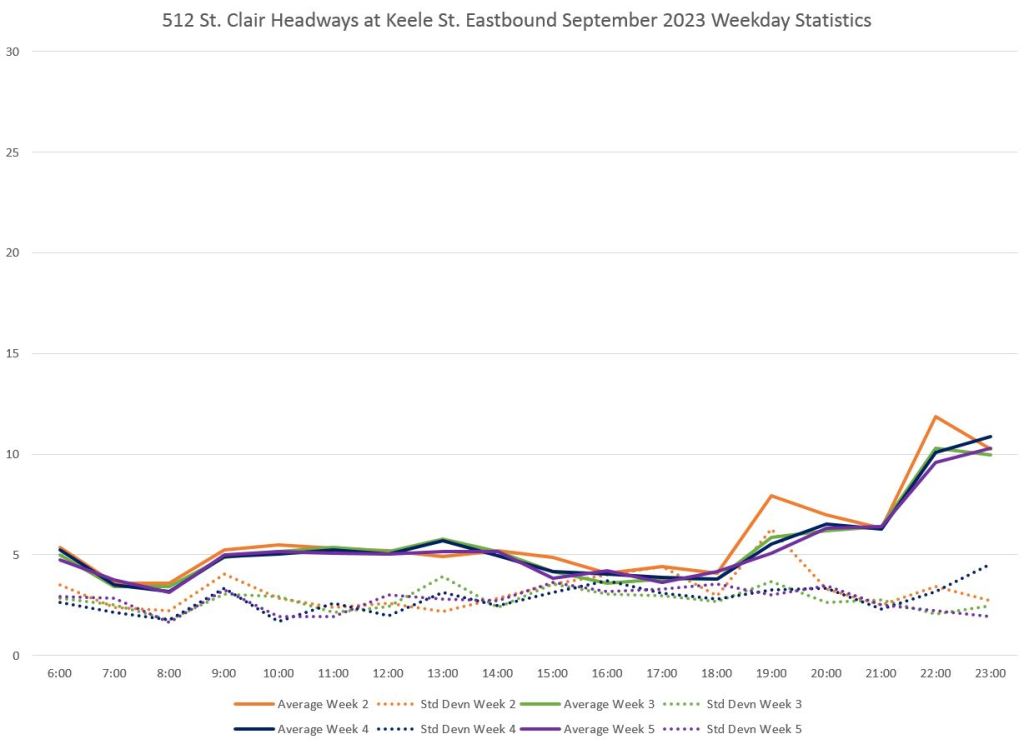
In the spirit of TTC standards, here are the headway stats for service westbound at Yonge and eastbound at Keele broken down by week, day, and hour with separate charts for weekends.
The first pair of charts shows weekly averages and standard deviations at each terminal. Note that the average lines (solid) lie roughly at the values shown in the schedule summary for September near the top of this article. This means that all of the scheduled service operated. However, the SD values are close to and occasionally overlap the averages indicating that there is a lot of bunching an corresponding gaps.
The following charts show the detailed data with each dot representing one trip. Dots near the x-axis show very low headways (bunching) while dots far from the axis show longer headways, well above the scheduled value. What is obvious here is that erratic service is a common situation throughout the month rather than the result of occasional, exceptional circumstances.

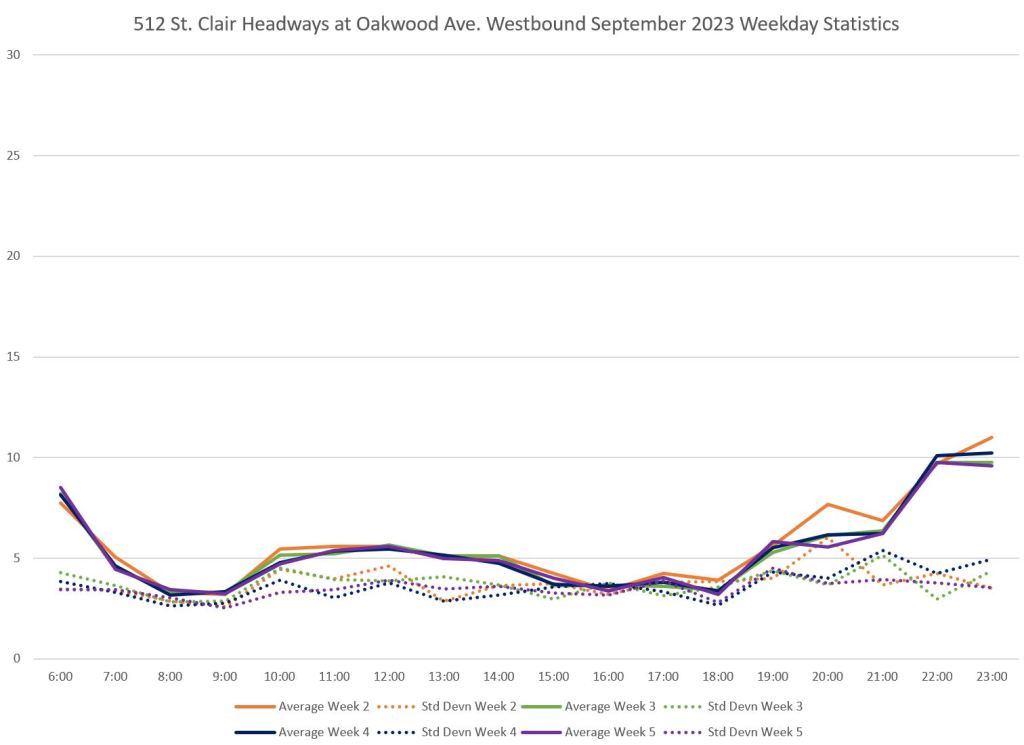
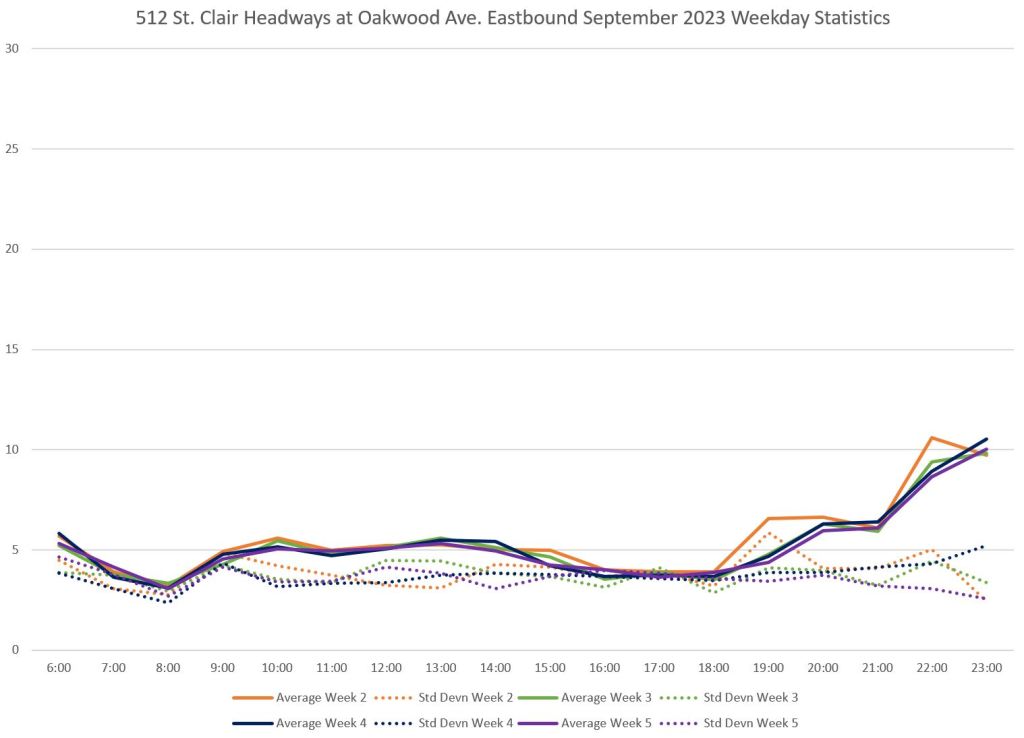
A point of comparison for service quality is to look at a point in the middle of the route. Here are the headway stats for weekdays both ways at Oakwood.
The average headways (solid lines), like those at the terminals, are close to the scheduled values showing that all of the trips actually operated. However, the standard deviations (dotted) are closer to the averages showing that there is more bunching in the middle of the route than at the terminals.
Coming Soon
The next article will review streetcar operation and its reliability, or not, under various operating scenarios through Spring and Summer 2023.
Data Source
All data used in the production of these charts comes from the TTC’s Vision tracking system, with thanks to their staff. The underlying software is entirely my own, developed over many years of looking at TTC service, and the analytical opinions are also mine.
Vision tracking data report vehicle locations with GPS co-ordinates frequently. For analytical simplicity, I have trimmed the “ticks” of the clock to every 20 seconds, and locations are translated to a scale with units of 10 metres. On the service charts, “zero” (the east end of St. Clair Station) is at the bottom, and all locations westward are scaled by their actual distances.
For more information in the process, please see:

Honestly one of the biggest mistakes the TTC made in my opinion with this diversion was extending the 90 Vaughan to Bathurst Station. They should have either extended it to St Clair station to add more capacity on the eastern section of the 512 route, or just turned in around via east on St Clair, south on Bathurst, and north on Vaughan (or the same loop in the other direction). I have seen buses heading south on Bathurst with no people on them. It just seems like a waste of running time.
LikeLiked by 1 person
The priority for the city is the single-occupant automobile.
They narrowed the sidewalks on St. Clair to allow for left-turn lanes, which they didn’t have before, to appease the motorists. The left turning motorists go ahead of the streetcars on their right-of-ways, again to appease the motorists. No bus only lanes during construction, again to appease the motorists. On-street parking along streetcar routes, again to appease the motorists.
LikeLiked by 2 people
All the graphs of service are great but to the average person they just look like noise. One thing I have always thought would be a benefit would be to present a graph of what ideal service looks like (or should look like) beside the graphs of actual service. That way, a comparison could be done to show the differences.
Another thing that you might do is write a tutorial on how to read the graphs. Then you could provide a link to it in future posts.
Steve: If you scroll to the bottom of the post you will find links to two articles. One explains how to read the charts, and the other describes the underlying methodology by which they are created. They are also available on the “Reference Material” tab.
LikeLike
When will streetcars return to Long Branch loop?
Steve: Supposedly in mid-November, but this has not yet been confirmed.
LikeLiked by 1 person
TTC spokesperson Stuart Green told The Star that the TTC plans on “updating signals to allow buses to use the right-of-way in some sections”. Would this be for sections without centre poles? Since the TTC is modifying the overhead, would replacing centre poles by crosswires spanning the width of the street allow buses to use the streetcar right-of-way?
Steve: This gets tricky. Part of the story behind the centre poles, compared to side poles used before the right-of-way was installed, was that the pole spacing originally proposed for street lighting was about 1.5 times the spacing needed for overhead support. That turned out to be wrong, and combined side poles for overhead and lighting could have been used, but by the time that was evident, the centre poles were already there. Changing it back would not be a trivial job both to ensure that the combined poles could handle the load, and because the power taps that used to come up on the side of the street now come up in the middle of the right-of-way.
LikeLike
For those unfamiliar with the area, the distance between the Tweedsmuir and Bathurst stops on St Clair is about 400 metres.
In any case, how this could have gone forward without any measures to get traffic moving and address the bottlenecks is beyond me, and the stats that Steve provides are not at all surprising.
There are Green P lots along St Clair West that sit part-empty all day while the curb lane of St Clair is jammed with parked cars at all hours. This is an issue even when there is no concern about replacement buses etc. It seems like a pervasive Toronto issue — allowing parked cars to block two lanes of a four-lane arterial for a few dollars an hour.
Steve: I should have explained that in my ongoing analysis, the Tweedsmuir-Bathurst segment was chosen because this normally measures the time spent looping through St. Clair West Station.
As for parking lots, this is a problem generally where businesses claim they will fold without on street parking, and pols roll over to support them.
LikeLiked by 1 person
The charts are – sadly – incomprehensible, even to your highly informed transit-fan audience.
The stretch labelled Tweedsmuir to Bathurst needs to become a bus-only (curb) lane for a year, with new pavement markings à la the Scarborough RT replacement buses’ lanes. It is straightforward for any bus (including the 126) to miss four green lights before finally inching up to the corner of Bathurst. Indeed the entire Bathurst–Vaughan Triangle is a kind of black hole along St. Clair.
(Readers are invited to come along for the ride as I go scorched-earth on the St. Clair debacle at St. Clair Worst [also on Twitter] Spoiler: This disaster is going to result in a fatality.)
Steve: I hate to disillusion you, but there are readers for whom the charts are highly informative. In case you were wondering, the choice of route segments for the timing charts is a breakdown I have been using for many years to track each portion of the route individually. Tweedsmuir to Bathurst of course would normally include the loop through St. Clair West Station including any layovers or delays there.
It’s important that any “fixes” be implemented where they are actually needed rather than launching a wholesale redesign that will (a) take longer than targeted changes and, (b) will not have the desired effect on some route segments. Conversely, only fixing the backlog at Bathurst will not address problems further west
All of that said, problems with St. Clair began before the bus substitution with the cut in service level last Spring, and the operation of streetcars to Keele on a schedule designed for Lansdowne as the terminus. This is not just about the cocked up, we’ll fix it later, bus replacement in September. I am still working on that part of the analysis.
Finally, a warning to readers. Joe Clark’s site includes a fair amount of intemperate language with gratuitous slurs against various groups. Read with care.
LikeLiked by 1 person
I have taught statistics for a number of years and I agree that these types of graphs can be intimidating to the average user, but to those who know how they work they are very informative. The lines shows the “average effect” while the individual points show unique data points which show the problems on a fine grained basis. I agree that putting four or five days on the same graph also makes it look intimidating but the alternative is to plot four or five times as many graphs. Learn to read them or don’t bother looking at them at all but quit your bitching as some of us appreciate the effort that went into them,
LikeLiked by 1 person
@SwanBoatSteve, April 20: “I want to know how many senior city staff are polishing their resumes facing the possibility that Doug Ford’s butt boy will not be in the mayor’s office.”
(As a copy-editor, I would run buttboy as a single lexeme.)
In any event, Steve, if I’m intemperate, so are you. It comes with the territory as eldergays with expertise. We don’t begrudge fools, nor should we. You and I apologize for nothing (again: nor should we).
You and I do a fair job of coexisting with wary mutual respect, and this can continue until whichever one of us expires first.
LikeLiked by 1 person
If anything, you’re being kind. I’ve been checking in on Joe’s site for years and he gets crazier as time goes on. His writing about accessibility (what first caught my eye) and transit are tainted, because I’m not sure how much credence to give his work.
LikeLike
The truth of the matter is, the engineers who designed the ROW are grossly incompetent. They should have widened the ROW to allow buses to travel on the SC tracks but failed to account for this, the traffic lanes are too narrow for a bus and the on-street parking needs to be eliminated.
Steve: If they had rebuilt the street using overhead suspension from poles at the curb rather than on the right-of-way, there would have been a few extra feet clearance. No need to widen the ROW.
LikeLike
I have been living in Toronto for almost 23 years and the streetcar network has been perpetually under construction throughout my almost 23 years here in Toronto. The streetcar fleet utilisation rate of streetcars is extremely low and we are spending billons of dollars buying 60 new streetcars (many streetcar supporters were calling for 100 more) but we can’t even use what we already have as the streetcar network is always under construction including rebuilding streetcar tracks that had just been rebuilt and some streetcar track construction projects lasting many years only to rebuild everything soon afterwards.
Steve: I am not among those calling for buying even more streetcars.
One big problem with utilization is not that lines are under construction, although that has been a recent plague, but that the TTC does not run more and better service. A basic ten minuteheadway on most routes, coupled with the inevitable bunches and gaps, does not attract riders.
As for “rebuilt soon afterward”, that is rare. One important point is that almost all of the system is now built to “modern” standards so that the track does not fall apart quickly. That was an important change that was missed originally when the TTC decided to keep the streetcar system: they did not update track maintenance standards for long-haul retention, and we went through a period when we were replacing track that should have lasted 10-15 years longer had it been built properly in the first place.
We are also getting more long-lasting projects as a side effect of, supposedly, co-ordinating work so that multiple jobs don’t come back again and again to the same stretch for track, water mains, etc. These combo projects are generally taking streetcars out of service longer than if only the track rebuild occurred, but they avoid, sometimes, a second shutdown for another utility to occupy the road. A big issue here is the Toronto Water program to replace century old mains, some of which are under the streetcar tracks. Ideally this happens as part of a track rebuild project, but sometimes it triggers a track project sooner than might otherwise occur.
LikeLike