
This is the second part of the October 2018 update which began with a review of travel times and capacities on the combined 504 King and 514 Cherry routes. (514 Cherry was merged into the King service with a route redesign in early October and no longer exists as a separate route number.) This article looks at the evolution of scheduled and actual service levels on King from March 2016 to October 2018.
The purpose of this article is to show that many factors affect service reliability, and this varies both by location, date and time of day. In evaluation of the King Street Pilot it is important to distinguish between changes due strictly to the pilot and changes that occurred separate from it such as schedule updates.
There are a lot of charts in this article, with more in linked collections. As this is the anniversary of the King Street Pilot’s introduction, I am publishing a large amount of data here for reference by those who are interested in the details.
The King Street Pilot has had some effect on headways (the interval between vehicles). This has been more in the “shaving” of peak values which translates to more regular service even if the scheduled frequency changes little if at all. The TTC’s ability to add service has been constrained by its aging streetcar fleet that only recently has been sufficiently replaced by new cars that service on King is now, with few exceptions, fully provided by the larger Flexity low flow cars.
The table below [click to expand] shows the level of scheduled service over the past three years on the 504 King and 514 Cherry routes. The pdf linked below this table also includes information on the changes in scheduled travel times over the two routes.

504514_2016_2018_HeadwayHistory
Aside from the service reorganizations related to the 514 Cherry car, many of the changes from one schedule period to another relate to changes in the provision of trippers. These are vehicles that make one trip across the route intended to coincide with the peak of the peak periods. The level of tripper service is dictated partly by the season, but much more so by vehicle availability. With the merger of the two routes and the full conversion to Flexity operation, the trippers have vanished from the schedule.
The major changes over the period were:
- June 2016:
- 514 Cherry introduced.
- Service levels on 504 King (and hence on the outer part of the shared route) were reduced except during the AM peak.
- September 2016: 514 Cherry midday service improved. This change was reversed in May 2017 coinciding with the formal change of this route from CLRV to Flexity cars.
- September 2017: Running times on 504 King were reduced to claw back an excess that had existed for a few years. Headways during all periods were improved slightly as a result.
- November 2017: Pilot begins. Transit signal priority (TSP) is disabled at several intersections in the pilot zone where it had previously been active.
- February 2018:
- 514 Cherry service improved during the midday and early evening.
- Roncesvalles Carhouse closes for major renovations causing the patterns of service build up/down to change as all cars now operate from east end carhouses.
- May 2018: Running times on both 504 King and 514 Cherry were reduced to incorporate the benefit of the King Street Pilot. Headways were improved on both routes to varying degrees during most operating periods.
- June 2018: Temporary consolidation of the routes for the construction season and the replacement of streetcar service on Broadview Avenue by a bus shuttle to Parliament Street.
- July 2018: TSP is re-activated within the pilot zone.
- September 2018: Temporary return to the traditional route structure.
- October 2018: Permanent consolidation of the routes.
In the table of running times included in the pdf above, round trip scheduled values are shown in an “A+B” format where the first value is driving time and the second is recovery time. TTC has generally not provided a formal recovery time based on the length of trips, but rather simply used this as a way to pad out the total time to an even multiple of the headway. This can create situations where there is minimal or zero recovery time. With the new schedules in fall 2018, there has been a considerable increase in recovery times, and they can be longer than the scheduled headway. This has a few related effects:
- There is a good chance that more than one car will be at a terminus at the same time. With the longer Flexity cars, this can produce congestion at Broadview and Dundas West Stations. The TTC attempts to offset this by scheduling the recovery time at Distillery and Dufferin Loops, although this is not always successful in avoiding on-street queuing of streetcars at the subway stations.
- When schedules are “padded” either with excess driving time, or with recovery time, the concept of “on time departure”, already a flexible idea at the TTC where Service Standards allow a six minute window for “on time”, to be erratic because operators know they can make up time over a trip. Conversely, writing schedules too tightly leads to problems both with the variation in route conditions from day to day, not to mention the basic need for breaks from driving continuously.
- Dufferin Loop has an operators’ washroom, but Distillery Loop does not (although a nearby theatre is used by some in a pinch, provided that it is open). This forces washroom breaks on the 504A service to be taken at Dundas West Station even though the recovery time is supposed to be taken at the Distillery terminus.
The balance of this article reviews changes in actual headways at various points along the route both for inbound and outbound services. The effects vary by location and time of day.
Eastbound
From Dundas West Station Southbound at Bloor Street
Headways southbound on Dundas and Roncesvalles during the 8-9 AM period have varied over the past three years mainly due to changes in the amount of service that is scheduled to run to the terminus. During some periods, notably the early part of 2017, trippers were scheduled to operate to Dundas West, rather than only to Roncesvalles & Queen, with the result that the peak hour headway leaving Dundas West improved for a time.
The schedule changes for summer and for October 2018 are visible in the increased median headways, More troubling is that the 85th percentile also rose, especially for October indicating a problem with maintaining even vehicle spacing.

Of particular note through much of the day is the degree to which both the median and 85th percentiles bounce around. These are inbound headways showing service leaving Dundas West where one might expect that erratic service might be, if not exactly “whipped”, at least cajoled back into some sort of reasonable shape. Off peak service provided on this section of the line is quite variable. The 9-10 pm chart is shown below.

The full set of charts showing extracts from various times of the day is linked below.
504_201603_201810_DundasWestSB_Headways
At King & Jameson Eastbound
There is a substantial difference between the headways leaving Dundas West Station and those seen eastbound at Jameson coming through Parkdale. The difference is explained by two factors:
- During certain periods, trippers originated at Queen & Roncesvalles and filled in some of the gaps originating at Dundas West.
- Short turns at Queen & Roncesvalles caused gaps in service at Dundas West that were, to some extent, filled as the turned cars re-entered eastbound service.
The spikes, particularly in the 85th percentile values, at Jameson are consistently lower or absent compared to those at Dundas West.
The slight rise in values at the beginning of May 2017 corresponds to a reduction in the number of trippers.
The effect of recent service changes is visible in the higher values from early October onward. Note that the effect of the temporary service change for summer 2018 was partly mitigated by the operation of trippers that turned back from Queen & Roncesvalles. These cars were not part of the October service design and median during the 8-9 am period are longer as a result.

Full set of charts:
504_201603_201810_JamesonEB_Headways
At King & Bathurst Eastbound
In the AM peak, there is no change in headway behaviour eastbound at Bathurst Street, the western limit of the pilot. As at Jameson, the rise in values in early May corresponds to a decrease in the number of trippers.
Spikes are visible at the start of September in 2017 and 2018 corresponding to the beginning of TIFF. There is no corresponding spike in 2016 because a different service design with the route broken into eastern and western halves was used that year. The very tall spike on August 21, 2017, was caused by a derailment at King and Bathurst.

By the afternoon peak period, there is a small change in the median value corresponding to the start of the pilot, and the smoothness of this line improves into 2018 until September. This chart covers a three-hour period, and the hourly breakdowns are in the full chart set linked below. The degree of improvement is best in the 5-6 pm period, although even then the change is not large. This suggests that service coming into the pilot area is in slightly better condition possibly due to less disruption in outbound service being reflected in service returning to the core.

By the mid-evening, there is no change in the eastbound service at Bathurst when the pilot begins in November 2017. The drop in values in early 2018 corresponds to the closing of Roncesvalles Carhouse which caused the early evening service to remain on the street longer than when some cars ran in westbound to the carhouse rather than making another eastbound trip to Russell or Leslie Barns.

Full chart set:
504514_201603_201810_BathurstEB_Headways
At King & University Eastbound
Only the 4-7 pm chart is included here to show how the values change from those at Bathurst Street (above) and at Yonge Street (below)

Full chart set:
504514_201603_201810_UniversityEB_Headways
At King & Yonge Eastbound
Note that the data shown here do not include trips by the 503 Kingston Road Tripper car. This was done to allow comparison between those parts of the route served by 504/514 whether or not the 503 was present.
At Yonge Street in the AM peak hour, there is only a small visible change in the numbers with the pilot’s onset in November. As at Bathurst, the May rise is caused by the reduction in trippers.

For the three hour pm peak, the change in median headways is noticeable, and is slightly larger than the change at Bathurst shown above. This indicates that the pilot zone contributed something, albeit a small amount, to improving the median headway values

Mid-evening service shows a slight improvement in the median headway, but the 85th percentile values still have a similar range to those seen before the pilot began.

Late evening service shows a drop in median and 85th percentile values, but not until February 2018 when the Roncesvalles Carhouse closure caused the more frequent early evening service to be present eastbound at Yonge later than it would be under normal conditions.

Full chart set:
504514_201603_201810_YongeEB_Headways
Westbound
From Broadview Station Southbound at Danforth Avenue
As at Dundas West Station, the inbound service from Broadview Station in the 8-9 am period shows no effect of the pilot period starting downtown in November 2017. Indeed, the 85th percentile numbers are markedly worse from January to June 2018 indicating problems with bunched service and short turns.

Midday service from Broadview Station showed an improvement when the pilot began, but one should note that comparable stats appear in earlier periods. By Jan-Feb 2018, and especially from May onward, the 85th percentile rises showing that service here was erratic. The numbers are even higher following the October 2018 change showing that riders at Broadview are not getting anywhere near the quality of service they received before the new service design. Wider headways, with service concentrated in the central portion of the route, are understandable. Wider swings and higher values in the 85th percentile show that service is more erratic than before the change.

By the evening, as on Roncesvalles, median and 85th percentile values bounce all over the place, and are worse with the new service design than before.

Full chart set:
504_201603_201810_DanforthSB_Headways
At King & Jarvis Westbound
There is little change in the headway values after the pilot’s implementation in the AM peak westbound at Jarvis, the eastern limit of the pilot area.

Midday service at Jarvis is affected much more strongly by the improvement in 514 Cherry headways from every 15 to every 10 minutes in February 2018, and then by small improvements to both 504 and 514 headways in March. Headways widened in the summer of 2018, then dropped again in the fall. The new service design with the 504A/504B is at approximately the same level as the summer 2018 schedules, but with all trips operated with the larger Flexity cars.

During the three hours of the PM peak, there is a marked change, especially in the 85th percentile, with the pilot’s implementation, although the greatest contrast is with periods when the route was disrupted by TIFF and construction on Queen Street. The pilot period values are similar to those seen from fall 2016 to spring 2017, and one must be careful to take into account seasonal effects here.

Full chart set:
504514_201603_201810_JarvisWB_Headways
At King & Yonge Westbound
At Yonge, the situation is similar to that seen at Jarvis where there is a large improvement midday in February 2018 due to improved 514 Cherry service. There is also a small change in the median and 85th percentile values during the PM peak after the pilot started.

Full chart set:
504514_201603_201810_YongeWB_Headways
At King & University Westbound
By the time the service reaches University Avenue, the mean values for the three-hour pm peak are almost flat compared to the pre-pilot period. There is no service added westbound through the core, and this evolution of values suggests that the nature of traffic, stop placement, loading times and signalling within the pilot area imposes a regularity on service. Headways entering the pilot area westbound at Jarvis are somewhat more erratic than further west. Looking at the hourly values (in the pdf linked below), this behaviour is seen in each of the individual hours’ data.

Full chart set:
504514_201603_201810_UniversityWB_Headways
At King & Bathurst Westbound
The improvement in mean headway continues westbound at Bathurst during the PM peak. As at University, it is present in all three of the PM peak hours.

Full chart set:
504514_201603_201810_BathurstWB_Headways
The Operation of Merged 504/514 Services
Effective October 7, 2018, service on King is provided by the 504A branch between Dundas West Station and Distillery Loop, and by the 504B nranch between Broadview Station and Dufferin Loop. Scheduled headways on these services are generally the same, and in theory this should produce a regular interleaving of services over the common portion of the route between Sumach Street (where the line to the Distillery branches off) and Dufferin Street. However, the TTC’s six minute on time window is wider than the combined headway of the two services, and that applies only at the termini. By the time service reaches the merge points, there is so much variation in headways that a “blended” service is impossible.
Eastbound
Eastbound at Fraser
Fraser is the first stop east of Dufferin where the 504A Dundas West and 504B Dufferin Gate services merge. The average headways before (week 1, red) and after the new service design was implemented are roughly the same as one would expect for what is supposed to be a rebalancing of service between the branches.

The data shown as a scatter chart show that many headways are close to zero indicating a pair (or worse) of cars running together, and headways well above the average are not uncommon. TTC Service Standards allow a six minute window of “on time” performance, and this is measured only at terminals. In reality, for services with low scheduled headways, bunching lies within the standard.

The data presented as a quartile chart show how, at this location, the range of the 25th to 75th percentiles is fairly narrow for much of the day. The bottom quartile reaches down close to zero because there is always some bunching, and the upper quartile goes above 10 minutes because there are corresponding gaps.
In charts of this format, the vertical boxes show the range of the 2nd and 3rd quartiles (25-75th percentiles) with the median value as a horizontal bar. The tails below the boxes are the 1st quartile (0-25th percentile) and above are the 4th quartile (75-100th percentile). When the box portion is small, the middle 50% of headways are concentrated over a small range, a desirable character in transit service. However, the tails tell their own stories with the lower end ranging close to zero (bunching) and the upper end well above the median (gaps).

The full set of charts include scatter and box-and-tail diagrams for all weeks as well as scatter charts for Saturday and Sunday data. Weekends show the same issue as weekday data with the extra issue that wider scheduled headways bring wider gaps due to erratic service.
504_201810_FraserEB_HeadwayCharts
Northbound from Dufferin Loop
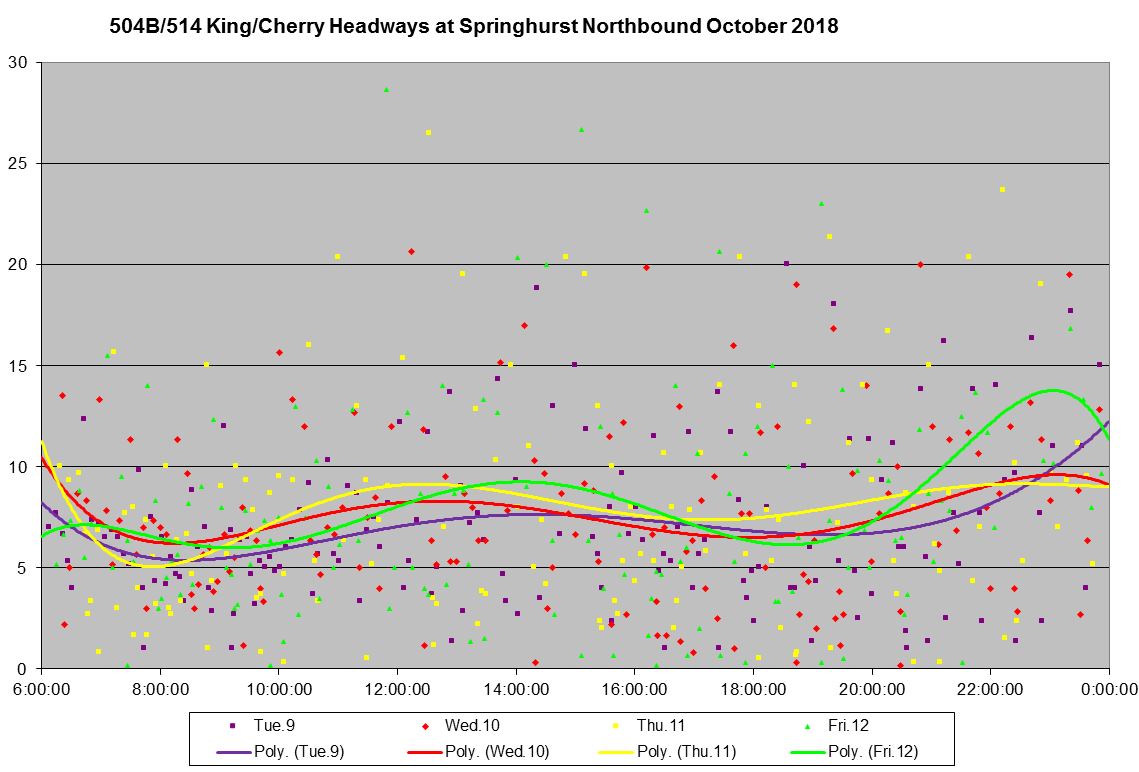
Headways leaving Dufferin Loop are measured at Springhurst Avenue which is just north of the loop.
In the first week of October, service was provided by the 514 Cherry route. Note that although cars were supposed to arrive every 9’30” during midday, the average headways lie well above this reflecting the amount of short turning regularly seen on 514 Cherry especially in the west end of the route.
In the balance of October, service was provided by the 504B Broadview Station to Dufferin Gate branch. Average headways are somewhat longer than scheduled values, and the standard deviations are quite high at five minutes or more for much of the day. This shows a very erratic service leaving the terminal.

The amount of scatter in headways leaving Dufferin Loop is evident in the chart below for the first week when 514 Cherry was still operating.

The same data shown as percentiles emphasize that the central 50% of service (the boxes holding quartiles 2 and 3, 25-75th percentiles) are quite extended during some time periods and routinely exceed the six minute Service Standard. The outlying quartiles show cases of both very short and very wide headways.

The situation in week 2 with the 504B Dufferin Gate service is somewhat improved compared to week 1, but a mix of bunching and wide headways remains. This is not a case of “new schedule jitters”, but a condition that remained throughout the month.
As with week 1, the breakdown by quartiles shows that the central 50% expands beyond six minutes regularly, and the outlying quartiles show a substantial amount of bunching and gapping. The situation is “better” only by comparison to week 1.

Full chart set:
504_201810_SpringhurstNB_HeadwayCharts
Eastbound at Spencer
Spencer is the first stop west of Dufferin and, after October 7, was served only by cars on the 504A Dundas West service. The average headway in week 1 (red) before the service redesign is lower than the values in following weeks.

The range of headways at Spencer is quite broad, well beyond the six minute Service Standard window. However, that only applies at Dundas West. With such wide-ranging headways, it is impossible for the 504A and 504B services to blend at Dufferin.

The same data presented as quartiles show the degree to which the central 50% of service (quartiles 2 and 3, the boxes in the chart) lie over a broad range for much of the day, with the other 50% ranging up well above the mean and down to almost zero.

Full chart set:
504_201810_SpencerEB_HeadwayCharts
Westbound
Westbound at Sackville
Sackville is the first stop west of the point where the Cherry (504A) and Broadview (504B) branches of the King route merge. The average headways before (week 1, red) and after the new service design was implemented are comparable. However, the standard deviation of the values is close to the averages indicating a good deal of bunching.

The headways in week 2 seen as a scatter diagram show the range of values including many that are quite small.

The same data presented as quartiles shows the concentration of values close to the median during some periods, but with the lowest 25th percentile reaching down almost to zero and the upper 25th percentile regularly going above 10 minutes.

Full chart set:
504_201810_SackvilleWB_HeadwayCharts
Northbound from Distillery Loop
Service from Distillery Loop was provided by the 514 Cherry route before the new service design, and by the 504A Distillery to Dundas West branch afterward. In the charts below it is measured at Mill Street which is just north of the loop.
Service to the Distillery on 514 Cherry has been appallingly irregular. The combined effect of wide scheduled headways, short turns, and line management that appears to treat the Cherry branch as an afterthought produced very wide swings in headways. After the new service began operating, the range of headways at Distillery Loop is better than before, but still quite erratic.
The first week (red) show the average headways on 514 Cherry which roughly follow the scheduled values. However, the standard deviation is routinely at or above 5 minutes indicating that a considerable number of values lie well above or below the average. Even with the new service design, the combined effect of the wider scheduled headways and the SD values continue to give a ragged 504A service, albeit somewhat improved from the 514.

The range of headways at Distillery Loop during the first week of October reflects service on the 514 Cherry when there is a huge range of values with bunching and gaps.

The data shown in percentiles is quite damning. This is for service leaving the loop where the ability to manage regular headways should be straightforward. The AM peak is well-behaved in the 7-9am period, but service quickly deteriorates with the central quartiles spanning a range of over 10 minutes.

During the second week, the situation improved considerably although bunching has still not been completely eliminated.

In the quartile representation, the boxes containing the central 50% of the service are much tighter during most time periods although the outliers are still beyond the range one would expect for the scheduled headway. The short headways reflect bunching leaving the terminal, while the extremely large headways can also arise from short turns.

Full chart set:
504_201810_MillNB_HeadwayCharts
Westbound at River Street
An overview of the stats for the service approaching from the east shows the change in service level with the new 504A/B services and fewer cars running through to Broadview Station. More importantly it shows high values for the standard deviations indicating that headway value are not clustered around the average.
Note that at the beginning of the peak periods, cars are entering the 504A service from Leslie Barns, and so they are part of the counts at River. That is why the week 1 values match later weeks in the period before 8 am and at 3 pm.

The situation in week 2 as a scatter chart shows the range over which headways actually lie.

The same data plotted in quartiles.

The full chart set:

There’s this article that mentioned NYC Transit President Andy Byford (now where have I heard that name before?) in saying that “Cameras Are A Lot Better Than Cops at Clearing Bus Lanes”. In our case, that would include streetcars.
However, getting permission from the province (read Doug Ford) will never happen.
Steve: TTC staff are supposed to be reporting back on the idea of vehicle-borne cameras that could be used to go after misbehaving motorists. The real question is just how aggressive the City would be, never mind whatever limits DoFo might put on the implementation. We talk a good line about rules and bylaws, but actual enforcement is rare enough that it’s a news story when a “blitz” occurs.
LikeLiked by 1 person
When Toronto wanted to toll its highways (Gardiner Expressway and Don Valley Parkway), the province was very reluctant.
Toronto could allow motor vehicles to return to King Street, BUT only if the city could toll each and every motor vehicle (with different rates, IE. taxi, private, truck) a toll. Don’t want to pay a toll, avoid King Street.
Can’t see the city tolling King Street (or other downtown streets), because the province will forbid it.
Steve: The problem with a toll is that it allows anyone who wants to pay to get around rules that are supposed to give priority to transit, pedestrians, cyclists and the odd taxi. Transit priority means that the motorists can get stuffed, no matter how much money they have in their pockets.
LikeLike
I’m confused about the data from Distillery Loop in late October. Eastbound 504A cars were sent back westbound at Church for a good 3-4 days near the end of October because of “overhead issues at Distillery Loop” per TTC Notices. I distinctly remember long lines of Flexity cars on Church taking extended layovers while waiting their turn. Is the data from the 504 shuttle operated by 40 footers?
Steve: If you look at the detailed charts, you will see that for the week of October 22, there is little data or Thursday Oct. 25 and none for Friday Oct 26 at Mill Street. Data for Monday Oct 29 begins at about noon. Looking at the detailed data, it appears that a few shuttle buses at various times were logged on as route “504”, but most of the time not. Therefore no service is included for these vehicles in my charts.
Also, regardless of what the notice may have said, the problem was a blown power feeder near Sumach substation. I happened past the scene and overheard comments about how the supposedly spare conduit in which a new feeder might be installed was blocked. The accuracy of TTC notices in describing the reason for service interruptions leaves something to be desired.
LikeLike
It would appear that service on my part of 504A (Roncesvalles), is slightly worse than it was before October 7th, and now I have the proof.
Steve: No surprise there, and I have a similar situation over on Broadview. The service has been concentrated in the middle part of the route.
LikeLike
How come they don’t instruct the drivers to change the destination signs so that if they are flowing a car that is going to the same loop as them they should continue on. Like for example if a 504 A is following another 504A they should contact control and change to a 504 b to avoid having more then one of the same route arriving at a stop.
Steve: They cannot just switch between branches without getting seriously off schedule. The problem is the disorganized way they come into downtown (east from Dufferin, west from Sumach) in no particular order due to irregular service leaving Dundas West and Broadview Stations.
LikeLike
Could the solution be as simple as a trip point at the core junction point? Say that a 504B westbound passes Sumach St. – this triggers a green light at the Cherry Loop telling a 504A car to proceed. Obviously the trip point could be moved further east to allow the correct running time from Cherry Loop to King St. A similar set up at the Dufferin Gate Loop would be possible.
Steve: There is a problem in that you assume there would actually be a car waiting at the “trip point” to be dispatched, and that cars on the other branch would arrive reasonably properly spaced. In practice there is bunching on both branches leaving their respective terminals making a “merge” operation quite challenging.
Steve, how prevalent are “unscheduled” short turns? Is only the Oxley Loop used or is Church-Wellington-York or other larger block loops used? I understood the TTC management had a goal of lowering the number of short turns. At what point(s) does the “line management” monitor the route? How good of an over all picture does TTC master control have of car spacing? When, where and who makes the decision to short turn a car?
Steve: There are not as many unscheduled short turns as before, but they still happen. I see them in the tracking data I get, and if you have nothing to do for a while, watch a route on Nextbus (using the map option) and see how Transit Control reacts to bunching and gapping. Sometimes they do quite a good job of turning cars to fill gaps, other times, it’s hit or miss including whether anything gets short turned at all. I think a lot depends on who’s minding the store, so to speak. Common short turns on King are all along the route at Sunnyside, Shaw, Bathurst, Spadina, Church and Parliament. They don’t use Wellington these days because it is closed for construction.
LikeLike
In fact the (new) overhead east of Yonge has now all been removed as the street is being narrowed next spring between Church and Yonge (after the current Hydro/Bell/Rogers/Beanfield work is finished) and they will need to put up new poles, at least on the north side.
LikeLike
Hi Steve,
A quick note on the 5 days in October, of no service to Cherry (until Nov, 5th, I used to live 3 min walk to the front/cherry stop) is that there is a massive problem with both the blown out feeders (hydro vaults) both near King st, & down at the loop, they FLOOD, constantly, during heavy rains or extreme snow melt.
It’s so bad at times, that when there is heavy rains expected or happening, you’ll see a white TTC repair truck near the loop.
Also, when there are buses between Broadview & Parliament, they use Berkeley St, between Front & King, to layover, some will also use Front Street, causing issues with the extreme amounts of traffic in that area during rush hour.
LikeLike