
[This is a long article, and I won’t hold it against anyone for failing to read all the way to the end, or not looking at every page of every chart. The issue here is a system-wide one of how service is scheduled and managed using routes where the TTC is attempting to improve operations as a reference.]
At the TTC Board Meeting of December 2015, Chief Service Officer Richard Leary gave a presentation “Performance Based Service” outlining the work done to date to improve the reliability of surface routes. [A YouTube video of the presentation is also available.]
The focus of changes made to several schedules has been that end-to-end running times should reflect actual on-street conditions rather than presenting drivers with an unattainable goal that cannot be met during typical conditions, let alone anything unusual such as poor weather or unusually bad traffic congestion.
The changes to date are summarized in the table below.
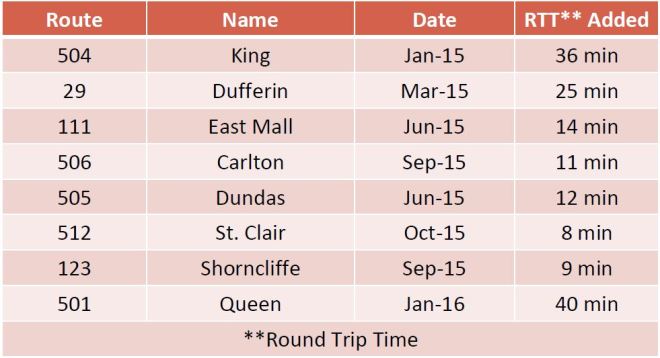
In some cases, the extra running time is provided simply by widening the headway. For example, if a route takes one hour, and it has a bus every 10 minutes, that’s six buses. Extending the headway to 11 minutes would change the round trip to 66 minutes with no added cost. In theory, if this allows vehicles to stay on time, better service might actually be provided because all buses would show up as planned. That, however, depends on them being properly spaced so that their capacity is evenly used.
In other cases, where the problem is not just scheduled time but also capacity, more vehicles can be added. In the example above, a seventh bus would allow the headway to stay at 10 minutes while the trip time went up to 70. With the long-standing problems of a constrained fleet, this is only possible in off-peak periods, or by raiding other routes for vehicles.
With the added running time, all service is expected to reach its scheduled destination except under unusual circumstances. The measurement formerly used by the TTC to evaluate service actually rewarded poor service on the outer ends of routes.


The old metric looked at the central portion of the route with a target that about two thirds of the service would be “on time”, defined as ±3 minutes of the scheduled headway (the time between vehicles). Keeping service in reasonably good condition in the centre could be done at the expense of the outlying portions with no effect on the “score” measuring service quality. Even at that, the target range was low enough that a rider would be guaranteed to encounter an out-of-range headway for, on average, one vehicle in three. A wide gap would be a fact of life almost every day for the typical user of surface routes.
The new metric considers end points with a goal that service leaves close to on time nine times out of ten or better from the terminus, and arrives at the other end at least six times out of ten “on time”. This gets a bit tricky in practice because the provision of regularly spaced service (even headways) assumes that almost all service will leave “on time” and therefore be properly spaced.
As for arrival times, the wide latitude for a missed target will only work if there is sufficient “recovery time” at the terminal to compensate for a late arrival. The 60% “on time” goal applies to routes running in mixed traffic while 80% is the goal for routes with their own reserved lanes (e.g. St. Clair). The reported stats do not distinguish between early and late arrivals, but either way, a large number will indicate a need to modify the schedules.
The definition of “on time” has been changed so that the accepted range, although still 6 minutes wide, is now +1 minute early to -5 minutes late. The premise here is that riders are much more sensitive to vehicles they have missed unexpectedly than to those running a bit late. That definition has severe problems:
- On an infrequent route (say less often than every 10 minutes), on time performance is valued because the wait time for a missed bus will be quite long. However, on a frequent route, it is the headway reliability that translates to regular service.
- A range of 6 minutes allows vehicles on frequent routes to run nose-to-tail and still be counted as “on time”. Riders see less frequent service, and typically encounter pairs of vehicles with one packed and its follower lightly loaded. A route with an advertised 6 minute frequency could see actual vehicle spacings of 1-11-1-11, in effect two vehicles every 12 minutes, and the route would score 100% because it is measured against the schedule, not against the regularity of service.
The question of whether to measure (and manage) against scheduled times versus headways has swung back and forth within the TTC (and in debates on this and other sites) for some time. The TTC prefers schedules with the assumption that regularity will look after itself if service is “on time”, but then provides an escape hatch with a metric that allows poorly spaced service to be considered as acceptable.
One benefit of the new approach has been a reduction in short turns, at least according to the TTC.


Of particular interest is the summer 2015 data which are not much changed from 2014. Anomalies like this deserve investigation to find out just what was happening. For example, were conditions in 2015 noticeably worse offsetting gains from earlier in the year?
Some change probably lies in management focus because the streetcar schedule improvements appear to have largely been accomplished early in 2015 even though the schedule changes came later. Simply saying that “short turns are bad and should be avoided” can have an effect on these numbers regardless of the actual effect on service. A common problem with any performance metric is that an organization will “manage to the metric” and produce “good” results based on how operations are reported.
Although the diagrams above show measurements only at terminals, on-the-street experience shows that some attempts are being made at holding vehicles to schedule (and hence to headway) during periods when the scheduled running time is excessive. The result is service that dawdles along a route and lays over periodically to burn up extra time. The tradeoff here is whether too much time has been added to schedules for “typical” conditions.
A related problem is that attempts to measure the actual travel times needed by transit vehicles both for scheduling and for traffic management studies can be compromised by vehicles travelling more slowly than actual conditions would permit. In effect, a streetcar or bus could appear to be “stuck in traffic” when it is really just killing time.
The TTC is now counting both “short turns” and “missed trips” as separate metrics with the intent of migrating to the latter once short turns, per se, are under control. The difference between these is that:
- A short turn occurs when a vehicle scheduled to operate to a location is turned back before it reaches that point. Note that the “location” need not be a terminus because the scheduled destination could be itself an intermediate turnback point such as Humber Loop on the 501 Queen car as operated until January 2016.
- A missed trip occurs when a vehicle misses its scheduled arrival by 20 minutes or more. This could be due to a short turn, to being very late, or to simply not being in service due to vehicle or operator shortages, or a breakdown. This metric picks up a wider range of circumstances all of which produce the same effect – a gap where service should be – for the rider.
To see how effective the schedule changes have been, we need to drill down to a lower level – individual routes – to see what actually happened. This requires examination of two separate sets of numbers:
- What was the average headway at the terminals as compared to the central part of the line? In other words, how much of the service “downtown” actually made it to the terminals?
- How reliable was the headway experienced by riders both leaving the terminals (a way of looking at on time performance) and further along the route?
506 Carlton
New schedules were implemented on Carlton in September 2015. In all but one schedule period, the headways are widened even when vehicles have been added to the route. This reduces the scheduled capacity, but the counterargument usually advanced is that the actual capacity provided will be improved with more regular service.
Period       Spring 2015            September 2015
             Hdwy   Vehs   Trip     Hdwy   Vehs   Trip

Weekdays
AM Peak      3'45"   32    120'     4'00"   32    128'
Midday       5'15"   25    132'     5'30"   28    154'
PM Peak      5'00"   27    135'     5'30"   29    160'
Early Eve    6'30"   16    120'     7'30"   18    135'
Late Eve     10'00"  11    110'     8'30"   14    119'

Saturdays
Early Morn   7'09"   14    100'     7'30"   14    105'
Late Morn    7'00"   16    112'     7'30"   18    135'
Afternoon    6'00"   22    132'     6'15"   25    156'
Early Eve    8'00"   14    112'     8'45"   16    140'
Late Eve     8'30"   13    111'     9'30"   13    124'

Sundays
Early Morn   10'00"   9     90'     10'00"  11    110'
Late Morn    8'00"   12     96'     10'00"  12    120'
Afternoon    7'20"   16    117'      8'00"  18    144'
Early Eve    10'00"  11    110'     10'00"  12    120'
Late Eve     9'00"   11     99'     10'00"  11    110'
TTC stats show that short turns dropped dramatically on Carlton after this change as did missed trips, and there was an improvement in on time departures. On time arrivals continue to be a problem, but if departures are now more likely to be “on time”, this implies that cars routinely arrive at terminals too early, i.e. they have too much running time now. If they were late, not early, arriving, they would likely have problems leaving on time.
Another way of looking at this is to examine the metric the TTC is using. The TTC’s allowed spread of only +1 minute early, but -5 minutes late, could artificially inflate the bad arrival stats as even the slightest amount of extra running time will bring a vehicle to the terminal “early”. What really counts is the reliability of headway along the route, but this is not part of the TTC’s statistical framework.

The TTC shows all-day counts that are not subdivided by time period, and they are only for weekdays.
One way of looking at the evolution of headways is to plot the actual observed values at various points along the route over a period of time. The following charts [PDFs] track the observed headways from each terminal (Main Station in the east, High Park in the west) as well as from Yonge Street both ways. Dufferin eastbound is also included because so much westbound service never reached High Park. [For notes on reading these charts, please scroll down to the end of this article.]
506_SB_Danforth_HeadwayHistory
From Main Station (southbound at Danforth Avenue), there are quite noticeable improvements in the average headways from September 2015 onward showing that much more service is reaching the end of the line. The standard deviation values also improve showing that the “gappiness” of service from this terminal has been reduced. However, the SD values are often at or above 3 minutes indicating that much of the service is at the edge of the TTC’s 6-minute window. Note that these numbers say nothing about whether a car is “on time”, only its position relative to the car immediately in front of it. That is service as seen by the intending rider.
At Yonge westbound, there is much less change in the average headway because almost every car crosses this point whether it is on time or not. What is visible is a slight improvement in SD values showing that service is somewhat more reliable, but these values remain consistent at or above 3 minutes indicating that irregular headways remain the norm, only with a slight improvement.
506_EB_Parkside_HeadwayHistory
506_EB_Dufferin_HeadwayHistory
At High Park (eastbound at Parkside Drive), average headways from September 2015 onward are considerably improved, as are many of the SD values. This reflects the arrival of most scheduled service at the terminal. Also included here is a chart for Dufferin eastbound which picks up all of the short turns at Lansdowne. The averages are much better than at Parkside except for months after the schedule change.
At Yonge eastbound, as in the westbound service, there is much less change from the new schedules. Most of the scheduled service does cross Yonge, although how far it would go is quite another matter.
Quite noticeable in the charts is the month of April 2015 when the intersection of College & Spadina was under construction, and all service was diverted to Dundas Street. There was no provision in the schedule for extra running time for this diversion, and headways suffered accordingly.
Another way to look at the data is to review the details for one month’s operation.
506_201511_SB_Danforth_MonthHeadways
At Danforth southbound, the weekday values are more scattered late in the month, and there is also visibly more scatter in the evening. Weekend values are not very impressive especially considering that the schedules were supposed to be improved to ensure cars had enough time to make their trips. Very short and very long headways are not uncommon, especially on Sundays, the very time when, with less service, regularity is paramount.
506_201511_WB_Yonge_MonthHeadways
At Yonge westbound, the general shape of the values is similar, but they are more dispersed as can be seen by flipping between equivalent pages in each chart set. This shows how even a relatively well-organized departure from a terminal can evolve to less reliable service across a route.
This type of service also cannot possibly produce good “on time” stats because the swing in headways is wider than the allowable “off schedule” values. However, the TTC does not (yet) report on weekend operations.
The combination of defining “on time” with a variation comparable to the scheduled headway, reporting only on weekday operations, and consolidating of all-day data into one value, leads to better stats than riders might credit the TTC with achieving. Riders do not experience the averages, but the fluctuations. The new schedules reduce some problems, notably those related to short turns, but they do not eliminate unreliable headways.
505 Dundas
Dundas received new weekday schedules in May, June and September 2015. The table below shows the evolution of headways and running times over this period. Direct comparisons are best between March and September which both represent “winter” schedule conditions. Peak headways are wider to allow for more running time with the same number of cars, although off-peak there is a more frequent scheduled service.
Period       March 2015             May 2015               June 2015              September 2015
             Hdwy   Vehs   Trip     Hdwy   Vehs   Trip     Hdwy   Vehs   Trip     Hdwy   Vehs   Trip

Weekdays
AM Peak      5"15"   19    100'     5"15"   19    100'     6'30"   17    111'     5'50"   19    111'
Midday       6'30"   16    104'     6'00"   19    114'     7'00"   17    119'     6'00"   19    114'
PM Peak      5'20"   20    107'     5'20"   20    107'     7'00"   18    126'     6'20"   20    127'
Early Eve    8'00"   11     88'     7'30"   15    113'     8'00"   14    112'     7'30"   15    115'
Late Eve     12'00"   7     84'     12'00"   7     84'     9'48"   10     98'     10'00"  10    100'
As on Carlton, there was a drop in short turns and missed trips, but on time arrivals continue to be very low. Based on personal observation at Broadview Station this is almost certainly due to cars arriving very early as there are commonly two, sometimes three cars in or near the station at off-peak times. There is a limit to how much a schedule can be “padded” against delays when there is only capacity at the terminal for a few cars.
It is worth noting that short turns dropped off markedly in late March even though the weekday schedule then in use was implemented in September 2014. Some other factor is responsible for the drop in short turns at the start of spring 2015, and it cannot simply be the weather because the higher level is seen through fall 2014. This could simply reflect a change in line management philosophy.
505 Dundas was affected by spillover traffic in April 2015 from College Street which was closed at Spadina, but this only has a minor effect on the TTC’s stats. This could be, in part, due to all-day summarization of data because the effect was worst at midday and during the PM peak, not to mention weekends which are not included in the TTC numbers.

As with Carlton, the headway histories are shown for the termini and at Yonge Street.
505_SB_Danforth_HeadwayHistory
Southbound from Broadview Station, the effect of the new schedule is most telling for the end of the AM peak and the midday service. Prior to the change, there was a lingering effect from the peak where “catch up” short turns would fix problems from the peak period leading to wider and less reliable headways at the terminal. There is also better service in the mid-evening period beyond the change in scheduled headways.
Southbound from Dundas West Station, there is a similar pattern. Again, the improvement in average headway is already apparent in spring 2015 before running time is added during the PM peak period.
From both terminals, even with the new schedules, the standard deviation values remain large enough to produce gapping and bunching even though there is better service at these locations.
At Yonge Street, the effects of more running time are hardly noticeable, and improvements in average headways can be attributed mainly to better scheduled service, not to reliability.
504 King
The King route has seen many schedule changes as equipment shifts between bus and streetcar operations, and running times are adjusted. For reference, I will include only the January schedules for 2014, 2015 and 2016 here to show, broadly, the evolution of running times. Peak services shown are only the through streetcar trips from Dundas West to Broadview Station. Trippers are not included.
Period       January 2014           January 2015           January 2016
             Hdwy   Vehs   Trip     Hdwy   Vehs   Trip     Hdwy   Vehs   Trip

Weekdays
AM Peak      4'00"   30    120'     4'00"   33    132'     4'00"   33    132'
Midday       3'45"   30    113'     4'40"   30    140'     4'10"   33    135'
PM Peak      2'50"   45    128'     4'00"   38    152'     4'00"   37    150'
Early Eve    4'00"   27    108'     5'00"   27    135'     4'00"   31    124'
Late Eve     6'45"   14     95'     8'00"   14    112'     5'45"   18    103'
By January 2016, the TTC realized that they had “overshot” with extra running time in some periods, notably the evening, and some of the extra was clawed back even though the values are still higher than in January 2014. These changes took effect in the November 2015 schedules.

Although the short turn and missed trips counts are down, and on time departures are up starting in 2015, the on time arrival rate is almost unchanged. Low missed trips indicates that most service is now reaching the terminal. As on other routes, the “poor” on time arrivals is likely a side effect of how this is measured with only a one-minute early allowance, not a reflection of inherently poor service.
The headway history for King is complete over an extended period because this route has been under detailed investigation and I have a continuous set of data covering a few years.
504_SB_Danforth_HeadwayHistory
Southbound from Danforth, headways are noticeably better in 2015 and moreover the SD value lines have pulled away from the averages. Although the values still lie in the 2-3 minute range, this is much better than the 4 minutes or greater seen in earlier data. The gap in summer 2014 is caused by a bus replacement of streetcar services on Broadview for water main construction that, in fact, did not happen until 2015, and then disrupted service only on weekends. High values in the first week of September 2014 were caused by the TIFF diversion and the disruptions this caused. Because this is averaged over one week’s data, the effect shows here less severely than the actual experience on “TIFF days”.
504_SB_BloorWest_HeadwayHistory
Southbound from Bloor West shows similar results to those at Danforth.
Westbound at Yonge there is less effect from the new schedules although there is some improvement to SD values middays and evenings. The spike in September 2015 is caused by TIFF. Eastbound at Yonge shows no effect at all.
When looking at data for King Street, another major factor is the ongoing construction on the Gardiner Expressway. The effect shows up primarily west of downtown, especially in Parkdale as congestion at intersections leading to on-ramps. Which ramps are open, and which sections of the expressway are operating at restricted capacity, changes from time to time and congestion on King Street shifts along with these changes. This affects the ability of streetcars to achieve their schedules, even on the extended running times. King is also subject to delays from the entertainment district and from major events downtown that vary with the calendar and with the weather.
What is clear from the data is that service at terminals has improved, but that maintaining regular headways over the route is always a challenge requiring adaptation to hour-by-hour circumstances. Whether the TTC will put this level of effort into the route remains to be seen.
512 St. Clair
I wrote about changes to the St. Clair service last year in two articles: The Evolution of Service on 512 St. Clair Part 1 and Part 2.

29 Dufferin
I wrote about service on the Dufferin bus last year: The Evolution of Service on 29 Dufferin.

501 Queen (Changes scheduled for January 3, 2016)
It is no surprise that service on 501 Queen has been a mess for years, and that the TTC’s stock response is that they can’t do anything about it because of the horrors of mixed traffic operation.
Well, no, it’s a difficult route, but when the service design, the schedule and the actual operation of the route simply don’t match the real world of a busy city street, of course there will be problems. After 20 years as a single route from Neville to Long Branch, where riders on the outer ends of the line suffered from appallingly unreliable service, the route has been split again at Humber Loop, and the schedules have been adjusted to match on-street conditions.
We won’t have operating results for a month or so when I can get the January tracking data, but meanwhile here are charts showing just what passes for “service” on Queen up until now.
The TTC’s stats are not pretty. On time departures are under 50% while missed trips are routinely over 40%.
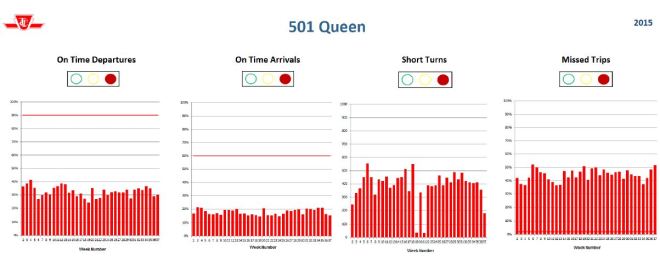
The headway history charts show the huge difference in service at various points on the line.
501_WB_SilverBirchAve_HeadwayHistory
Silver Birch is just west of Neville Loop and is used as the screenline in my analysis to avoid problems with congestion (when it occurs) of cars backed up at Neville Loop. Headways here run consistently at the scheduled 6 minute mark for the first two hours of the day (6:00 and 7:00 am), but then things fall apart. By 8:00 am service is already being short turned before it reaches The Beach to put it back on time for westbound trips, and this plays havoc with attempts to commute out of The Beach for regular office hours downtown. Average headways stay at or above 8 minutes through the day getting worse in the afternoon. Things don’t begin to settle back until mid-evening, and even then there are no guarantees (as seen with the 8:00 pm line for much of 2015). SD values are also consistently in the 4-8 minute range indicating a wide swing in individual headways either side of the already wider-than-scheduled averages.
501_WB_GreenwoodAve_HeadwayHistory
The charts for Greenwood give a sense of how much service never gets to Neville Loop. Average headways here are generally at scheduled levels, and SD values, at least during the daytime, might be showing some benefit of headway-based dispatching westbound at Russell Division just to the east.
At Yonge, as at Greenwood, much of the service is present and so the average headways are close to scheduled values. However, the SD values are higher showing how bunching has occurred in the trip west to downtown. This is particularly bad in the evening when there is no reason to expect congestion-induced bunching coming into the core from the east. The SD and average values at Yonge overlap quite a bit indicating that there is a lot of bunching.
Regular riders of the line would often see a Humber and a Long Branch car running quite close together even though they allegedly provide a blended headway.
501_WB_QueenswayHumber_HeadwayHistory
This chart shows the service just east of Humber Loop westbound. As at Neville, the average headways widen at the end of the AM peak because so much service is short-turned at Roncesvalles to get it back on time. This is a chronic problem. Also quite visible are the high SD values because, at this point, the through Long Branch cars and short-turn Humbers are running nose-to-tail.
501_WB_RoyalYork_HeadwayHistory
At Royal York, we see two different service patterns. The high and uneven values are periods when service is provided by streetcars running through from Queen, while the low values are the shuttle bus operation during Gardiner construction that forced a split in the line. This bus shuttle ran on a schedule not unlike that to be provided by the “temporary” Long Branch streetcar service that just began operating.
During periods of streetcar operation, the averages bounce around a lot, and the SD values are very high, routinely 8-10 minutes indicating that bunching was not uncommon even on the wide scheduled headway for Long Branch streetcar service. Evening service is particularly pathetic.
501_EB_LongBranchLoop_HeadwayHistory
Service inbound from Long Branch isn’t much better even though, in theory, cars have had a chance to layover, operators catch their breath, and maybe, just maybe, they could leave vaguely on time. Quite clearly this does not happen, and even during periods of the bus shuttle, the SD values show a rather leisurely observation of properly-spaced departures.
501_EB_RoncesvallesAve_HeadwayHistory
As in the east end at Greenwood, headways east from Roncesvalles are much closer to advertised values, although there remains a post-AM peak effect (less evident in fall 2015) showing that service is short turning east of Roncesvalles (probably Shaw/Dufferin) to get back on time. SD values are consistently at or above 4 minutes here even though it would be a convenient point to dispatch an even headway.
As with the westbound service, headways at Yonge are close to the scheduled values, but the SD values sit consistently above 4 minutes, sometimes overlapping the averages. There is a lot of bunching by this point in the route. Note that this applies even when all streetcar service originates at Humber Loop. The problem cannot be blamed on the length of the trip from Long Branch, but rather is a combination of uneven departure headways at Roncesvalles compounded by congestion across the west end of Queen.
501_EB_WoodbineAve_HeadwayHistory
Finally we are back in The Beach, and this chart shows the service, such as it is, at Woodbine, just beyond the major short-turn point at Kingston Road. Again, the SD values are high, particularly in the evening, and so the already-high headways will be magnified by bunching and gaps.
The TTC pins its hopes for more reliable service on the new schedule, and in a month we will be able to see what they have achieved.
Plans for 2016
The TTC will turn its attention to many suburban routes this year concentrating on those with high ridership and known reliability problems.


Reading Headway History Charts
Over the years, I have accumulated TTC vehicle tracking data for various routes graciously provided by the TTC. Some of this was used as part of traffic studies for the City of Toronto on congestion and travel times on various routes, while other data were obtained as a mater of historical interest on my own part. Note that these are the original TTC GPS tracking data, not the version that comes out of the NextBus feed.
The tracking data were digested (see Methodology for Analysis of TTC’s Vehicle Tracking Data) and consolidated in monthly charts (of which more below) with data organized by time of day, day/week of the month, and type of day (e.g. weekdays, Saturdays, Sundays). These monthly collections were further consolidated over time with information for each hourly period and week plotted separately.
The first page of each set contains the data from 6:00 am to 9:00 am with a different colour applied to each period. The solid lines show the averages, while the dotted lines show the standard deviation values, a measure of how tightly clustered (or not) the data values are. If the SD value is high, then there is a fair amount of scatter in the individual values indicating irregular, probably bunched service. Note that a major delay can cause a spike in one data point’s value because it contributes a large value. It is the overall shape of the charts that is of interest rather than specific points. Where a chart has “spiky” values all of the time, this indicates continuously uneven headways that cannot be explained by occasional blockages.
Reading Monthly Headway Charts
The monthly headway charts present the data organized by week within the month, but with each day’s data shown individually in its own colour and including a trend line. Roughly speaking, the trend line will follow the average headways, but smoothed out over time. At locations where all of the service operates, the trend lines follow the pattern of the scheduled headways.
Data are shown for each week in the month, as well as for all Saturdays and all Sundays on separate pages as these make logical groupings. Also included are standard deviation calculations for the values across all weekdays, Saturdays and Sundays. It is quite common to see high SD values especially on weekends when bunching is much more common.
If vehicles left termini (or passed major timepoints enroute) within a minute either way of schedule, then the headways would also be reliable and the data points would not be spread out. However, is is possible for average values to mask considerable scatter of individual values, and it is that scatter (along with short turns) that so annoys riders who cannot count on regular arrival of vehicles. The scatter shows up in the higher SD values.

Personally, living near the east end of 506, the difference between service before and after September is like night and day. Particularly in the evening and weekends, but also late AM peak and late PM peak. When there are issues now, at least it’s invariably related to some kind of service incident, rather than congestion.
My biggest complaint is that I’m putting on some weight, as I’m no longer suffering unscheduled short-turns at Coxwell, or walking up and down to Kingston Road very often in desparation!
My usual commute requires both 506 and 504, changing at Broadview/Gerrard. 504 has never seemed as bad, being so frequent at peak. I’ve also noticed that my usual morning game of checking if I’m going to get a 504, and then using a backup of 65, 75, 505 – and occasionally even 72/172 or walking to get to King/Front has gotten very dull – often I no longer check until I’m already getting of at Broadview, it’s become so rare to seek an alternative.
In theory, the slightly less frequent in rush hour should create more crowding. In practice though, I think there was more of a tendency for bunching with the second (and especially 3rd) vehicle right behind and often quite empty than it is now.
One failing though, is that TTC still fails to put enough granularity into the schedule. What works at 7:50 AM might not work at 8:15 AM – and I see little effort to work anywhere near that kind of detail into the scheduling – which some suburban agencies seem much better at.
Steve: Granularity is tricky on long routes where the peak is in the middle, although it is possible provided that there is an unbalanced demand in one direction. The best example of this is on 504 King where a wave of trippers provides better (if still inadequate) service eastbound through Parkdale to downtown. Originally this was done with streetcars that made a full trip eastbound, but now with the bus shuttles from Dufferin to Parliament, the “wave” has become full time frequent service from roughly 7:00 am to 9:00 am. This could be done with streetcars too once the TTC has enough of them.
LikeLike
I’m also thinking of granularity in travel time as well as frequency. TTC seems to like to use the same travel time for hours at a time, rather than changing it every 30 minutes or so during peak to reflect actual conditions.
LikeLike
Steve, kudos for a huge amount of observation and analysis. What missing from the TTC data is the consumer centric view of how they serve the people who ride the system. While the TTC is about schedules and headways on specific routes, consumers ask how long will it take me to go from A to B, what options and which is fastest? Private companies become far more successful when they view the world through the consumers view and tune their operations to answering their needs.
Instead of priority focus on maintaining headway and adherence to schedule, the TTC could be far more consumer friendly by adopting a model of virtual agent trips. These VATs would be generated from A to B at specific times and travel on best route basis following actual vehicle performance. VATs would be computer generated but then have to follow actual performance of the system, it would transfer (and wait) for the next bus, subway and streetcar as it “moved” from A to B. Short turn a streetcar? Your VAT suffers and is reported as longer than average trip. Slow driving streetcars would also hurt VAT times. Also there would be incentives generally for the TTC to reduce unnecessary stops, push the City to reduce left turns in front of street cars, give streetcars priority on Spadina etc. These would all be measurable outcomes that improve the service that the consumer sees as long as VAT trips represent actual trips.
Getting the VATs to correlate with actual behaviour would take time. At first it could be a straw plan that is a basket of pre-determined known popular origins and destinations at specific hours. Eventually data could be drawn from a sample of users who allow the TTC access to cell phone data sort of like the Nielsen Ratings for transit.
In order to get VAT times down, the TTC would still have to deal with headway and schedules to manage their operations but those are tools not objectives.
VAT times would be far more valuable to the City in general. They could be compared to walking, cycling and driving, again which are the ways consumers look at their options. Should I take the car or TTC? If the TTC takes triple the time vs a car for substantial volume of VATs then that must be addressed in a better way than letting UBER fill the consumer need.
Steve: The TTC is actually about to implement new metrics based on actual journey times in a manner similar to what you suggest. I think that both measures are valuable — real (simulated) trip time experience as a measure of the system’s general behaviour, and specifics about individual routes to identify underlying problems and patterns.
The new metrics are supposed to show up in the January 2016 CEO’s report, and so we should have some idea of how they work and what they reveal by February when that report comes out.
LikeLike
Kudos for TTC actually tackling short turns. It’s better than doing nothing for the last decade but I don’t think this new metric would improve service towards the end of the lines, especially streetcar lines. I think this on time performance KPI is better for bus services, especially ones with a wider headway. As riders seem to travel beginning to end on buses, short turns affect them more.
On busier routes (particularly rush hour), they need to measure average headways like you do, Steve. As we all know if every vehicle is exactly 5 minutes late, they appear on time to all the riders waiting at the stop. The TTC shouldn’t use a “one system fits all” approach to tackle short turns.
On the 111 East Mall, we can see that there is an improvement for on time departure but on time arrival remains consistently below target. One question is where do they actually measure the end of the line for a large on street loop. The loop for this route is particularly large and some operators don’t wait at the official end of the line which would bring incorrect information if the TTC measures performance based on the last stop.
On a similar note, some operators would depart early or arrive late because they decided to stop by a Tim Horton’s a few stops from the end of the line. This affects the on time performance but not the headway for the service at the next major intersection.
LikeLike
I was on a Queen car Saturday evening, riding from Neville Park to Long Branch loop. We made very good time until the CIS unit beeped, and then we slowed down, waited at intersections, etc. At the start it felt like riding a PCC thirty five or forty years ago, where the streetcar actually moves quickly. How did the TTC run the streetcar routes back in the days when PCCs, with their snappy acceleration, actually got you somewhere pretty quickly?
To answer your title quesiton, “I don’t know, but longer running times mean longer times on the streetcar.”
Steve: I was talking to an operator on King who normally works on Queen. He said that he took a spell on King during the Christmas period so that he could “learn how to drive slowly”. I feel that the TTC relies far too much on the “on time” concept. It is important, but so is headway management. One can never schedule enough time for worst case conditions and should not even try. Under those circumstances, it is best to manage the line with wider but reliable headways and short turns only as absolutely needed. The TTC seems to be trying to avoid anything beyond a simplistic schedule-based management style, and this is doomed to fail. Even worse, route supervisors may lose the skill (or never acquire it) to actively manage service based on actual conditions.
LikeLike
Having lived in Ottawa for twelve years now, versus forty in Toronto, I see plenty of operational differences between the systems of the two cities. Perhaps I’m oversimplifying, but one of the main differences is how routes are treated for recovery time. It always seemed to me that the TTC considered it almost a sin if an operator had any recovery time at the termini points; whereas OC Transpo operators, even in rush hour, have plenty of recovery time. Taking into account that a number of TTC routes are much shorter than any of OC Transpo’s (most being either cross town runs or local milk runs that operate as huge loops), it appears to be common practice that once a bus arrives at a terminus, it pretty much lays over until the next bus arrives, and only then departs. There is quite often a five minute overlap. This is not universal, but nonetheless, rarely, if ever, do buses unload and immediately load up again with passengers. The practice is to park in a marshalling area before returning to service. I surmise this allows for greater leeway in case of a service disruption. If it is clear a bus has not arrived at a terminus to be properly dispatched later, a spare bus will be assigned to that run (although I have observed that does not always happen).
What appears to be the case is that OCTranspo takes great pains in dispatching vehicles at the scheduled time even if it means using a floating bus. Add to that the fact that I can count on ONE HAND in my twelve years here being on a bus that was forced to short-turn. For better or for worse, buses are expected to complete their runs unless it is totally redundant or ridiculous to do so.
It may be silly of me to ask, but, why can’t the TTC be so accommodating to its schedules and drivers? Why does it seem apoplectic at allowing a vehicle a major layover time while allowing a scheduled departure to occurr. Bear in mind, also, that a number of OC Transpo routes are cross-town like 501 QUEEN with sparser end points than middle points vis a vis passenger load.
Steve: The TTC has always resisted formal recovery time as they don’t want it to show up as a requirement in the ATU contract. Some time is allocated, but this has more to do with making headways come out to an even value, or balancing the running times on route branches, than it does with formal “recovery”. Indeed, some of the longest recovery times on the old schedule were at times when they were not really needed, but the merged operation at Humber would not work without them.
LikeLike
This is particularly sad to me. The TTC should not be looking at its management in this fashion, and it should not mix contract, with basic management. The simple practice of providing time, for route management, has nothing to do with contract negotiation, and simply saying no on this point, and being clear it is about the customer and service, and not the driver, should clarify the point – although it would require a consistent, and strong and reasonable management to do so.
LikeLike
As a daily cyclist from Lawrence & Bathurst to King & Bathurst I’d often noticed the #7 bus idling in the evenings at St. Clair and Eglinton. With a frozen bike lock I ended up taking the bus a couple of times northbound in the early evening this week and talked to the operator tonight who stopped at each arterial (St. Clair, Eglinton, Lawrence) for 3 – 5 minutes.
He said that when traffic is light buses idle, but when traffic is heavy the longer running times help them avoid short turns.
My wife who always uses the TTC has complained about the stopping and had assumed they were just milking the clock. Just as short turns and bunching annoy riders, it would be nice if the TTC at least explained/ defended their logic to riders.
Steve: Some systems have formal “time points” where passengers know buses will wait until their scheduled time. This is particularly important on infrequent services because buses tend to show up when expected, and transfer connections are predictable.
LikeLike
The 505 Dundas route a few months prior to the schedule change had it’s line management style changed; the route was put on longer headways and operator change overs were done for reliefs. Short turns would be done primarily for incidents. This is currently done and has been for a long time on 509 Harbourfront, 510 Spadina (mainly by changing the branch destination for each run-another run’s routing) and 511 Bathurst.
Steve and others in another thread commented on too much running time for 509 however they don’t operate to schedule simply because the running time is too short. The route is put on longer headways with operator change overs. Both 509 and 510 have SAC operators.
Steve: Thanks for this background. For 505 Dundas, it certainly fits with the observed change in short turns happening at a different time from the schedule change. On short routes like 509, 510 and 511, operating to a headway and more or less ignoring the schedule makes sense because it is relatively easy to have crew changes occur on time. The challenge for Spadina, particularly with its new schedule and fewer cars, is to maintain service south of King where riders have suffered with spotty service for years.
LikeLike
My question about increased running time is where do you store the cars that don’t need the extra running time? Do they sit at different stops for a couple of lights irritating the riders on board and the autos trying to get by or do they line up on the street outside the loop? The only lines with loops large enough to store extra cars are on Bathurst, Carlton, Queen (west end only) and Queens Quay west end. Dundas, King, and Spadina can barely hold one LFLRV. Downtowner and Kingston Road don’t matter because they don’t have enough service to clog Bingham loop. Has the TTC thought out the problem with inadequate space at most loops?
When I was in Europe 2 years ago most of the systems had large loops that could hold 3 or more articulated cars, often from more than one line, at the same time. The TTC does not have this ability at many lines and there is no easy way to increase it, especially at Dundas West, Spadina, Union or Broadview stations.
LikeLike
I was at Humber loop around 9 AM on Tuesday. The eastbound loop to Neville Park had three ALRVs sitting in it before the first one departed. Sometimes in the middle of the run I hear some beeps from the CIS unit and the streetcar/bus holds at the next stop/traffic light. Sometimes the operator announces the halt, sometimes not. This happens on streetcars and on buses — I’ve had it happen on 29 Dufferin.
The closer to the loop, the less likely a vehicle will be held. Then you get the three-vehicles-in-the-loop scenario.
LikeLike
“….assumed they were just milking the clock…..”
There is an automated announcement to explain this however, operators are too lazy to push the button.
LikeLike
I went by Humber Loop around 1:30 p.m. It had 2 ALRVs on the west bound platform and an ALRV and a CLRV on the inbound side. Also a CLRV had just left. Every car I saw on the Long Branch portion was a CLRV but as I went down Park Lawn I may have missed one.
Steve: It is easy to check the vehicle allocations remotely using the NextBus Google Map display. Click on any vehicle to see what is assigned to it.
LikeLike
No. Based on other cities I’ve lived in … it doesn’t. Longer run times just make the trip longer and then near the end there is a hold up. In the end it needs more vehicles for same frequency, holds up ALL other traffic including cars, bikes and pedestrians and adds to labour costs too. Then a few years down the road they think even more running time will solve the problems longer running times caused.
LikeLike